N-myc and STAT interactor correlates with severity and prognosis in acute-on-chronic liver failure of hepatitis B virus
- PMID: 30771232
- PMCID: PMC6899912
- DOI: 10.1111/jgh.14634
N-myc and STAT interactor correlates with severity and prognosis in acute-on-chronic liver failure of hepatitis B virus
Abstract
Background and aim: Hepatitis B virus-related acute-on-chronic liver failure (HBV-ACLF) is characterized by acute deterioration of chronic liver disease with excessive inflammation. N-myc and STAT interactor (NMI), an inflammation-mediated protein, involves in various inflammatory-related diseases, but the role of NMI in development and prognosis in HBV-ACLF remains to be elucidated.
Methods: Serum NMI from healthy controls (HCs, n = 20), chronic hepatitis B (CHB, n = 50) patients, and HBV-ACLF patients (n = 50) was determined using ELISA. NMI from peripheral blood mononuclear cells and liver was confirmed using quantitative real-time polymerase chain reaction, Western blot, and immunofluorescence.
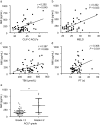
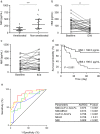
Results: Serum NMI was increased 1.9-fold or 2.2-fold from HBV-ACLF patients compared with that from HCs (P < 0.01) or CHB patients (P < 0.01). Consistently, NMI from peripheral blood mononuclear cells was upregulated significantly from HBV-ACLF patients compared with that from HCs and CHB patients at mRNA and protein levels. Hepatic NMI from HBV-ACLF patients was 2.8-fold higher than that from HCs. Serum NMI was correlated with Model for End-stage Liver Disease, Chronic Liver Failure Consortium ACLF score, and ACLF grades. In contrast, serum NMI was significantly decreased in HBV-ACLF ameliorated patients during follow-up, whereas serum NMI was sustained at high levels in non-ameliorated patients. Elevated serum NMI (≥ 198.5 pg/mL) was correlated with poor survival rate of HBV-ACLF patients. Using receiver operating characteristics curves, it was suggested that serum NMI was a potential biomarker in predicting 3-month mortality of HBV-ACLF patients.
Conclusions: Our study highlights the potential role of NMI in assessing the development and prognosis of HBV-ACLF.
Keywords: N-myc and STAT interactor; acute-on-chronic liver failure; chronic hepatitis B; prognosis.
© 2019 Journal of Gastroenterology and Hepatology Foundation and John Wiley & Sons Australia, Ltd.
Figures


 , NMI‐CLIF‐C ACLFs;
  , NMI‐MELD;
  , CLIF‐C ACLFs;
  , MELD;
  , NMI;
  , reference line. **
P < 0.01; ***
P < 0.001. [Color figure can be viewed at
 Similar articles
-
Soluble mannose receptor as a predictor of prognosis of hepatitis B virus-related acute-on-chronic liver failure.World J Gastroenterol. 2019 Oct 7;25(37):5667-5675. doi: 10.3748/wjg.v25.i37.5667. World J Gastroenterol. 2019. PMID: 31602166 Free PMC article.
-
Serum soluble ST2 is a promising prognostic biomarker in HBV-related acute-on-chronic liver failure.Hepatobiliary Pancreat Dis Int. 2017 Apr;16(2):181-188. doi: 10.1016/s1499-3872(16)60185-6. Hepatobiliary Pancreat Dis Int. 2017. PMID: 28381383
-
Serum levels of miRNA in patients with hepatitis B virus-associated acute-on-chronic liver failure.Hepatobiliary Pancreat Dis Int. 2018 Apr;17(2):126-132. doi: 10.1016/j.hbpd.2018.03.004. Epub 2018 Mar 13. Hepatobiliary Pancreat Dis Int. 2018. PMID: 29602672
-
Early warning and clinical outcome prediction of acute-on-chronic hepatitis B liver failure.World J Gastroenterol. 2015 Nov 14;21(42):11964-73. doi: 10.3748/wjg.v21.i42.11964. World J Gastroenterol. 2015. PMID: 26576085 Free PMC article. Review.
-
Acute-on-chronic liver failure in chronic hepatitis B: an update.Expert Rev Gastroenterol Hepatol. 2018 Apr;12(4):341-350. doi: 10.1080/17474124.2018.1426459. Epub 2018 Jan 16. Expert Rev Gastroenterol Hepatol. 2018. PMID: 29334786 Review.
Cited by
-
N-myc and STAT interactor degrades interferon regulatory factor 7 mediated type I interferon signaling to promote duck Tembusu virus replication.Poult Sci. 2024 Dec;103(12):104269. doi: 10.1016/j.psj.2024.104269. Epub 2024 Aug 28. Poult Sci. 2024. PMID: 39270481 Free PMC article.
-
IFP35 family proteins promote neuroinflammation and multiple sclerosis.Proc Natl Acad Sci U S A. 2021 Aug 10;118(32):e2102642118. doi: 10.1073/pnas.2102642118. Proc Natl Acad Sci U S A. 2021. PMID: 34362845 Free PMC article.
-
Acute-on-Chronic Liver Failure From Chronic-Hepatitis-B, Who Is the Behind Scenes.Front Microbiol. 2020 Dec 7;11:583423. doi: 10.3389/fmicb.2020.583423. eCollection 2020. Front Microbiol. 2020. PMID: 33365018 Free PMC article. Review.
-
Bioinformatics analyses of significant genes, related pathways, and candidate diagnostic biomarkers and molecular targets in SARS-CoV-2/COVID-19.Gene Rep. 2020 Dec;21:100956. doi: 10.1016/j.genrep.2020.100956. Epub 2020 Nov 4. Gene Rep. 2020. PMID: 33553808 Free PMC article.
-
N-myc and STAT interactor is a novel biomarker of severity in community-acquired pneumonia: a prospective study.Respir Res. 2022 Sep 19;23(1):253. doi: 10.1186/s12931-022-02139-x. Respir Res. 2022. PMID: 36123652 Free PMC article.
References
-
- Sarin SK, Choudhury A. Acute‐on‐chronic liver failure: terminology, mechanisms and management. Nat. Rev. Gastroenterol. Hepatol. 2016; 13: 131. - PubMed
-
- Zhang Z, Zou ZS, Fu JL, Cai L, Jin L. Severe dendritic cell perturbation is actively involved in the pathogenesis of acute‐on‐chronic hepatitis B liver failure. J. Hepatol. 2008; 49: 396–406. - PubMed
-
- Bajaj JS, Moreau R, Kamath PS et al Acute‐on‐chronic liver failure: getting ready for prime time? Hepatology 2018; 68: 1621–1632. - PubMed
-
- Zhu M, John S, Berg M, Leonard WJ. Functional association of Nmi with Stat5 and Stat1 in IL‐2‐ and IFNγ‐mediated signaling. Cell 1999; 96: 121. - PubMed
MeSH terms
Substances
Grants and funding
- SZYJTD201717/Suzhou Expert Team of Clinical Medicine
- 16CR1002A/Shanghai Three-Year Plan of the Clinical Skills and Clinical Innovations
- 15GWZK0102/Shanghai Three-Year Plan of the Key Subjects Construction in Public Health-Infectious Diseases and Pathogenic Microorganism
- Shanghai Clinical Key Speciality Construction Project (Infectious Diseases)
- 2014ZX10002002/National Science and Technology Major Project of China
LinkOut - more resources
Full Text Sources
Other Literature Sources

