

Statistical outbreak detection by joining medical records and pathogen similarity
- PMID: 30771483
- PMCID: PMC6424617
- DOI: 10.1016/j.jbi.2019.103126
Statistical outbreak detection by joining medical records and pathogen similarity
Abstract
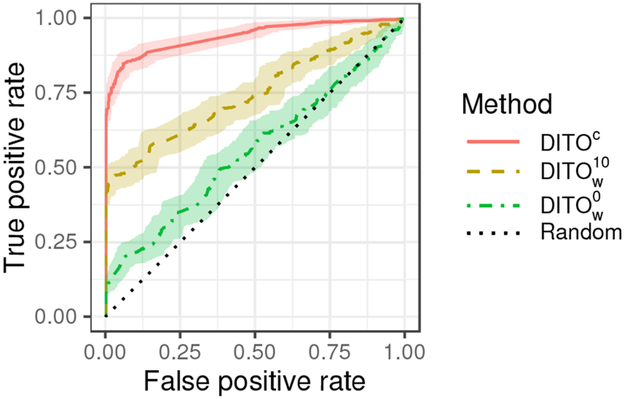
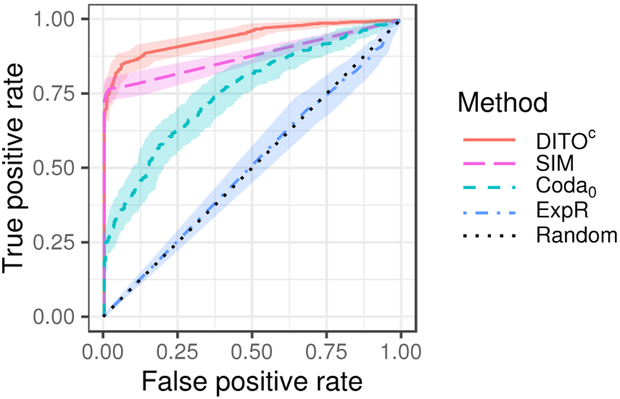
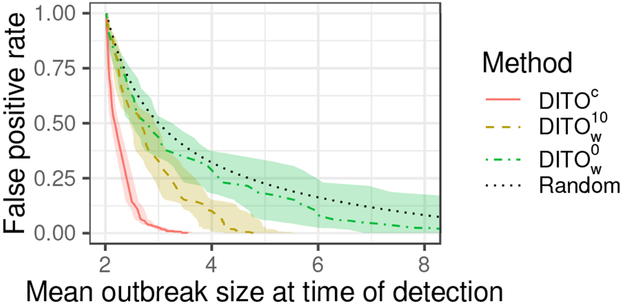
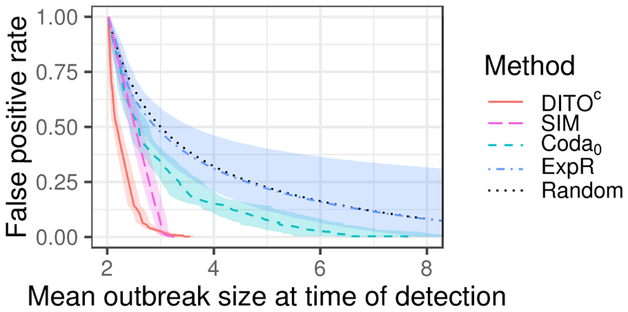
We present a statistical inference model for the detection and characterization of outbreaks of hospital associated infection. The approach combines patient exposures, determined from electronic medical records, and pathogen similarity, determined by whole-genome sequencing, to simultaneously identify probable outbreaks and their root-causes. We show how our model can be used to target isolates for whole-genome sequencing, improving outbreak detection and characterization even without comprehensive sequencing. Additionally, we demonstrate how to learn model parameters from reference data of known outbreaks. We demonstrate model performance using semi-synthetic experiments.
Keywords: Electronic medical records; Epidemiology; Outbreak detection; Statistical inference; Transmission of pathogens; Whole genome sequencing.
Copyright © 2019 Elsevier Inc. All rights reserved.
Figures
References
-
- Baker Meghan A, Huang Susan S, Letourneau Alyssa R, Kaganov Rebecca E, Peeples Jennifer R, Drees Marci, Platt Richard, and Yokoe Deborah S. Lack of comprehensive outbreak detection in hospitals. infection control & hospital epidemiology, 37(4):466–468, 2016. - PubMed
-
- Botev Zdravko I, Kroese Dirk P, Rubinstein Reuven Y, and L’Ecuyer Pierre. The cross-entropy method for optimization In Handbook of statistics, volume 31, pages 35–59. Elsevier, 2013.
-
- Cottam Eleanor M, Thébaud Gaäl, Wadsworth Jemma, Gloster John, Mansley Leonard, Paton David J, King Donald P, and Haydon Daniel T. Integrating genetic and epidemiological data to determine transmission pathways of foot-and-mouth disease virus. Proceedings of the Royal Society of London B: Biological Sciences, 275(1637): 887–895, 2008. - PMC - PubMed
Publication types
MeSH terms
Grants and funding
LinkOut - more resources
Full Text Sources
Other Literature Sources
