. 2019 Mar 5;116(5):893-909.
doi: 10.1016/j.bpj.2019.01.017. Epub 2019 Jan 25.

Influenza Hemagglutinin Modulates Phosphatidylinositol 4,5-Bisphosphate Membrane Clustering

Affiliations

Influenza Hemagglutinin Modulates Phosphatidylinositol 4,5-Bisphosphate Membrane Clustering

Nikki M Curthoys et al. Biophys J. .

Abstract

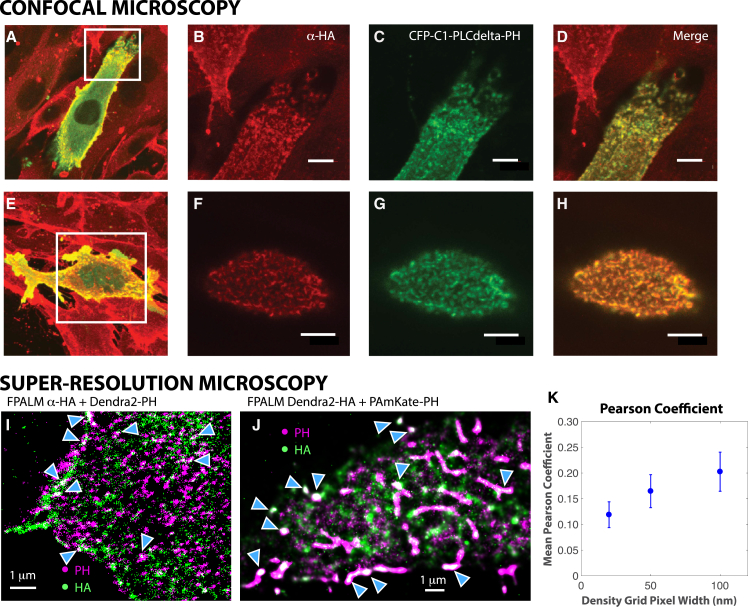
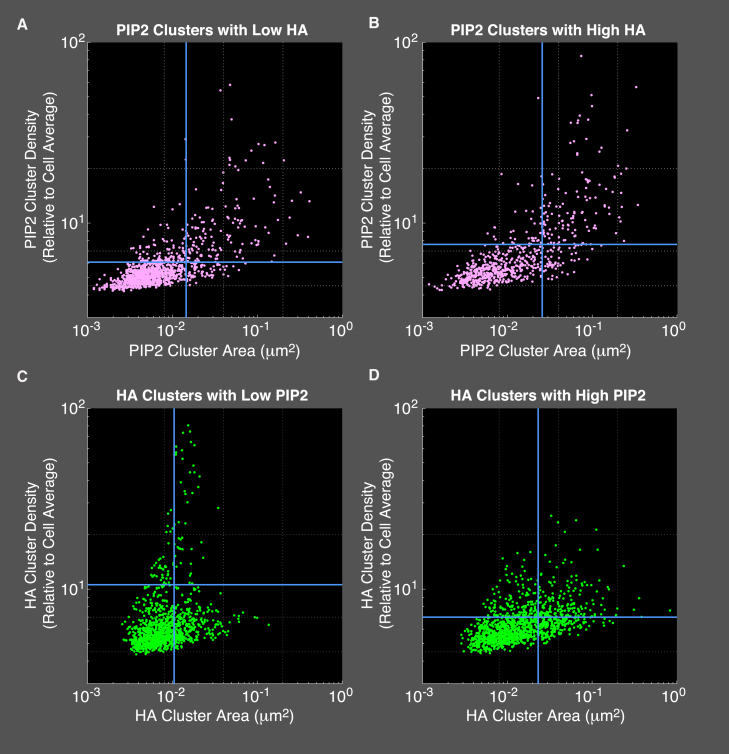
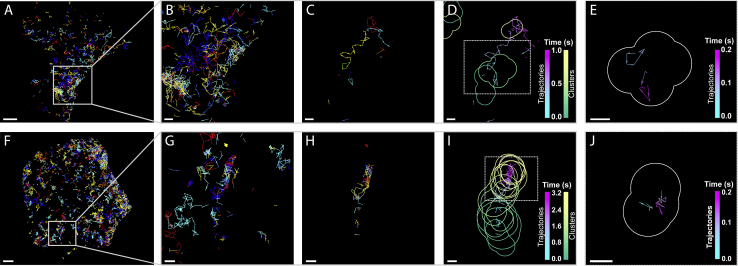
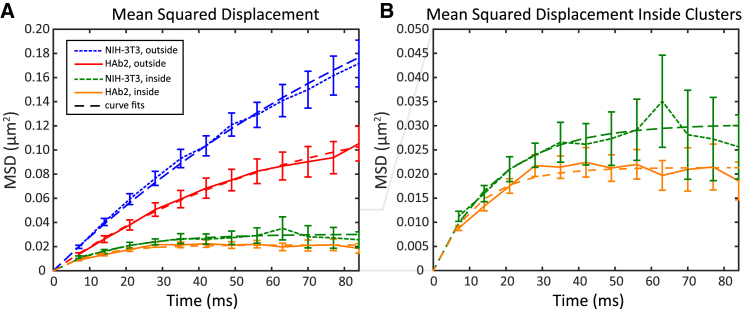
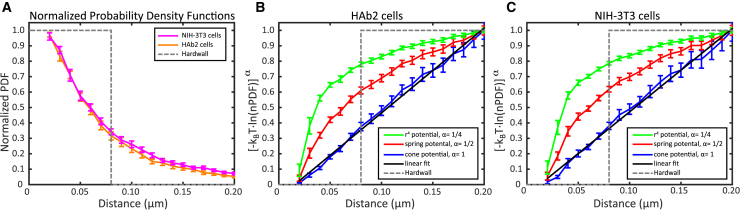
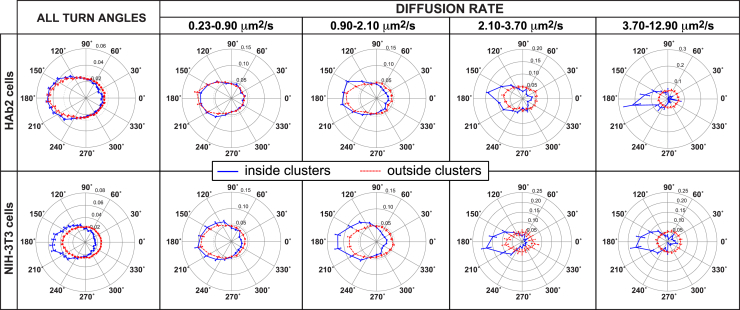
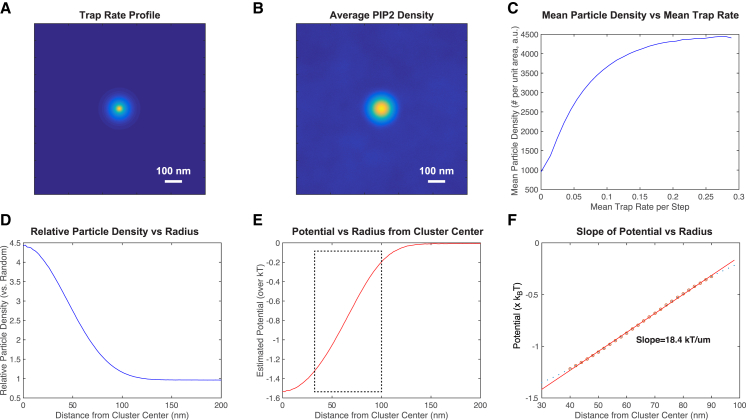
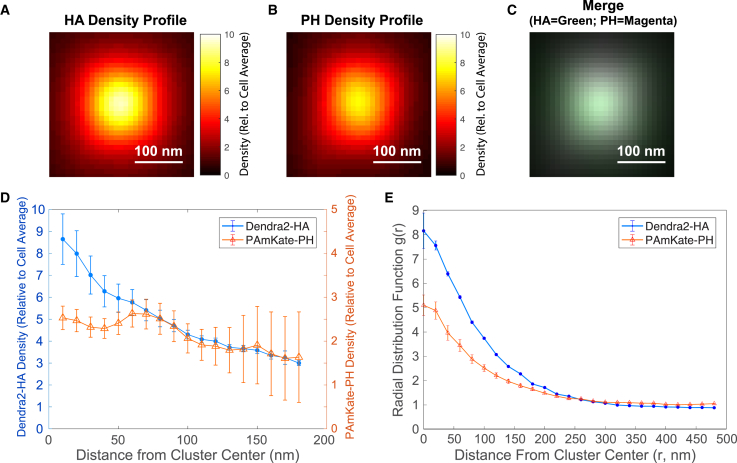
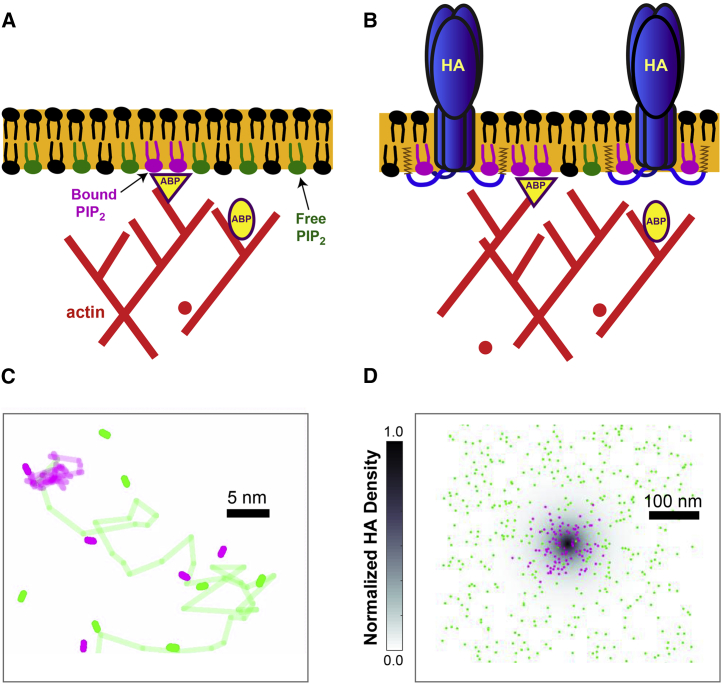
The lipid phosphatidylinositol 4,5-bisphosphate (PIP2) forms nanoscopic clusters in cell plasma membranes; however, the processes determining PIP2 mobility and thus its spatial patterns are not fully understood. Using super-resolution imaging of living cells, we find that PIP2 is tightly colocalized with and modulated by overexpression of the influenza viral protein hemagglutinin (HA). Within and near clusters, HA and PIP2 follow a similar spatial dependence, which can be described by an HA-dependent potential gradient; PIP2 molecules move as if they are attracted to the center of clusters by a radial force of 0.079 ± 0.002 pN in HAb2 cells. The measured clustering and dynamics of PIP2 are inconsistent with the unmodified forms of the raft, tether, and fence models. Rather, we found that the spatial PIP2 distributions and how they change in time are explained via a novel, to our knowledge, dynamic mechanism: a radial gradient of PIP2 binding sites that are themselves mobile. This model may be useful for understanding other biological membrane domains whose distributions display gradients in density while maintaining their mobility.


Figures

Figure 1
Figure 1
Influenza hemagglutinin (HA) coclusters with PIP2 at the PM. Whole HAb2 cells were transfected with PLCδ-PH-CFP (green), a construct encoding the PIP2 binding and labeling the pleckstrin homology (PH) domain. Cells were fixed and immunostained with an HA-specific monoclonal primary antibody and a secondary antibody labeled with Alexa Fluor 647. Confocal projections of all axial slices are shown in (A) and (E), and apical membranes of boxed region in (A) and (E) are shown magnified in (B)–(D) and (F)–(H). Scale bars, 10 μm. (I) A two-color super-resolution (FPALM) image of HA and Dendra2-PH in the ventral surface of fixed HAb2 cells labeled using a primary antibody against HA (Japan) followed by an Alexa647-tagged secondary is shown. Intensity is proportional to the number of localizations within each 20 × 20 nm2 pixel. Note the areas of colocalization of HA and Dendra2-PH (blue filled carats) and also some areas that do not have colocalization. (J) A two-color FPALM image (Gaussian spot plotted for each localization) of the ventral surface of fixed NIH-3T3 cells expressing Dendra2-HA (X31) and PAmKate-PH in a TIRF illumination geometry is shown. Note the areas of colocalization (blue filled carats). (K) Quantification of colocalization using bleedthrough-corrected Pearson coefficient from super-resolution microscopy data sets (images of Dendra2-HA + PAmKate-PH similar to the one shown in (J)) as a function of the size of the grid used for binning localizations is shown. Points represent the mean of 20 cells imaged in three separate biological replicates. Error bars represent standard error.
Figure 2
Figure 2
PIP2 cluster properties with and without influenza HA. Super-resolution microscopy was used to image Dendra2-HA and PAmKate-PH(PLCδ) simultaneously within transfected, fixed NIH-3T3 cells. Localized PAmKate-PH molecules (see Fig. 1) were analyzed to identify clusters of PIP2 (see Materials and Methods), and the properties of those clusters were quantified. (A) A scatter plot of PIP2 cluster properties (pink circles; n = 1065 clusters) yields a mean PIP2 cluster area of 0.0145 ± 0.0020 μm2 and a mean PIP2 cluster density of Drel = 6.1 ± 0.6 in regions of low HA (average of HA density within these clusters was less than 0.05 times the cell average density of HA). (B) A scatter plot of PIP2 cluster properties (n = 666 clusters) but in regions containing high HA (average of HA density of at least five times the cell average) yielded a mean PIP2 cluster area of 0.026 ± 0.006 μm2 and a mean cluster density of Drel = 7.6 ± 0.8 times the cell average. (C) A scatter plot of HA cluster properties (green circles; n = 1140 clusters) yields a mean HA cluster area of 0.0105 ± 0.0005 μm2 and a mean HA cluster relative density of Drel = 10.6 ± 5.0 times the average cell density in regions of low PIP2 (average of PIP2 density within these clusters was less than 0.05 times the cell average density of PIP2). (D) A scatter plot of HA cluster properties (green circles; n = 1233 clusters) with high local PIP2 yielded a mean HA cluster area of 0.0231 ± 0.0014 μm2 and a mean HA cluster density Drel = 7.0 ± 0.5. Data shown are the aggregate of 38 cells and five biological replicates. HA and PIP2 clusters were defined as a local relative density Drel ≥ 4 times the cell average and required ≥10 localizations for further analysis. Mean relative density and area are shown for each condition (blue lines). Uncertainties reported are standard error of the mean of the five independent biological replicates. To see this figure in color, go online.
Figure 3
Figure 3
Confinement of PIP2 in clusters is increased in HAb2 cells. Single-molecule trajectories, recorded in 7 ms exposure times over a 70 s time period, are plotted with a random color assignment for representative NIH-3T3 (A) and HAb2 (F) cells. The regions in the gray boxes are enlarged (B and G) for each cell. For display, trajectories spanning a 3 s period (429 frames) are shown with random color assignments (C and H). Clusters identified with SLCA (in temporal subsets of 200 ms throughout the 3 s period) are overlaid onto the trajectories, with trajectory and cluster color assignments plotted as a function of time (D and I). A 200 ms time increment isolated from each overlay (E and J) shows cluster outlines in white and trajectories plotted according to time. Scale bars, 1 μm in (A) and (F) and 200 nm for all other panels. Rendered images were increased in brightness to improve visibility. To see this figure in color, go online.
Figure 4
Figure 4
Confinement of PIP2 is altered in HAb2 cells. (A) The mean-squared displacement (MSD) of all trajectories inside clusters was calculated for each cell type (HAb2: n = 22 cells, NIH-3T3: n = 25 cells; three replicates of each cell type). Error bars represent the standard error of the mean. The data were fitted to MSD = MSDp × (1 − et/τ), where MSDp represents the plateau value of the curve and τ represents the time constant. MSDp = 0.030 ± 0.002 μm2 (NIH-3T3) and 0.0213 ± 0.0013 μm2 (HAb2), with error equal to the 95% confidence interval. The values approximately correspond to a mean radius of mobility of individual PIP2 molecules as 0.098 ± 0.005 μm for NIH-3T3 cells and 0.082 ± 0.004 μm for HAb2 cells. Diffusion rate inside clusters: (HAb2) 0.61 ± 0.04 μm2/s and (NIH-3T3) 0.61 ± 0.22 μm2/s. Diffusion rate outside clusters: (HAb2) 1.76 ± 0.09 μm2/s and (NIH-3T3) 2.70 ± 0.37 μm2/s. (B) An enlarged view of the MSD for trajectories inside clusters in NIH-3T3 cells (green line) and HAb2 cells (yellow line) is shown. To see this figure in color, go online.
Figure 5
Figure 5
PIP2 molecules are confined with motion characteristic of a “cone” potential. (A) The nPDFs were calculated for the PIP2 trajectories in NIH-3T3 (purple curve) and HAb2 (orange curve) cells as a function of r, the distance from the cluster center. The expected nPDF curve for the hardwall model with a cluster radius of 0.08 μm is overlaid (gray dashed line). (B and C) The linearized nPDF using Eq. 4 (see Materials and Methods) for the cone (blue curve), spring (red curve), and r4 (green curve) potentials are shown for the HAb2 (B) and NIH-3T3 (C) cells. The expected distribution for the hardwall potential (gray dashed lines) with a cluster radius of 0.08 μm is shown (B and C). For both HAb2 and NIH-3T3 cells, the transformed cone potential (blue curve) more closely follows a linear relationship (black dashed line) with the distance from the cluster center, r, than either the spring or r4 potentials. For the cone potential, the slope of the linear fit represents the force acting on the PIP2 molecules: 0.079 ± 0.002 pN (HAb2) and 0.071 ± 0.003 pN (NIH-3T3 cells), respectively (errors are SD from the fit). A Mann-Whitney U-test yielded p = 0.046 for the comparison of the forces (HAb2 versus NIH-3T3). Within (A)–(C), error bars are represented by the SD of the mean (n = 20 and 21 HAb2 and NIH-3T3 cells, respectively, combining data from three replicates). To see this figure in color, go online.
Figure 6
Figure 6
PIP2 turn angle dependence on HA expression and PIP2 clustering. Trajectories were categorized according to diffusion coefficient (see figure for key) and normalized, and fractions of turn angles were plotted. The diffusion coefficients are binned according to the distance moved. The smallest bin, D = 0–0.23 μm2/s (equivalent to a 0–40 nm step per frame), was disregarded because these displacements were approaching the limit of the localization precision (∼25 nm). The bins shown include 0.23–0.9 μm2/s (40–80 nm steps); 0.9–2.1 μm2/s (80–120 nm steps); 2.1–3.7 μm2/s (120–160 nm steps), and 3.7–12.9 μm2/s (160–300 nm steps). The final bin represents all trajectories faster than 3.7 μm2/s; steps within trajectories must be less than 300 nm for them to be counted as part of that trajectory (see Materials and Methods). Only those trajectories that were entirely inside or entirely outside clusters were counted (trajectories crossing cluster borders were not used in these analyses). Figures show an average of n = 15 cells combined from three replicates. Error bars are standard error of the mean. To see this figure in color, go online.
Figure 7
Figure 7
Simulation of interactions between HA and PIP2. PIP2 molecules were simulated to diffuse in a two-dimensional membrane (periodic boundary conditions) in the presence of HA clusters with the experimentally determined spatial distribution (the radial pair correlation function) measured by FPALM (from Gudheti et al. (9)). (A) HAs were considered to be traps for PIP2 with a rate of trapping a PIP2 per time step proportional to the density of HA. (B) The spatial dependence of trapping led to a gradient in density of PIP2 as a function of radius from the center of the HA cluster and (C) as a function of the local concentration of HA. (D) The gradient in density of PIP2 was analyzed in the form of Eq. 1 to measure an effective potential (E). Note the spatial dependence of the potential is approximately linear for the range of ∼30–100 nm, effectively reproducing the experimentally observed cone potential, except at the shortest length scales (<30 nm), at which experimental localization precision precludes measurement. (F) The fit of simulated potential over the experimentally relevant range of distances yields a slope of 18.4 kBT/μm, consistent with the experimentally measured value of 18.9 ± 1.1 kBT/μm (the error given is the 95% confidence interval of the fitted slope). To see this figure in color, go online.
Figure 8
Figure 8
Measured spatial dependence of PAmKate-PH density parallels the density of HA in the vicinity of HA clusters. Analysis of two-color super-resolution microscopy of Dendra2-HA and PAmKate-PH(PLCδ) was performed on HA clusters identified by areas with a local HA density at least four times the average for the cell. (AC) Average density profiles of large HA clusters identified (those with at least 20 localizations) are shown. Each cluster (with density measured relative to the average for that cell) was aligned to place its center of mass at the coordinate origin. Then, the pixel-based sum of all clusters was taken, and the result was divided by the number of clusters averaged. Note the close similarity in the spatial dependence of (A) the Dendra2-HA density and (B) the PAmKate-PH density. (C) shows a merge of the profiles shown in (A) and (D), with HA colored green and PH colored magenta. (D) For each HA cluster, the density of HA and PIP2 were determined within annular shells of uniform 10 nm thickness progressing from the outer edge of the cluster and moving inward until the center of the cluster was reached. The density profile was then averaged for all HA clusters imaged (n = 4010 clusters with at least 10 localizations each from a total of 15 cells from two biological replicates). (E) For each HA cluster, the radial distribution function g(r) was calculated for HA and PIP2 localizations as a function of r, the radial distance from the center of mass of the cluster. As in (D), the value of g(r) is normalized to be 1 when equal to the average density for each cell, then averaged over all clusters (n = 1969 clusters of at least 20 localizations each from a total of 15 cells from two biological replicates). Note the similar decaying trend for both HA and PIP2 as a function of distance. Error bars are the standard error of the mean. To see this figure in color, go online.
Figure 9
Figure 9
Model of the role of HA in PIP2 clustering and dynamics. Spatial gradients in molecular mobility created by transient interactions (direct or indirect) of PIP2 with HA produce a clustered distribution of PIP2 and HA at the nanoscale. (A) Within the PM (orange), PIP2 molecules diffuse freely (green lipids) or with transient binding (magenta lipids) to membrane-associated actin-binding proteins (yellow triangle), leading to a small fraction of PIP2s diffusing with confinement. (B) HA (blue trimers) targets actin-associated membrane regions (ARMRs; Gudheti et al.(9)) and interacts with PIP2 directly or indirectly, leading to increased confinement of PIP2 diffusion and coclustering of HA and PIP2. (C and D) A top-down view of simulated PIP2 trajectories while moving freely (green) or interacting with HA (magenta) is shown. (C) The spatial gradient in lateral diffusion rates serves to bias individual PIP2 trajectories and (D) leads to a clustered distribution together with HA (dark gray zone, D). On a population level, this effect suffices to drive PIP2 clustering toward HA-rich regions (C and D) while both populations maintain some degree of lateral mobility. A video showing the dynamics of simulated PIP2 molecules can be found at https://drive.google.com/open?id=1FZi03muIGvsqLkuoAPk8HTZ37MSNFAG7.

Similar articles

Cited by

References

    1. Kusumi A., Suzuki K.G., Fujiwara T.K. Hierarchical mesoscale domain organization of the plasma membrane. Trends Biochem. Sci. 2011;36:604–615. - PubMed
    1. Simons K., Sampaio J.L. Membrane organization and lipid rafts. Cold Spring Harb. Perspect. Biol. 2011;3:a004697. - PMC - PubMed
    1. Viola A., Gupta N. Tether and trap: regulation of membrane-raft dynamics by actin-binding proteins. Nat. Rev. Immunol. 2007;7:889–896. - PubMed
    1. Cox M.M. Pandemic influenza: overview of vaccines and antiviral drugs. Yale J. Biol. Med. 2005;78:321–328. - PMC - PubMed
    1. Neumann G., Noda T., Kawaoka Y. Emergence and pandemic potential of swine-origin H1N1 influenza virus. Nature. 2009;459:931–939. - PMC - PubMed

Publication types

Substances