. 2019 Mar 5;116(5):772-780.
doi: 10.1016/j.bpj.2019.01.019. Epub 2019 Jan 29.

High-Copy-Number Plasmid Segregation-Single-Molecule Dynamics in Single Cells

Affiliations

High-Copy-Number Plasmid Segregation-Single-Molecule Dynamics in Single Cells

Tai-Ming Hsu et al. Biophys J. .

Abstract

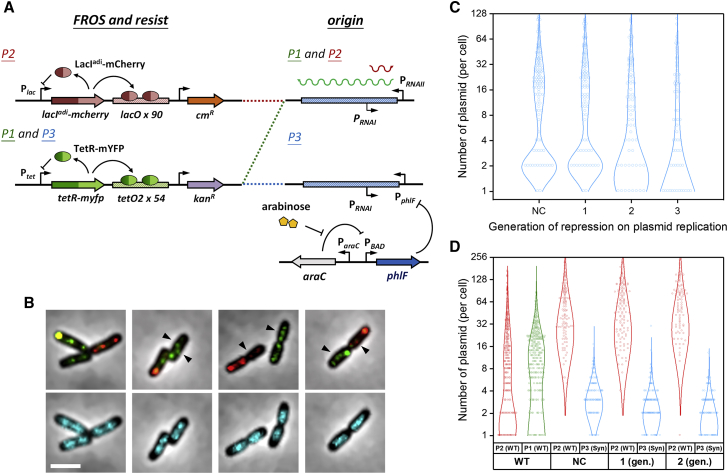
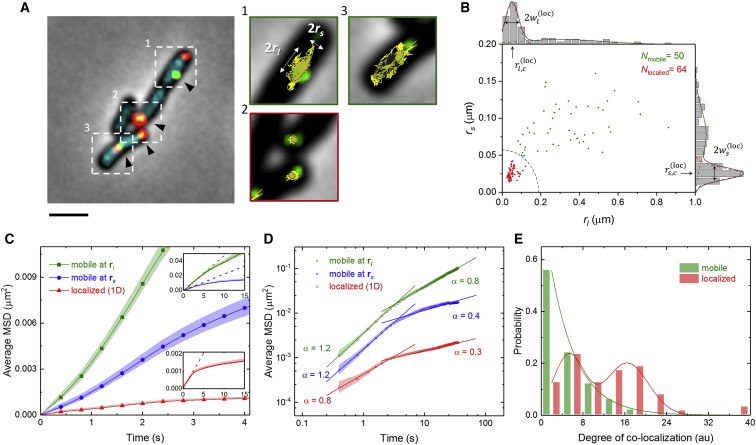
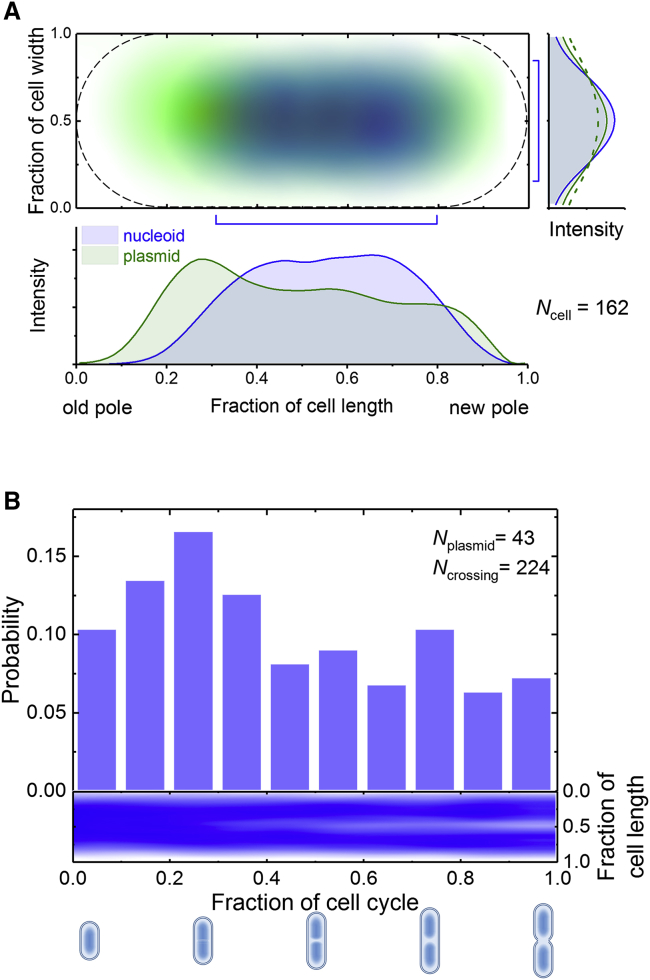
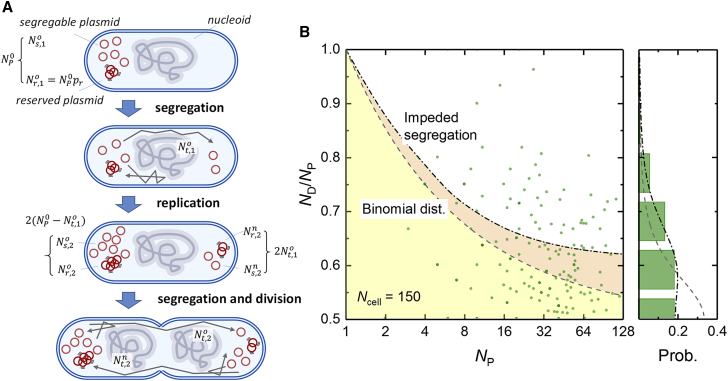
Bacterial high-copy-number (hcn) plasmids provide an excellent model to study the underlying physical mechanisms of DNA segment segregation in an intracellular context. Using two-color fluorescent repressor-operator systems and a synthetic repressible replication origin, we tracked the motion and segregation of single hcn plasmid molecules in individual cells. The plasmid diffusion dynamics revealed between-plasmid temporal associations (clustering) as well as entropic and elastic recoiling forces in the confined intracellular spaces outside of nucleoids. These two effects could be effectively used in models to predict the heterogeneity of segregation. Additionally, the motile behaviors of hcn plasmids provide quantitative estimates of entropic exclusion strength and dynamic associations between DNA segments. Overall, this study utilizes a, to our knowledge, novel approach to predict the polymer dynamics of DNA segments in spatially confined, crowded cellular compartments as well as during bacterial chromosome segregation.


Figures

Figure 1
Figure 1
Single hcn plasmid molecules can be resolved by two-color FROS and copy-number control systems. (A) The design schemes of the self-regulated TetR-YFP/tetO and LacIadi-mCherry/lacO systems are shown. Antibiotic resistance and replication origins, both wt (pTetORK34b (P1) and pLacOIC2c (P2)) and synthetic (pTetORK34p (P3)), are also shown. LacIadi is a LacI mutant that can only form dimers, not tetramers. (B) Photomicrographs show phase contrast images of cells merged with fluorescence images of cotransformed plasmids (P1 (upper panel, green) and P2 (upper panel, red)) or nucleoids (lower panel, cyan). The arrows indicate probable single plasmids that are traveling around the nucleoids. Scale bars, 3 μm. Violin plots show the estimated numbers of plasmids in cells according to generations of repression. (C) Cells were transformed with only P3 (cyan), or (D) cells were additionally transformed with the wt plasmid, P2 (red). The estimated plasmid numbers without repression are presented as the negative control (NC), and those in cells cotransformed with P1 (green) and P2 are also shown for comparison. The circles and lines are histograms and Gaussian fits, respectively. The numbers of cells in the analyzed in (C) are 151, 127, 88, and 87 from left to right. In (D), the numbers of cells are 290, 124, 136, and 103 from left to right. Of note, the asymmetry between P1 and P2 may be due to differences in antibiotic selection. To see this figure in color, go online.
Figure 2
Figure 2
The motion of single plasmids in cells. (A) A merged image shows phase contrast, and fluorescent nucleoids (cyan), single P3 plasmids (green), and P2 (red). The enlarged images correspond to the regions indicated by dashed boxes; only the fluorescence of P3 plasmids is shown along with the plasmid trajectories (yellow lines). To better visualize single plasmids, the green fluorescence intensity is 12-fold higher than that shown in Figs 1A and S1A. Scale bars, 2 μm. (B) Scatter plot and histograms show the characteristic lengths of 5-min trajectories. The dashed line indicates the cutoff criterion separating the localized (red) and mobile (green) groups. (C) and (D) are the average mean-square displacements of the trajectories of the localized (red) plasmids as well as those for mobile plasmids along the long (green) and short (blue) characteristic axes. The color bands represent the standard errors of the means. The solid and dashed lines in the insets of (C) are the experimental data and the linear fits where τ ≤ 2 s, respectively. (E) Colocalization of tracked plasmids with untracked plasmids is shown for single mobile (green) and localized (red) plasmids. The green line shows the Poisson distribution with an expected value of 4.7 arbitrary units (au), and the red line serves as a guide to the eye. To see this figure in color, go online.
Figure 3
Figure 3
Plasmid exclusion from the nucleoid region as shown by the spatial distribution and motion of plasmids. (A) The average fluorescence intensity of the nucleoids (blue) and all plasmids (green) in newly divided cells is presented in a 2D map (upper panel). Intensities are shown along the long (lower panel) and short (right panel) axes of the cells. The solid and dashed lines indicate the respective distribution profiles of the whole cell and the nucleoid region indicated on the 2D map. (B) The probability of the nucleoid-crossing events (upper panel) and the nucleoid distribution along the direction of the cell length (lower panel) is shown according to the cell cycle. The illustrations below the x axis represent the states of the nucleoid segregation in cells. To see this figure in color, go online.
Figure 4
Figure 4
The heterogeneity of hcn plasmid segregation. (A) A scheme showing the simplified impeded model of plasmid segregation, which includes two segregation steps and an intervening replication step. This model represents the processes of plasmid transfer between cell halves and the doubling of the plasmid copies after replication. (B) The proportion of inheritance (ND/NP) of plasmids (green spots) with respect to the copy number in parent cells (left panel) is shown. Each spot indicates a single division event. The upper boundaries of the yellow (gray dashed line) and orange (black dot-dashed line) regions are predicted from the deviations of the probability distributions following the simple random segregation model (analytical solution, 0.5 + Np−1/2) and the impeded segregation model (numerical solution), respectively. The right panel shows the probability distribution of the proportion of inheritance from the experimental results (green bars) as well as the prediction from the random segregation scenario (gray dashed line) and the impeded segregation model (black dot-dashed line). Because of symmetry and the fact that all plasmids should be eventually segregated into either one of the daughter cells, only the half region of the proportion of inheritance (ND/NP ≥ 0.5) is shown. To see this figure in color, go online.

References

    1. Murray A.W. Creative blocks: cell-cycle checkpoints and feedback controls. Nature. 1992;359:599–604. - PubMed
    1. Ruchaud S., Carmena M., Earnshaw W.C. Chromosomal passengers: conducting cell division. Nat. Rev. Mol. Cell Biol. 2007;8:798–812. - PubMed
    1. Wang J.D., Levin P.A. Metabolism, cell growth and the bacterial cell cycle. Nat. Rev. Microbiol. 2009;7:822–827. - PMC - PubMed
    1. Reyes-Lamothe R., Nicolas E., Sherratt D.J. Chromosome replication and segregation in bacteria. Annu. Rev. Genet. 2012;46:121–143. - PubMed
    1. Kleckner N., Fisher J.K., Witz G. The bacterial nucleoid: nature, dynamics and sister segregation. Curr. Opin. Microbiol. 2014;22:127–137. - PMC - PubMed

Publication types

LinkOut - more resources