. 2019 Feb 21;73(4):684-698.e8.
doi: 10.1016/j.molcel.2019.01.021. Epub 2019 Feb 14.

Histone Acetyltransferase p300 Induces De Novo Super-Enhancers to Drive Cellular Senescence

Affiliations

Histone Acetyltransferase p300 Induces De Novo Super-Enhancers to Drive Cellular Senescence

Payel Sen et al. Mol Cell. .

Abstract

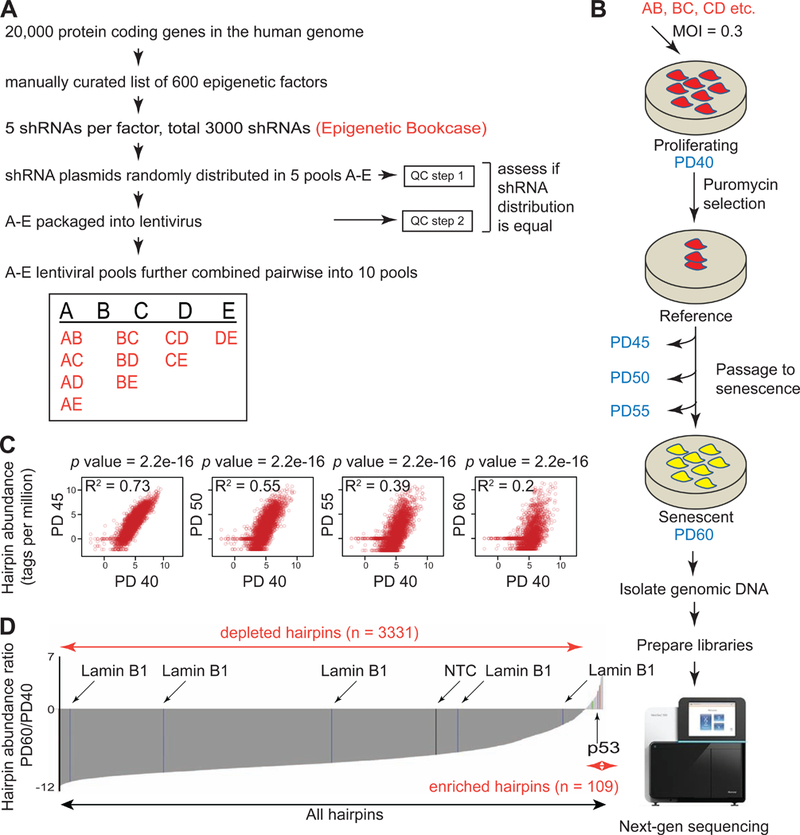
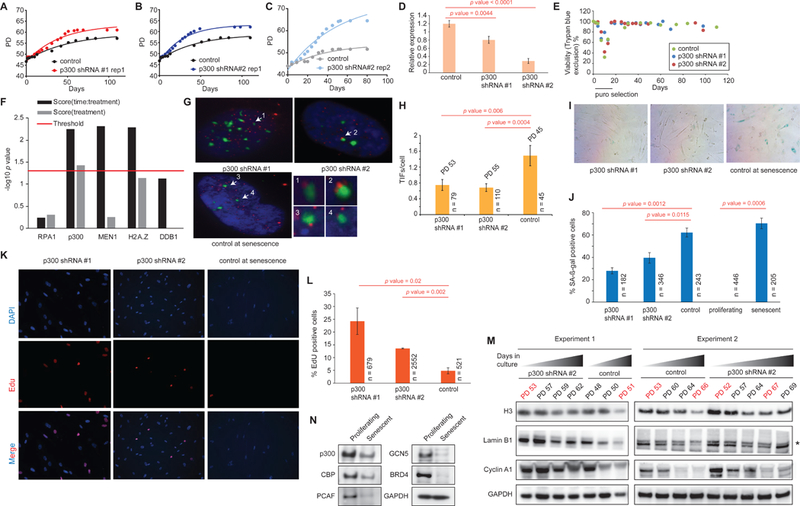
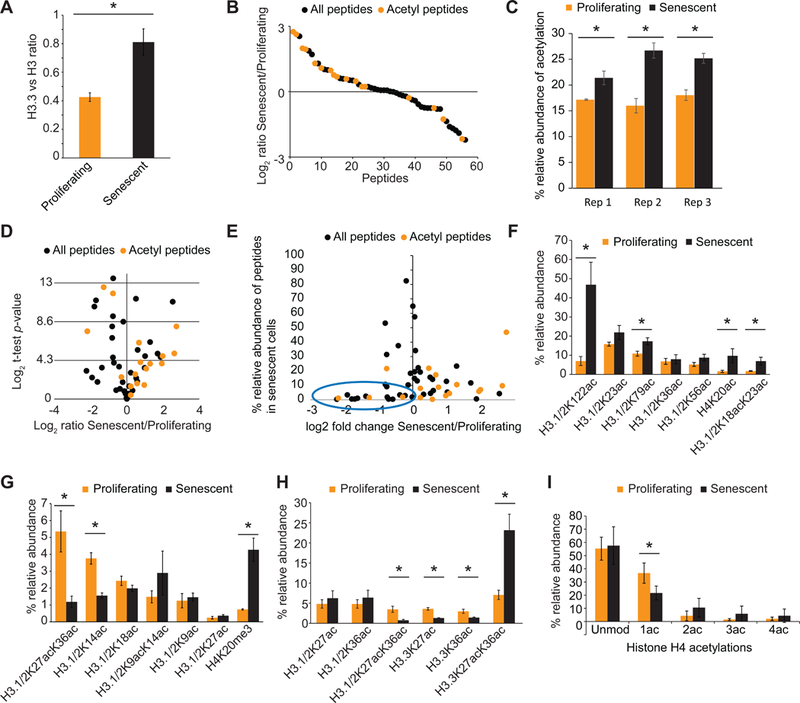
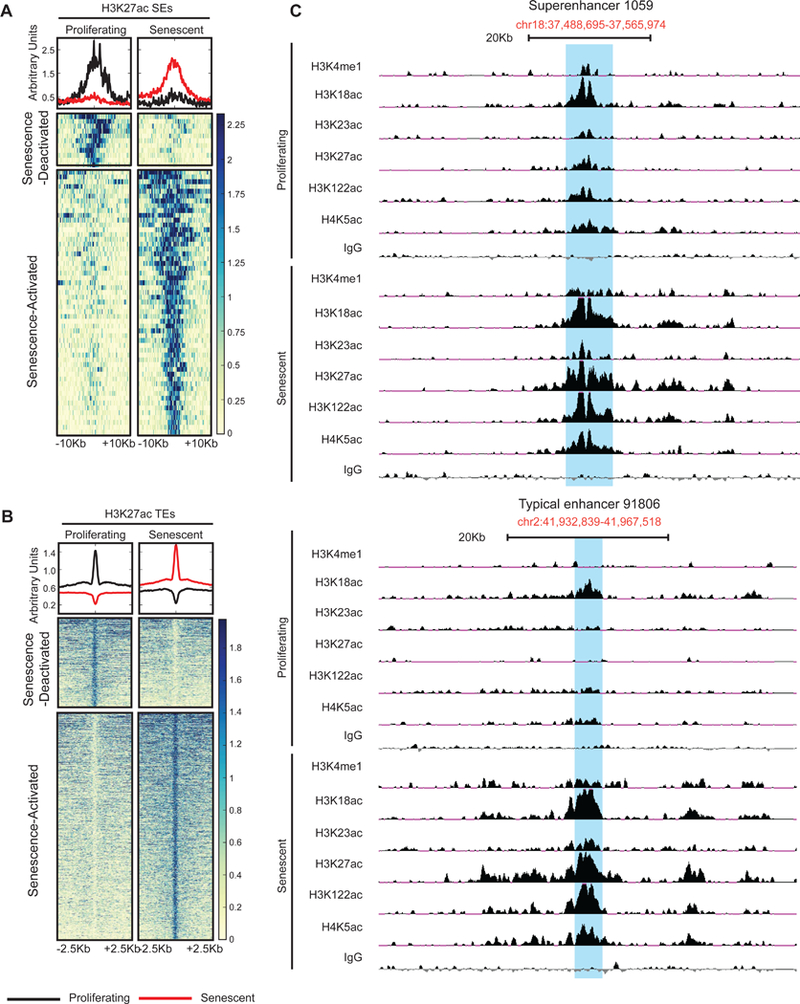
Accumulation of senescent cells during aging contributes to chronic inflammation and age-related diseases. While senescence is associated with profound alterations of the epigenome, a systematic view of epigenetic factors in regulating senescence is lacking. Here, we curated a library of short hairpin RNAs for targeted silencing of all known epigenetic proteins and performed a high-throughput screen to identify key candidates whose downregulation can delay replicative senescence of primary human cells. This screen identified multiple new players including the histone acetyltransferase p300 that was found to be a primary driver of the senescent phenotype. p300, but not the paralogous CBP, induces a dynamic hyper-acetylated chromatin state and promotes the formation of active enhancer elements in the non-coding genome, leading to a senescence-specific gene expression program. Our work illustrates a causal role of histone acetyltransferases and acetylation in senescence and suggests p300 as a potential therapeutic target for senescence and age-related diseases.

Keywords: chromatin; enhancers; epigenetics; p300; senescence.


Conflict of interest statement

Declaration of Interests

The authors declare no competing interests.

Figures

Figure 1:
Figure 1:. RNAi screen for identifying epigenetic factors that regulate RS
(A) Workflow showing the construction of shRNA library. (B) Schematic of the RNAi screen performed in (A). (C) Scatter plot of shRNA abundances during passage to senescence relative to PD40. p values from Wilcoxon tests are indicated. (D) Abundance ratios (PD60 vs PD40) of all shRNAs used in the screen. Non-targeting (NTC), negative (Lamin B1) and positive (p53) control hairpins are indicated.
Figure 2:
Figure 2:. Validation studies with p300 hairpins that emerged as potential candidates from the RNAi screen
(A-C) RLS curves of cells harboring hairpins targeting p300 or a control. (D) qPCR showing KD efficiency of p300 hairpins relative to a housekeeping gene. (E) Representative viability plot during an RS assay with cells harboring p300 KD using trypan blue exclusion. (F) Plot showing p values of lifespan experiments in (A-C) and Figure S2A-X using a repeat measure analysis. The red line indicates the threshold for significance (p=0.05). (G) IF images showing TIF formation in cells harboring a control or p300 hairpin. TIFs (arrow) are assigned if there is co-localization of 53BP1 (green) and Cy3-labeled telomere end (red). Insets show a magnified view of the TIFs. (H) The number of TIFs per cell are counted and plotted. (I) Representative SA-β-gal staining in cells harboring control or p300 hairpins. (J) The number of β-gal positive cells represented as a percentage of total counted cells. (K) IF images showing EdU incorporation in cells harboring a control or p300 hairpin. (L) The percentage of EdU incorporation is estimated by counting the percentage of cells (DAPI, blue in K) that are stained with EdU (red in I) and plotted as a bar plot. (M) Western blots from 2 independent RLS experiments showing the downregulation of histone H3, lamin B1 and cyclin A1 during passage to senescence of cells harboring either p300 or control hairpin. Note that at comparable PDs (indicated in red), cells that are depleted in p300 retain more H3, lamin B1 and cyclin A1 compared to control. (N) Western blots showing protein levels of multiple HATs in proliferating and senescent cells including CBP and p300. n = number of cells scored, p value estimates are from unpaired t-tests.
Figure 3:
Figure 3:. Histone peptides are hyper-acetylated in senescence
(A) Ratio of H3.3 to H3 increases in senescence as previously reported. (B) Ranked enrichment of all histone peptides detected by mass spec are plotted. Many acetylated peptides (red) are enriched in senescence compared to other peptides (black). (C) The relative abundance of acetylated peptides in RS is significantly higher than in proliferating cells in all 3 biological replicate samples. (D) Volcano plot (fold enrichment vs significance) of peptides in 3 replicate mass spec experiments. Peptides above y = 4.3 represent significantly altered peptide abundances. (E) Fold change vs abundance graph showing that acetylated peptides that are decreased in senescence have very low abundance (blue oval). (F) Relative abundance of several acetylated H3.1 peptides that increase in RS. (G) Relative abundance of acetylated H3.1/H3.2 peptides that decrease in RS. H4K20me3 is a positive control. (H) Relative abundance of several acetylated H3.1/3.2 and H3.3 peptides that are altered in RS. Note that H3.1/H3.2K27acK36ac decreases while H3.3K27acK36ac increases significantly upon senescence establishment. (I) Plot showing the abundance of single and multiple acetylations on the H4 4–17 peptide. Note that single acetylations decrease significantly with a shift towards multiple acetylated forms. Asterisk indicates a p<0.05 as assessed by unpaired t-test across 3 biological replicate experiments. Proliferating cells were at PD 26, 31 and 34 while senescent cells at PD 75, 75 and 78.
Figure 4:
Figure 4:. New enhancers are licensed during RS establishment
(A-B) Metaplot and heatmap of Senescence-Activated and -Deactivated SEs (A) and TEs (B) based on H3K27ac signal. (C) Browser track view of an SE (top) and TE (bottom). For histone acetylation and H3K4me1 ChIP-seq, proliferating cells were at PD29–36, and senescent cells at PD75–79 (see TS4 for details).
Figure 5:
Figure 5:. Senescence-Activated SEs correlate with senescence-related gene expression
(A) Schematic showing samples for RNA- and PRO-seq libraries; (1) from proliferating and senescent uninfected cells and (2) senescent cells harboring control or p300-targeting hairpins. (B) Schematic showing the licensing of new enhancers in senescence with chromatin looping, engagement of transcription machineries and production of eRNAs and mRNAs. (C) Table showing the numbers of genomic elements (all, promoter, TE, SE and SE*) and their target genes used to draw box plots in D-G in proliferating and senescence conditions. SE* represents SEs with multiple acetylations. (D) Box plot of fold change of PRO-seq signal (senescence vs proliferating) across different genomic elements in senescence (TE, SE and SE*) measured at the enhancers (left) and the nearest target gene (right). (E) Same as (D) except the genomic elements are called in proliferating cells. (F) Box plot of fold change of RNA-seq signal (senescence vs proliferating or control vs KD) across different genomic elements called in senescence. (G) Box plot of fold change of RNA-seq signal (senescence vs proliferating) across different genomic elements called in proliferating cells. (H) Browser track views of PRO-seq signal at 3 SEs. 2-tailed Mann-Whitney-Wilcoxon Test was used to compare bins within and between boxplots. (I) ChIP signal of various histone acetylations at the promoters of the nearest genes identified as targets of the Senescence-Activated SEs. For PRO-seq, proliferating cells were at PD 20 and senescent cells at PD 76. For RNA-seq, proliferating cells were at PD 29 and 34 while senescent cells were at PD 78 and 79.
Figure 6:
Figure 6:. TEs highly enriched with histone acetylation signal also correlate with senescence-related gene expression
(A) Senescence-Activated TEs were partitioned into 14 unequal sized quantiles and the fold change of RNA-seq signal at target genes plotted. p values are recorded from t-tests comparing “all associated” to Q99–100 (Figure) or each quantile (TS6). (B) Same as in (A) except RNA-seq signal at Senescence-Deactivated TEs are plotted. (C-D) Same as in (A and B) except fold change of PRO-seq signal at the gene targets is plotted. (E-F) Same as in (C and D) except fold change of PRO-seq signal at the TEs (not target genes) is plotted.
Figure 7:
Figure 7:. p300 but not CBP binding drives new SE formation in senescence
(A) Dot plot showing the enrichment of p300 and CBP over 55 Senescence-Activated SEs. (B) Dot plot showing the enrichment of p300 and CBP over op 55 Senescence-Activated TEs. (C-E) CBP and p300 occupancy at all Senescence-Deactivated SEs (C), top 1% Senescence-Deactivated TEs (D) and top 11 Senescence-Deactivated TEs (E). (F-I) Browser track views of p300/CBP signal at 4 SEs. (J) Western blot showing the shRNA-mediated depletion of p300 and CBP in cells used for RS assays in (K-N). (K-N) RLS curves of cells harboring shRNAs targeting CBP in multiple biological replicate experiments. (O) Representative viability plot during an RS assay with cells harboring CBP KD. (P) Plot showing p values of RLS experiments in (K-N) using a repeat measure analysis. The red line indicates the threshold for significance (p=0.05). (Q) Plot showing cumulative cell numbers in an oncogene-induced senescence assay with cells harboring p300, CBP or control hairpins. Asterisk indicates a p<0.0001 in a 2-way ANOVA test. (R) Representative viability plot during the oncogene-induced senescence assay shown in (Q). For p300/CBP ChIP-seq, proliferating cells were at PD 30 and 25, and senescent cells at pD 78 and 76.

Comment in

  • The unusual SASPects.
    Strzyz P. Strzyz P. Nat Rev Mol Cell Biol. 2019 Apr;20(4):195. doi: 10.1038/s41580-019-0111-9. Nat Rev Mol Cell Biol. 2019. PMID: 30770903 No abstract available.

References

    1. Akaike H (1974). A new look at the statistical model identification. IEEE Transactions on Automatic Control 19, 716–723.
    1. Aliper AM, Csoka AB, Buzdin A, Jetka T, Roumiantsev S, Moskalev A, and Zhavoronkov A (2015). Signaling pathway activation drift during aging: Hutchinson-Gilford Progeria Syndrome fibroblasts are comparable to normal middle-age and old-age cells. Aging (Albany NY) 7, 26–37. - PMC - PubMed
    1. Atlasi Y, and Stunnenberg HG (2017). The interplay of epigenetic marks during stem cell differentiation and development. Nat Rev Genet. - PubMed
    1. Baker DJ, Childs BG, Durik M, Wijers ME, Sieben CJ, Zhong J, Saltness RA, Jeganathan KB, Verzosa GC, Pezeshki A, et al. (2016). Naturally occurring p16(Ink4a)-positive cells shorten healthy lifespan. Nature 530, 184–189. - PMC - PubMed
    1. Baker DJ, Wijshake T, Tchkonia T, LeBrasseur NK, Childs BG, van de Sluis B, Kirkland JL, and van Deursen JM (2011). Clearance of p16Ink4a-positive senescent cells delays ageing-associated disorders. Nature 479, 232–236. - PMC - PubMed

Publication types

MeSH terms

LinkOut - more resources