. 2019 Mar 7;176(6):1295-1309.e15.
doi: 10.1016/j.cell.2019.01.023. Epub 2019 Feb 14.

Error-Prone Replication through UV Lesions by DNA Polymerase θ Protects against Skin Cancers

Affiliations

Error-Prone Replication through UV Lesions by DNA Polymerase θ Protects against Skin Cancers

Jung-Hoon Yoon et al. Cell. .

Abstract

Cancers from sun-exposed skin accumulate "driver" mutations, causally implicated in oncogenesis. Because errors incorporated during translesion synthesis (TLS) opposite UV lesions would generate these mutations, TLS mechanisms are presumed to underlie cancer development. To address the role of TLS in skin cancer formation, we determined which DNA polymerase is responsible for generating UV mutations, analyzed the relative contributions of error-free TLS by Polη and error-prone TLS by Polθ to the replication of UV-damaged DNA and to genome stability, and examined the incidence of UV-induced skin cancers in Polθ-/-, Polη-/-, and Polθ-/- Polη-/- mice. Our findings that the incidence of skin cancers rises in Polθ-/- mice and is further exacerbated in Polθ-/- Polη-/- mice compared with Polη-/- mice support the conclusion that error-prone TLS by Polθ provides a safeguard against tumorigenesis and suggest that cancer formation can ensue in the absence of somatic point mutations.

Keywords: DNA polymerase η; DNA polymerase θ; UV lesions; UV signature mutations; error-free translesion synthesis; error-prone translesion synthesis; genomic rearrangements; replication stress; replication through UV lesions; skin cancers.


Conflict of interest statement

DECLARATION OF INTERESTS

The authors declare no competing interests.

Figures

Figure 1.
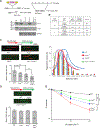
Figure 1.. Requirement of Polθ for Replication through UV Lesions in Human Cells
(A) Schematic of DNA fiber assay and representative images of stretched DNA fibers in UV damaged GM637 HFs treated with control (NC), Polη, Polθ, or Polη and Polθ siRNAs (B) Quantitative analyses of RF progression through UV lesions (mean CldU:IdU ratio). The data represent ~400 DNA fibers from four independent experiments. Error bars indicate the standard deviation. Student’s two-tailed t-test p values, *, p<0.05; **, p<0.01. (C) The % of replication tracts and the CldU:IdU ratios were measured in fibers from UV damaged GM637 HFs treated with NC, Polθ, Polη, or Polη and Polθ siRNAs. The data represent ~400 DNA fibers from four independent experiments. (D) UV survival assay. GM637 HFs were treated with siRNAs for 48h and irradiated with UV light in PBS buffer. Cells were incubated for additional 48h after UV irradiation and UV survival was determined by the MTS assay. Error bars indicate the standard deviation of results of 4 independent experiments. Student’s two-tailed t-test p values, *, p<0.05; **, p<0.01; ***, p<0.001. See also Figure S3.
Figure 2.
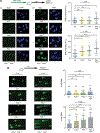
Figure 2.. Analysis of TLS through UV Lesions in Primary Polθ−/−, Polη−/−, and Polθ−/− Polη−/− MEFs
(A) Schematic for targeting the knock outs of Polη and Polθ genes and RT-PCR analyses of Polη−/−, Polθ−/− and Polη−/− Polθ−/− MEFs. GAPDH was used for a negative control. (B) TLS opposite UV lesions in SV40 transformed Polθ−/− MEFs. (C) Analyses of RF progression through UV lesions in primary WT, Polθ−/−, Polη−/−, and Polη−/− Polθ−/− MEFs. (Top left), schematic of DNA fiber assay and representative images of stretched DNA fibers. (Bottom left), quantitative analyses of RF progression through UV lesions (mean CldU:IdU ratio). The data represent ~400 DNA fibers from four independent experiments. Error bars indicate the standard deviation. Student’s two-tailed t-test p values, *, p<0.05; **, p<0.01. (Right), the % of replication tracts and the CldU:IdU ratios measured in fibers from UV damaged primary WT, Polθ−/−, Polη−/−, and Polη−/− Polθ−/− MEFs. The data represent ~400 DNA fibers from four independent experiments. (D) Schematic of DNA fiber assay and images of stretched DNA fibers in unirradiated primary WT and Polη−/− Polθ−/− MEFs and quantitative analyses of RF progression (mean CldU:IdU ratio) in WT, Polθ−/−, Polη−/−, and Polη−/− Polθ−/− MEFs. (E) UV survival of primary WT, Polθ−/−, Polη−/−, and Polη−/− Polθ−/− MEFs. Error bars indicate the standard deviation of results of four independent experiments. Student’s two-tailed t-test p values, *, p<0.05; **, p<0.01; ***, p<0.001. See also Figure S4 and Table S5.
Figure 3.
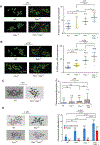
Figure 3.. Generation of ssDNA and formation of DSBs in UV damaged primary Polθ−/−, Polη−/−, and Polη−/− Polθ−/− MEFs.
(A) BrdU immuno-assay for ssDNA detection in UV irradiated or unirradiated MEFs. Cells were treated with BrdU for 20h and irradiated with UV (20 J/m2) or not, followed by 6h incubation. Immuno-staining with BrdU was visualized by fluorescence microscopy. (Left) representative images of BrdU staining in unirradiated or UV irradiated primary WT, Polθ−/−, Polη−/−, and Polη−/− Polθ−/− MEFs; (Right) quantification of BrdU immuno-staining intensity in unirradiated and UV irradiated primary MEFs. The mean and standard deviation were analyzed from 4 independent experiments and are indicated by a horizontal and a vertical black bar, respectively. Student’s two-tailed t-test values, ns, not significant; *, p<0.05; **, p<0.01; ****, p<0.0001. (B) Neutral comet assay for detection of DSBs in unirradiated or UV irradiated MEFs. Comet assay was performed on cells irradiated with UV (20J/m2) and incubated for 6h. (Left), representative images of neutral comet tails in DNA from unirradiated or UV irradiated primary WT, Polθ−/−, Polη−/−, and Polη−/− Polθ−/− MEFs. (Right), quantification of % of DNA in the comet tail in unirradiated and UV irradiated MEFs. The mean and standard deviation were analyzed from 4 independent experiments and are indicated by a numeral and a vertical black bar, respectively. Student’s two-tailed t-test p values, ns, not significant; **, p<0.01; ****, p<0.0001.
Figure 4.
Figure 4.. Analysis of Sister Chromatid Exchanges (SCEs) and Chromosomal Aberrations in UV Damaged Primary Polθ−/−, Polη−/−, and Polη−/− Polθ−/− MEFs
(A) SCEs in unirradiated MEFs. (Left), representative images of metaphases in unirradiated primary WT, Polθ−/−, Polη−/−, and Polη−/− Polθ−/− MEFs. (Right), quantification of SCE frequency in unirradiated primary WT, Polθ−/−, Polη−/− and Polη−/− Polθ−/− MEFs. Each datum point represents a single metaphase and ~1,000 metaphase chromosomes were analyzed. The mean and standard deviation were analyzed from 4 independent experiments and are indicated by a numeral and a vertical black bar, respectively. Student’s two-tailed t-test p values, *, p<0.05; ***, p<0.001; ****, p<0.0001. (B) SCEs in UV irradiated MEFs. (Left), representative images of metaphases with UV (2 J/m2) induced SCEs in primary WT, Polθ−/−, Polη−/−, and Polη−/− Polθ−/− MEFs. (Right), quantification of scatterplot analysis of UV induced SCE frequency in primary WT, Polθ−/−, Polη−/−, and Polη−/− Polθ−/− MEFs. Each datum point represents a single metaphase and ~1,000 metaphase chromosomes were analyzed. The mean and standard deviation were analyzed from 4 independent experiments and are indicated by a numeral and a vertical black bar, respectively. Student’s two-tailed t-test p values, *, p<0.05; ****, p<0.0001. (C) Chromosomal aberrations in unirradiated MEFs. (Left), chromatid breaks in Polη−/− Polθ−/− MEFs. (Right), quantification of chromosomal aberrations in unirradiated primary WT, Polθ−/−, Polη−/− and Polη−/− Polθ−/− MEFs. The data represent analyses of ~400 metaphases from four independent experiments. The mean and standard deviation were analyzed from 4 independent experiments and are indicated by a numeral and a vertical black bar, respectively. Student’s two-tailed t-test p values, ns, non-significant; *, p<0.05. (D) Chromosome aberrations in UV irradiated MEFs. (Left), chromatid breaks (blue arrow) and radial structures (red arrow head) in UV irradiated primary WT, Polθ−/−, Polη−/−, and Polη−/− Polθ−/− MEFs. (Right), quantification of chromosomal aberrations in MEFs. The data represent analyses of ~400 metaphases from four independent experiments. The mean and standard deviation were analyzed from 4 independent experiments and are indicated by a numeral and a vertical black bar, respectively. Two way ANOVA p values, **, p<0.01; ***, p<0.001; ****, p<0.0001.
Figure 5.
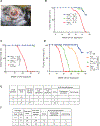
Figure 5.. Skin Tumors Induced by Chronic Exposure to UVB irradiation in Polθ−/−, Polη−/−, and Polη−/− Polθ−/− Mice
(A) UVB-induced skin tumors on the dorsal area of Polθ−/− mice at 42 weeks of UV exposure. (B), (C), and (D) Kaplan-Meier curves of mice free of skin tumors after chronic UVB irradiation (2 KJ/m2, 3 times per week). (B) Polθ+/+, Polθ+/− and Polθ−/− mice. (C) Polη+/+, Polη+/− and Polη−/− mice. (D) WT, Polθ−/−, Polη−/− and Polη−/− Polθ−/− mice. Two way ANOVA p values, ns, non-significant; **, p<0.01; ***, p<0.001; ****, p<0.0001. (E) Results of histopathological analyses of skin tumors from Polθ+/+, Polθ+/− and Polθ−/− mice. aTumors from 23 Polθ−/− mice were analyzed. (F) Results of histopathological analyses of skin tumors from WT, Polη−/− and Polη−/− Polθ−/− mice. bTumors from 23 Polη−/− mice were analyzed. See also Figures S5 and S6 and Table S4.

Comment in

Similar articles

Cited by

References

    1. Besaratinia A, and Pfeifer GP (2006). Investigating human cancer etiology by DNA lesion footprinting and mutagenicity analysis. Carcinogenesis 27, 1526–1537. - PubMed
    1. Biertumpfel C, Zhao Y, Kondo Y, Ramon-Maiques S, Gregory M, Lee JY, Masutani C, Lehmann AR, Hanaoka F, and Yang W (2010). Structure and mechanism of human DNA polymerase η. Nature 465, 1044–1048. - PMC - PubMed
    1. Bunting SF, and Nussenzweig A (2013). End-joining, translocations and cancer. Nat. Rev. Cancer 13, 443–454. - PMC - PubMed
    1. Casasent AK, Schalck A, Gao R, Sei E, Long A, Pangburn W, Casasent T, Meric-Bernstam F, Edgerton ME, and Navin NE (2018). Multiclonal invasion in breast tumors identified by topographic single cell sequencing. Cell 172, 205–217 - PMC - PubMed
    1. Ceccaldi R, Liu JC, Amunugama R, Hajdu I, Primack B, Petalcorin MI, O’Connor KW, Konstantinopoulos PA, Elledge SJ, Boulton SJ, et al. (2015). Homologous-recombination-deficient tumours are dependent on Poltheta-mediated repair. Nature 518, 258–262. - PMC - PubMed

Publication types

Substances