. 2019 Feb 21;176(5):1206-1221.e18.
doi: 10.1016/j.cell.2019.01.024. Epub 2019 Feb 14.

Sexually Dimorphic Control of Parenting Behavior by the Medial Amygdala

Affiliations

Sexually Dimorphic Control of Parenting Behavior by the Medial Amygdala

Patrick B Chen et al. Cell. .

Abstract

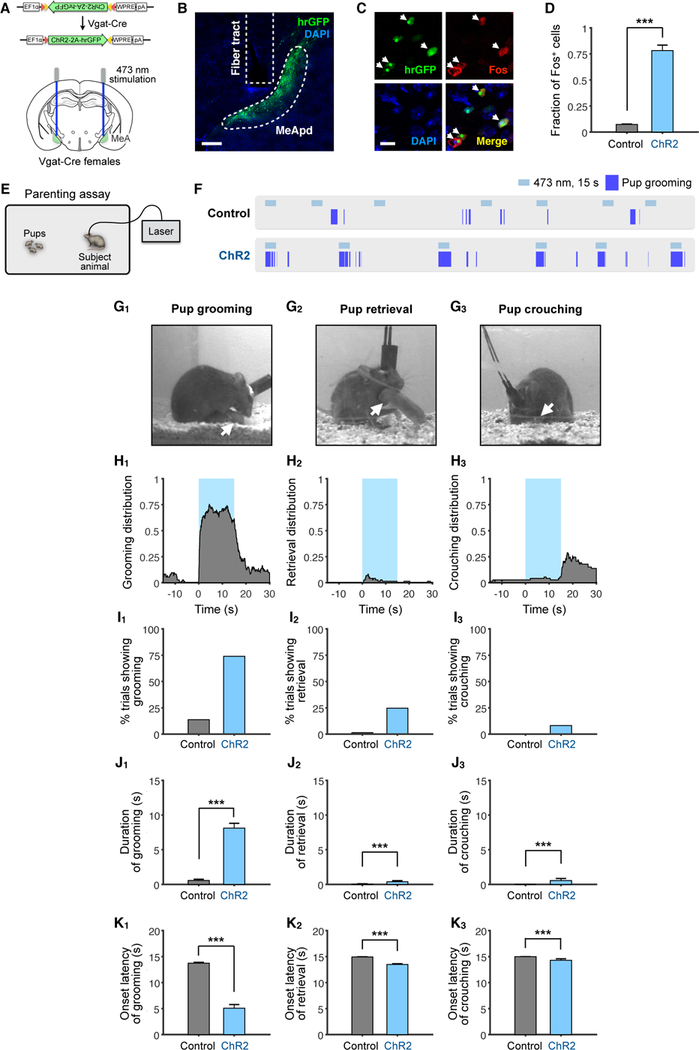
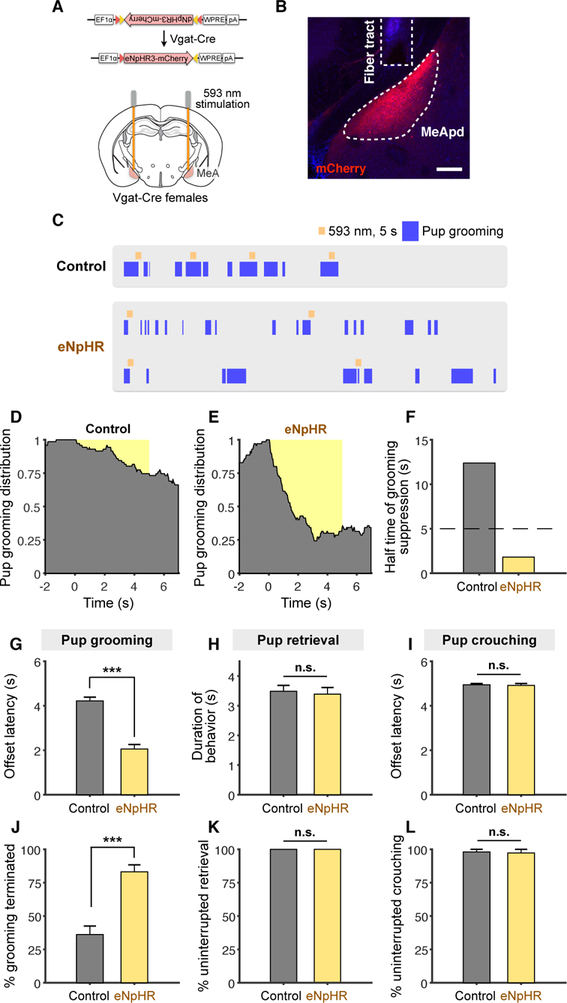
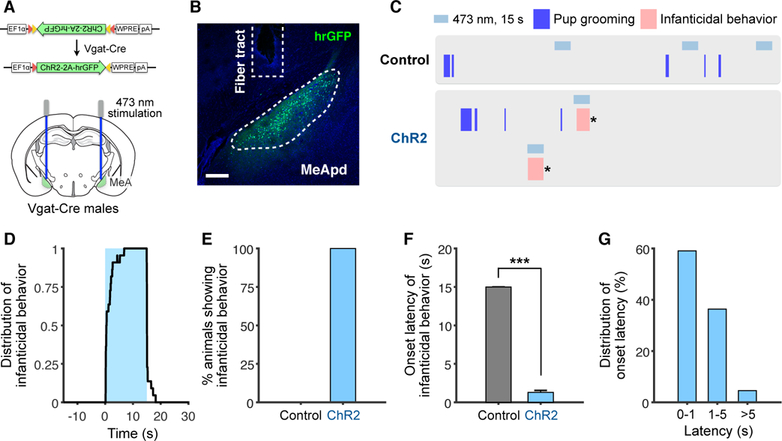
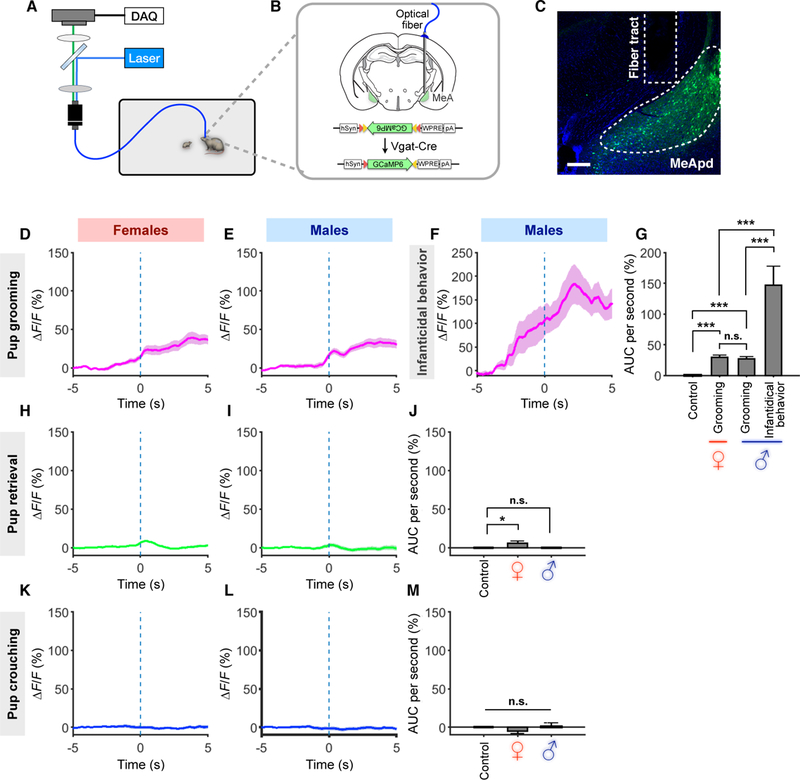
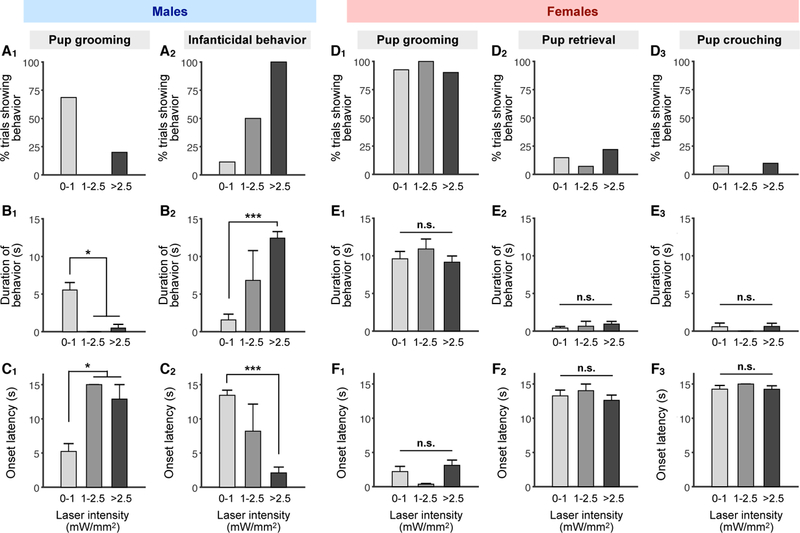
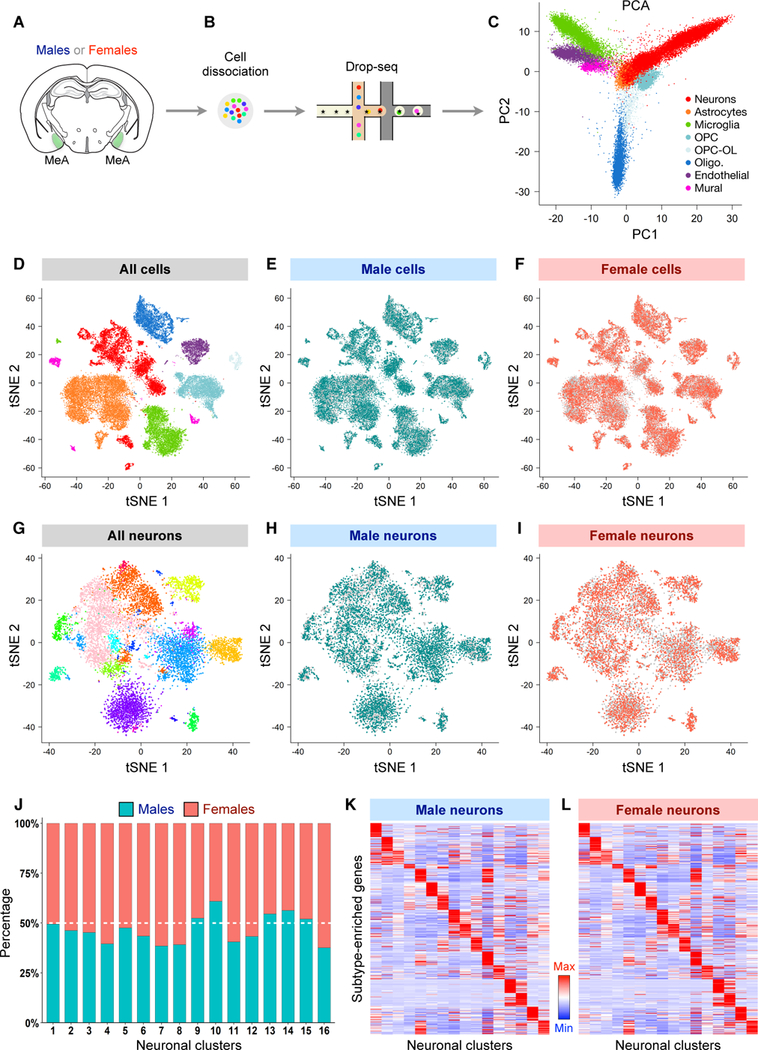
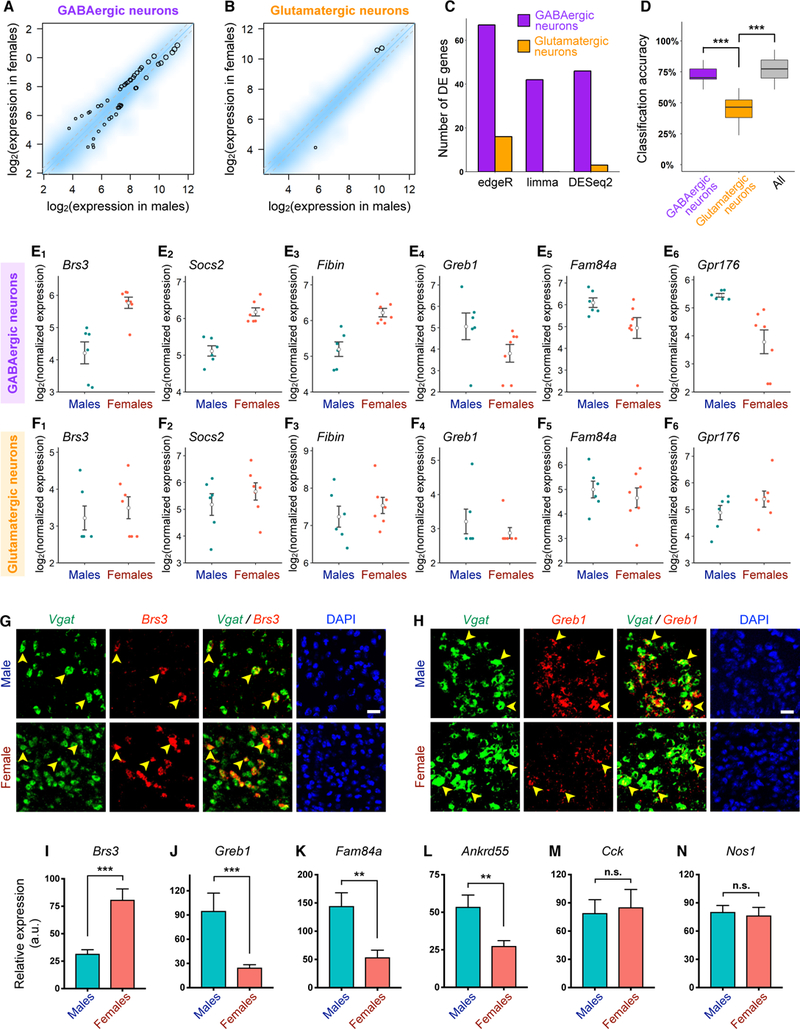
Social behaviors, including behaviors directed toward young offspring, exhibit striking sex differences. Understanding how these sexually dimorphic behaviors are regulated at the level of circuits and transcriptomes will provide insights into neural mechanisms of sex-specific behaviors. Here, we uncover a sexually dimorphic role of the medial amygdala (MeA) in governing parental and infanticidal behaviors. Contrary to traditional views, activation of GABAergic neurons in the MeA promotes parental behavior in females, while activation of this population in males differentially promotes parental versus infanticidal behavior in an activity-level-dependent manner. Through single-cell transcriptomic analysis, we found that molecular sex differences in the MeA are specifically represented in GABAergic neurons. Collectively, these results establish crucial roles for the MeA as a key node in the neural circuitry underlying pup-directed behaviors and provide important insight into the connection between sex differences across transcriptomes, cells, and circuits in regulating sexually dimorphic behavior.

Keywords: GABAergic neurons; grooming; infanticide; medical amygdala; optogenetics; parenting behavior; sequencing; sexual dimorphism; single cell; social behavior.


Conflict of interest statement

DECLARATION OF INTERESTS

The authors declare no competing interests.

Figures

Figure 1.
Figure 1.. Optogenetic Activation of MeApd GABAergic Neurons Promotes Parenting Behavior in Virgin Females.
(A) Schematic of viral injection and fiber implantation strategy for ChR2 stimulation. (B) Example image of injection site and viral expression. Scale bar = 200 µm. (C) Co-localization of Fos expression and ChR2 cells (expressing hrGFP) following photostimulation. Arrowheads: co-localized cells. Scale bar = 50 µm. (D) Quantification of Fos+/GFP+ cells in control and ChR2-injected animals. ChR2, 3 mice; Control, 2 mice. (E) Schematic of parenting assay. (F) Representative raster plots of control and ChR2 animals illustrating photostimulation-induced pup grooming. (G) Example video frames of animals showing different behaviors. Arrows indicate location of pup. (H) Distribution of pup grooming, retrieval, and crouching episodes (percentage of trials showing the indicated behavior at different time points) with respect to stimulation onset. (I) Percentage of trials showing different photostimulation-induced behaviors. (J) Average duration of different behaviors during stimulation. (K) Average latency to different behaviors following onset of photostimulation. If behavior was not observed, latency was considered 15 seconds, which was the duration of stimulation. ChR2, n = 73 trials (6 mice); control, n = 138 trials (10 mice). Mean ± SEM. Wilcoxon rank-sum test. ***p < 0.001. See also Figure S1.
Figure 2.
Figure 2.. GABAergic Neurons Are Required for Natural Pup Grooming in Females.
(A) Schematic of viral injection and fiber implantation strategy for eNpHR inhibition. (B) Example image of injection site and viral expression. Scale bar = 200 µm. (C) Representative raster plots of control and eNpHR animals illustrating suppression of pup grooming during photostimulation. (D-E) Distribution of pup grooming episodes in control and eNpHR animals (percentage of trials showing pup grooming at different time points) with respect to stimulation onset. (F) Half-time of pup grooming suppression in control and eNpHR animals (STAR Methods). (G, I) Average time until termination of pup grooming (G) or crouching (I) following stimulation initiation. Trials that did not show any termination of behavior were considered as a 5 second offset, or the duration of stimulation. (H) Average duration of pup retrieval during stimulation (STAR Methods). (J-L) Average percentage of trials showing termination of pup grooming (J), uninterrupted retrieval (K), and uninterrupted crouching (L). eNpHR, grooming, n = 70 trials; retrieval, n = 28 trials; crouching, n = 29 trials (6 mice); control, grooming, n = 71 trials; retrieval, n = 61 trials; crouching, n = 50 trials (7 mice). Mean ± SEM. Wilcoxon rank-sum test. n.s. not significant, ***p < 0.001. See also Figure S1.
Figure 3.
Figure 3.. Activation of GABAergic Neurons Promotes Infanticidal Behavior in Virgin Males.
(A) Schematic of viral injection and fiber implantation strategy for ChR2 stimulation. (B) Example image of injection site and viral expression. Scale bar = 200 µm. (C) Representative raster plots of control and ChR2 animals illustrating promotion of infanticidal behavior during photostimulation. * indicates when the pup was removed. (D) Distribution of infanticidal behavior episodes in ChR2 animals (percentage of trials showing infanticide at different time points) with respect to stimulation onset. (E) Percentage of animals showing infanticidal behavior. (F) Average latency until infanticidal behavior onset following stimulation initiation. (G) Latency distribution of infanticidal behavior onset following stimulation initiation. ChR2, n = 22 trials (5 mice); control, n = 26 trials (4 mice). Mean ± SEM. Wilcoxon rank-sum test. ***p < 0.001. See also Figure S2.
Figure 4.
Figure 4.. GABAergic Neurons Are Active at Different Levels During Pup Grooming vs. Infanticidal Behavior.
(A-B) Schematic of behavioral assay, injection strategy, and fiber implantation location for fiber photometry recording experiments. (C) Representative injection site and fiber implantation for fiber photometry recording. Scale bar = 200 µm. (D-F, H-I, K-L) Average Ca2+ signal changes during pup grooming in virgin females (D) and virgin males (E) and virgin males with infanticidal behavior (F), during pup crouching in virgin females (K) and virgin males (L), and during pup retrieval in virgin females (H) and virgin males (I). Mean ± SEM. (G, J, M) Comparison of area under curve (AUC) per second during pup grooming and infanticidal behavior (G), pup retrieval (J), and pup crouching (M). GCaMP6s virgin females, grooming, n = 16 trials; retrieval, n = 57; crouching, n = 40; GCaMP6s virgin males, grooming, n = 15; retrieval, n = 25; crouching, n = 35; infanticidal behavior, n = 7. EYFP control, grooming, n = 80; retrieval, n = 69; crouching, n = 204. (3~6 mice for each group). Mean ± SEM; one-way ANOVA with post-hoc Wilcoxon rank-sum with Bonferroni correction. n.s. not significant, *p < 0.05, ***p < 0.001. See also Figure S3.
Figure 5.
Figure 5.. GABAergic Neurons Promote Pup Grooming vs. Infanticidal Behavior in an Activity Level-Dependent Manner.
(A-C) Percentage of trials showing pup grooming and infanticidal behavior (A), average durations of different behaviors during stimulation epochs (B), and average onset latency of different behaviors following initiation of stimulation (C) in virgin males at different photostimulation intensities. (D-F) Percentage of trials showing pup grooming, retrieval, and crouching (D), average duration of pup grooming, retrieval, and crouching during stimulation epochs (E), and average onset latency of pup grooming, retrieval, and crouching following initiation of stimulation (F) in virgin females at different stimulation intensities. Trials where no behavior was observed during the stimulation epoch were considered as a latency of 15 seconds, the duration of stimulation. ChR2 males: 0–1 mW/mm2, n = 35 trials; 1–2.5 mW/mm2, n = 4; >2.5 mW/mm2, n = 5; ChR2 females: 0–1 mW/mm2, n = 27; 1–2.5 mW/mm2, n =14; >2.5 mW/mm2, n = 41 (n ≥ 5 mice for each group). Mean ± SEM; one-way ANOVA with post-hoc Wilcoxon rank-sum with Bonferroni correction. n.s. not significant, *p < 0.05, ***p < 0.001. See also Figure S4.
Figure 6.
Figure 6.. Cell Type Identities and Composition Do Not Differ Between Male and Female MeA.
(A-B) Schematic showing MeA dissection, single-cell dissociation, and sequencing using Drop-seq in virgin males and virgin females. (C) Separation of 44,437 MeA cells from both males (21,715 cells) and females (22,722 cells) by principal component (PC) 1 and PC 2. (D-F) Two-dimensional tSNE visualization showing the distribution of all cells (D), cells from males (E), and cells from females (F) among major MeA cell types. (G-I) Two-dimensional tSNE visualization showing the distribution of all neurons (G), male neurons (H), and female neurons (I) among MeA neuronal subtypes. In (C-I), each dot corresponds to a single cell. Cells are colored according to major cell types (C, D) or neuronal subtypes (G). OPC, oligodendrocyte precursor cells; Olig., oligodendrocytes; OPC-OL, a transitional cell state between OPCs and oligodendrocytes. (J) Bar plots showing the percentage of male and female cells in each neuronal subtype. There was no significant difference between males and females for any subtype (Wilcoxon rank-sum test, FDR > 0.05, n = 6 male samples (12 mice) and 7 female samples (20 mice; STAR Methods). (K-L) Heat maps showing similar expression pattern of select top subtype markers across MeA neuronal subtypes between males (K) and females (L). The same set of markers are shown in K and L, and expression level is averaged within each subtype and normalized for each row (gene) (STAR Methods). See also Figures S5, S6, and S7, Tables S1 and S2.
Figure 7.
Figure 7.. GABAergic Neurons Exhibit Greater Molecular Sex Differences than Glutamatergic Neurons.
(A-B) Smoothed scatter plots showing expression of neuronally enriched genes in females versus males in GABAergic (A) and glutamatergic (B) neurons. Expression level was normalized for each sample (STAR Methods) and averaged across male and female samples. Color reflects density of genes. Black circles highlight genes significantly differentially expressed between males and females based on the DESeq2 method (STAR Methods). Circle size is proportional to mean expression level across all samples. Grey dotted lines = fold change cutoff of 1.3. (C) Number of significantly differentially expressed genes in GABAergic and glutamatergic neurons using three different approaches (STAR Methods). (D) Box plots showing accuracy of classification of male versus female samples using linear discriminative analysis of GABAergic, glutamatergic, or all neurons. (E-F) Dot plots showing expression level of representative genes with significantly higher (E1-E3) or lower (E4-E6) expression in females versus males in GABAergic neurons (E) but not in glutamatergic neurons (F). Each dot represents the summed expression level of each gene over all GABAergic or glutamatergic neurons in an independent biological sample (n = 6 male samples (12 mice) and 7 female samples (20 mice; STAR Methods). Open circles and error bars: mean ± SEM. (G-H) Representative double FISH images showing sex differences in the expression of Brs3 (G) and Greb1 (H) in Vgat+ cells (arrowheads) in the MeApd. Scale bar = 50 µm. (I-N) Quantification of fluorescence intensity of probes specific for each transcript in Vgat+ cells in sections of male and female MeApd. n = 5–9 different sections from 3–5 mice for each sex (STAR Methods). Mean ± SEM; Wilcoxon rank-sum test. n.s. not significant, **p < 0.01, ***p < 0.001. See also Tables S3 and S4.

Comment in

  • Parental controls.
    Whalley K. Whalley K. Nat Rev Neurosci. 2019 Apr;20(4):190-191. doi: 10.1038/s41583-019-0147-z. Nat Rev Neurosci. 2019. PMID: 30808999 No abstract available.

References

    1. Adolphs R (2010). Conceptual Challenges and Directions for Social Neuroscience. Neuron 65, 752–767. - PMC - PubMed
    1. Alexander RD (1974). The Evolution of Social Behavior. Annu. Rev. Ecol. Syst 5, 325–383.
    1. Bian X. (2013). Physiological and morphological characterization of GABAergic neurons in the medial amygdala. Brain Res 1509, 8–19. - PubMed
    1. Chen P, and Hong W (2018). Neural Circuit Mechanisms of Social Behavior. Neuron 98, 16–30. - PMC - PubMed
    1. Chen TW, Wardill TJ, Sun Y, Pulver SR, Renninger SL, Baohan A, Schreiter ER, Kerr RA, Orger MB, Jayaraman V, et al. (2013). Ultrasensitive fluorescent proteins for imaging neuronal activity. Nature 499, 295–300. - PMC - PubMed

Publication types