. 2019 Apr 2;29(4):1003-1011.e4.
doi: 10.1016/j.cmet.2019.01.014. Epub 2019 Feb 14.

Serine Metabolism Supports Macrophage IL-1β Production

Affiliations

Serine Metabolism Supports Macrophage IL-1β Production

Arianne E Rodriguez et al. Cell Metab. .

Abstract

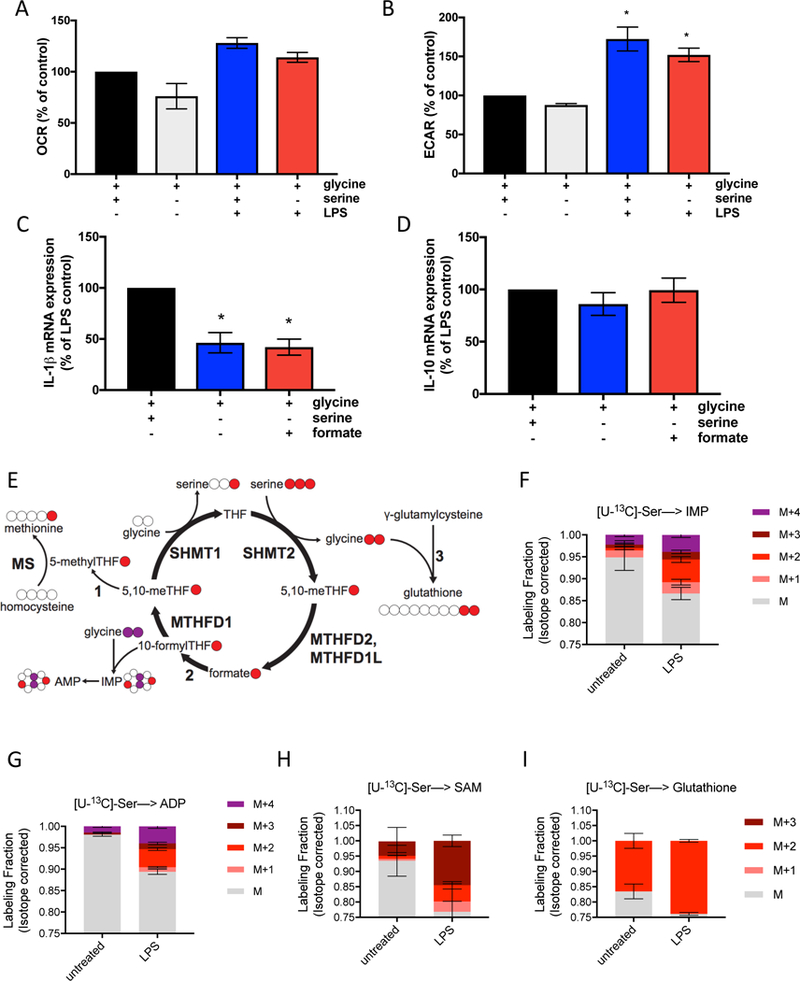
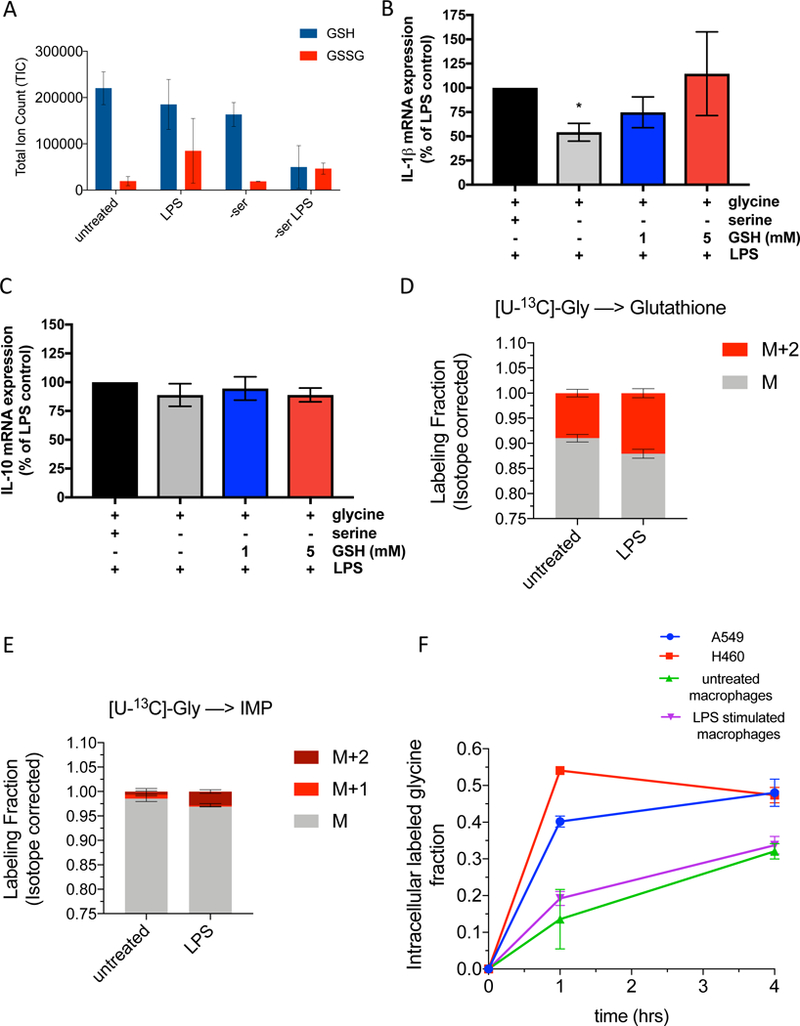
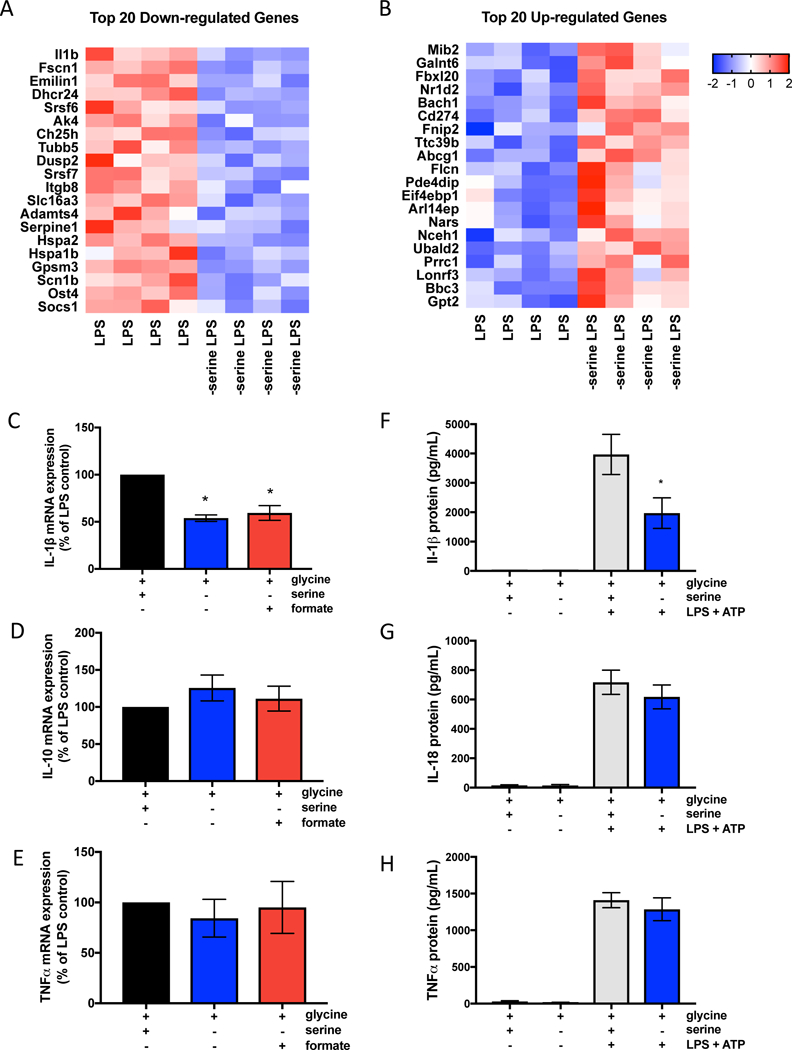
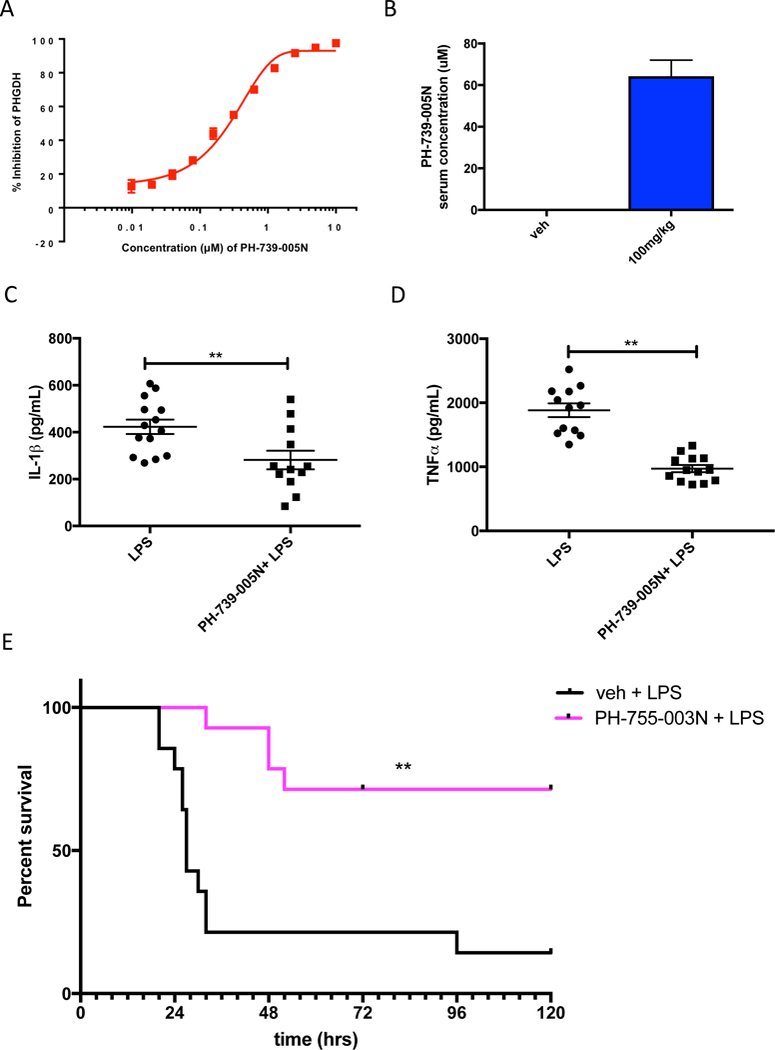
Serine is a substrate for nucleotide, NADPH, and glutathione (GSH) synthesis. Previous studies in cancer cells and lymphocytes have shown that serine-dependent one-carbon units are necessary for nucleotide production to support proliferation. Presently, it is unknown whether serine metabolism impacts the function of non-proliferative cells, such as inflammatory macrophages. We find that in macrophages, serine is required for optimal lipopolysaccharide (LPS) induction of IL-1β mRNA expression, but not inflammasome activation. The mechanism involves a requirement for glycine, which is made from serine, to support macrophage GSH synthesis. Cell-permeable GSH, but not the one-carbon donor formate, rescues IL-1β mRNA expression. Pharmacological inhibition of de novo serine synthesis in vivo decreased LPS induction of IL-1β levels and improved survival in an LPS-driven model of sepsis in mice. Our study reveals that serine metabolism is necessary for GSH synthesis to support IL-1β cytokine production.

Keywords: IL-1beta; LPS response; glutathione; immunometabolism; inflammation; macrophage; one-carbon metabolism; sepsis; serine metabolism.


Figures

Figure 1.
Figure 1.. Serine is necessary for optimal IL-1β gene expression.
(A) Oxygen consumption rate (OCR) in peritoneal macrophages stimulated with 100ng/mL LPS for 4 hours with or without extracellular serine. Control is untreated macrophages. (n=3) (B) Extracellular acidification rate (ECAR) in peritoneal macrophages stimulated with 100ng/mL LPS for 4 hours with or without serine. Control is untreated macrophages. (n=3) (C) IL-1β and (D) IL-10 mRNA expression in peritoneal macrophages stimulated with 100ng/mL LPS for 4 hours with or without extracellular serine. (n=8) (E) Schematic of U-[13C]-Serine labeling. (F-I) U-[13C]-Serine labeling of IMP, ADP, SAM and GSH (n=3) in peritoneal macrophages after stimulation with 100ng/mL LPS for 4 hours. For A-D, Peritoneal macrophages were cultured in media with or without 400μM serine, containing 400μM glycine, and supplemented with 1mM sodium formate where indicated. Data are shown as mean ± SEM or ± SD (F-I). For A-D, p values were calculated using a paired one-way ANOVA compared to untreated cells or LPS stimulated cells, respectively. *p<0.05.
Figure 2.
Figure 2.. Serine metabolism supports LPS induction of GSH synthesis, which is required for IL-1β gene expression
(A) Total ion counts of NEM derivitized GSH and GSSG in peritoneal macrophages (n=3). (B) IL-1β and (C) IL-10 mRNA expression in peritoneal macrophages stimulated with 100ng/mL LPS for 4 hours in control or serine-depleted media, supplemented with 1 mM or 5mM cell permeable glutathione (GSH) reduced ethyl ester. Data is normalized to LPS treated macrophages with serine and glycine and without GSH (n=5). (D) U-[13C]-Glycine labeling of GSH in peritoneal macrophages (n=3) at 4 hours post LPS treatment. (E) U-[13C]-Glycine labeling of IMP in peritoneal macrophages (n=3) at 4 hours post LPS treatment. (F) Glycine uptake over time as measured by the intracellular U-[13C]-Glycine fraction in A549 cells, H460 cells, and peritoneal macrophages untreated or stimulated with LPS for 4 hours. Data are shown as mean ± SD (A, D-F) or ± SEM (B-C). For B-C, p values were calculated using a one-way paired ANOVA compared to LPS stimulated cells. *p<0.05.
Figure 3.
Figure 3.. Serine deprivation diminishes IL-1β gene expression of BMDMs without altering inflammation-associated gene networks or inflammasome activation.
(A) Heat map of 20 down-regulated genes and (B) 20 up-regulated genes in serine deprived bone marrow derived macrophages (BMDMs) stimulated with 100ng/mL LPS for 4 hours with or without extracelluar serine. (C) IL-1β, n=6 (D) IL-10, n=6 (E) TNFα, n=3 mRNA expression in BMDMs stimulated with 100ng/mL LPS for 4 hours with or without extracellular serine. Data is normalized to LPS treated macrophages with serine and glycine. (F) Protein secretion of IL-1β, n=6 (G) IL-18, n=7 (H) TNFα, n=4 in BMDMs primed with 100ng/mL LPS for 6 hrs followed by 5mM ATP for 30mins. For (A-B), BMDMs (n=4) were stimulated with 100ng/mL LPS for 4 hours in the presence or absence of serine. See tables for complete RNAseq list of up-regulated and down-regulated genes in serine deprived BMDMs stimulated with LPS compared to control BMDMs stimulated with LPS. For C-H, BMDMs were cultured in media with 400μM glycine, with or without 400μM serine, and supplemented with 1mM sodium formate where indicated. Data are shown as mean ± SEM. p values were calculated using a one-way paired ANOVA compared to LPS stimulated cells. *p<0.05.
Figure 4.
Figure 4.. De novo serine synthesis is required for LPS responses in vivo.
(A) Percent inhibition of PHGDH activity by the inhibitor PH-739–005N as measured by glucose incorporation into serine. (B) Concentration of PH-739–005N in the serum of mice at 4.5 hours post i.p. injection with 100mg/kg PH-739–005N. Data are shown as mean ± SEM (n=12). (C) IL-1β and (D) TNFα protein concentrations in serum of mice at 1.5 hours post-LPS administration. Mice were i.p. injected with 100mg/kg PH-739–005N for 3 hours followed by i.p. injection of LPS (15mg/kg) for 1.5 hrs. (E) Survival curve of mice in a LPS-induced endotoxemia model. Mice were i.p. injected with 100mg/kg PH-755–003N and 3 hours later i.p. injected with 25mg/kg of LPS (n=14). Mice were again i.p. injected with 100mg/kg PH-755–003N 15 hours post-LPS administration. For B-D, data are shown as mean ± SEM. p values were calculated using a two tailed Student’s t test. For E, data was analyzed using a Log Rank (Mantel-Cox) statistical test for survival (n=14). *p<0.05; **p<0.01.

References

    1. Baardman J, Verberk S, Prange K, Weeghel M, Velden S, Ryan D, Wüst R, Neele A, Speijer D, Denis S, et al. (2018). A Defective Pentose Phosphate Pathway Reduces Inflammatory Macrophage Responses during Hypercholesterolemia. Cell Reports 25, 2044–2052.e5. - PubMed
    1. Bambouskova M, Gorvel L, Lampropoulou V, Sergushichev A, Loginicheva E, Johnson K, Korenfeld D, Mathyer M, Kim H, Huang L-H, et al. (2018). Electrophilic properties of itaconate and derivatives regulate the IkBζ-ATF3 inflammatory axis. Nature 556, 501–504. - PMC - PubMed
    1. Broz P, and Dixit VM. (2016). Inflammasomes: mechanism of assembly, regulation and signalling. Nature Review Immunology, 16:407–20. - PubMed
    1. Cantor J, Abu-Remaileh M, Kanarek N, Freinkman E, Gao X, Louissaint A, Lewis C, and Sabatini D (2017). Physiologic Medium Rewires Cellular Metabolism and Reveals Uric Acid as an Endogenous Inhibitor of UMP Synthase. Cell 169, 258–272.e17. - PMC - PubMed
    1. Cordes T, Wallace M, Michelucci A, Divakaruni A, Sapcariu S, Sousa C, Koseki H, Cabrales P, Murphy A, Hiller K, et al. (2016). Immunoresponsive Gene 1 and Itaconate Inhibit Succinate Dehydrogenase to Modulate Intracellular Succinate Levels. J Biol Chem 291, 14274–14284. - PMC - PubMed

Publication types