. 2019 Apr 2;29(4):966-978.e4.
doi: 10.1016/j.cmet.2019.01.016. Epub 2019 Feb 14.

Glutamine Metabolism Regulates Proliferation and Lineage Allocation in Skeletal Stem Cells

Affiliations

Glutamine Metabolism Regulates Proliferation and Lineage Allocation in Skeletal Stem Cells

Yilin Yu et al. Cell Metab. .

Abstract

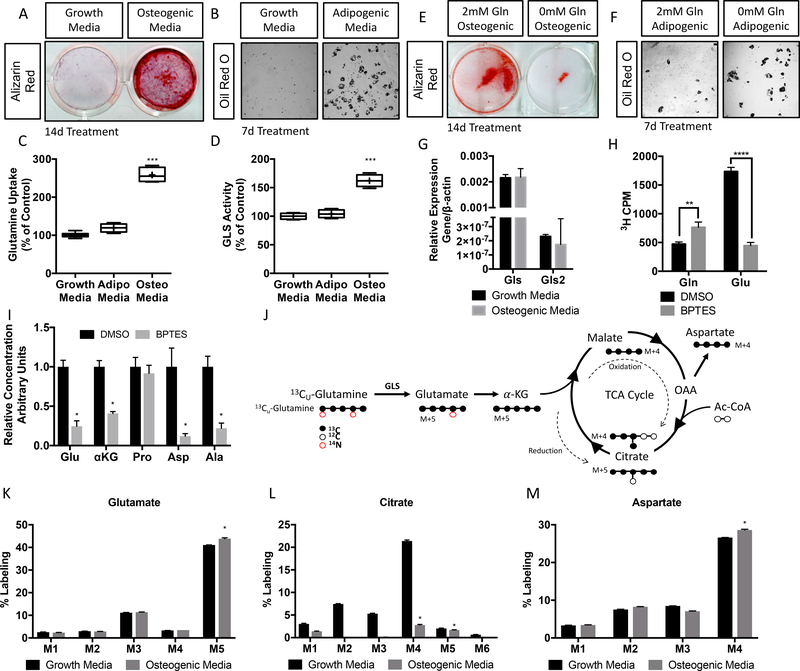
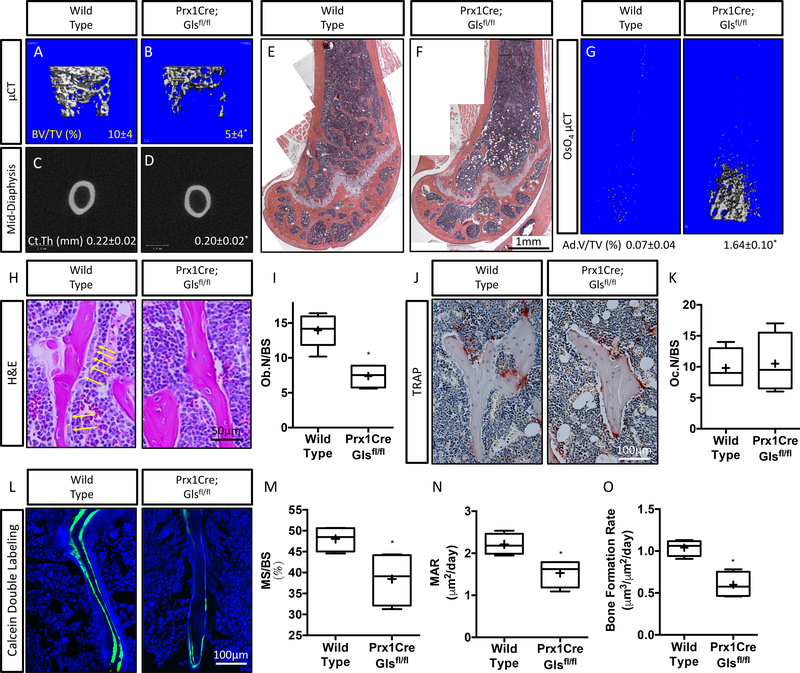
Skeletal stem cells (SSCs) are postulated to provide a continuous supply of osteoblasts throughout life. However, under certain conditions, the SSC population can become incorrectly specified or is not maintained, resulting in reduced osteoblast formation, decreased bone mass, and in severe cases, osteoporosis. Glutamine metabolism has emerged as a critical regulator of many cellular processes in diverse pathologies. The enzyme glutaminase (GLS) deaminates glutamine to form glutamate-the rate-limiting first step in glutamine metabolism. Using genetic and metabolic approaches, we demonstrate GLS and glutamine metabolism are required in SSCs to regulate osteoblast and adipocyte specification and bone formation. Mechanistically, transaminase-dependent α-ketoglutarate production is critical for the proliferation, specification, and differentiation of SSCs. Collectively, these data suggest stimulating GLS activity may provide a therapeutic approach to expand SSCs in aged individuals and enhance osteoblast differentiation and activity to increase bone mass.

Keywords: alpha ketoglutarate; glutaminase; glutamine metabolism; lineage specification; osteoporosis; skeletal stem cell.


Figures

Figure 1:
Figure 1:. Skeletal stem cells increase glutamine consumption and metabolism during osteoblast differentiation.
(A) Alizarin Red staining of SSC induced to undergo osteoblast differentiation for 14 days. (B) Oil Red O staining of SSC induced to undergo adipocyte differentiation for 7 days. (C-D) Tukey box and whisker plot of measurements of glutamine uptake (C) or GLS activity (D) in SSC after 7 days of differentiation. Median and mean are represented by the line and cross respectively. n=5. (E-F) Effect of glutamine withdrawal on osteoblast (E) or adipocyte (F) differentiation in SSC. (G) RT-qPCR analyses of gene expression in SSC cultured for 7 days in osteogenic media. (H) Effect of BPTES on GLS activity in SSC. (I) Effect of BPTES on metabolite concentration measured by mass spectrometry. (J) Graphical depiction of tracing glutamine metabolism using [U-13C]glutamine). Black filled circles indicate 13C whereas black open circles and red open circles denote 12C and 14N respectively. OAA – oxaloacetate, αKG – α-ketoglutarate, ac-CoA – Acetyl-CoA. (K-M) Fractional contribution of [U-13C]glutamine to glutamate (K), citrate (L), and aspartate (M). **p≤0.005, ***p≤0.0005, ****p≤0.00005. See also Figure S1.
Figure 2:
Figure 2:. Gls ablation reduces bone mass in vivo.
(A-D) Representative μCT images of a 4-month old Prx1Cre;Glsfl/+ (Wild Type) or Prx1Cre;Glsfl/fl mutant mouse. BV/TV – Bone volume/Tissue Volume. Ct.Th – Cortical Thickness. (E-F) Representative H&E stained distal femur of 4-month female mice. (G) Representative OsO4 μCT images of a 4-month old female mice. Ad.V/TV – Adipose volume/tissue volume. (H) Representative H&E stained section used to quantify osteoblasts (arrows). (I) Tukey box and whisker plot of the quantification of osteoblast numbers (Ob.N) per bone surface. (J) Representative TRAP stained section used to quantify osteoclast numbers. (K) Tukey box and whisker plot of the quantification of osteoclast numbers (Oc.N) per bone surface. (L) Representative calcein double labeled sections of the distal femur from 4-month old mice. (M-O) Tukey box and whisker plots of the quantification of mineralized surface per bone surface (MS/BS) (M), mineral apposition rate MAR (N), or bone formation rate (BFR) (O) derived from calcein double labeling. Median and mean are represented by the line and cross respectively. N=5. *p≤0.05. See also Figure S2 and Table S1.
Figure 3:
Figure 3:. Gls is required for osteoblast specification and differentiation from SSC.
Representative images and quantification of colony forming unit (CFU) assays stained with Crystal Violet (A-C), alkaline phosphatase (D-F), Von Kossa (G-I), or Oil Red O (J-L). (C, F, I, L) Tukey box and whisker plots displaying colonies containing at least 50 cells. n=13 or 14 for wild type or Prx1Cre;Glsfl/fl respectively . (M) Functional assays or RT-qPCR (N) analyses of the effect of Gls deletion on cell fate decision in primary SSC cultured in osteogenic and adipogenic media for 14 days. n=4 mice. *p≤0.05, **p≤0.005, ****p≤0.00005. See also Figure S3.
Figure 4:
Figure 4:. Gls acts in SSC to regulate lineage allocation.
(A-B) Representative μCT image of trabecular bone from a 4-month old LeprCre;Glsfl/+ (Wild Type) or LeprCre;Glsfl/fl mutant mouse. BV/TV – Bone Volume/Tissue Volume. (C-D) Representative TRAP stained section used to quantify osteoclast numbers. (E) Tukey box and whisker plot of the quantification of osteoclast numbers (Oc.N) per bone surface. (F-G) Representative OsO4 μCT images of the tibia from 4-month old mice. Ad.V/TV – Adipose volume/tissue volume. n=8 or 12 for wild type or LeprCre;Glsfl/fl respectively. (H-J) Representative immunofluorescent staining for Osteocalcin (OCN) used to quantify osteoblast numbers (Ob.N/BS) in (J). (K) Anti-Perilipin (PLIN) and anti-tomato immunofluorescent staining of 4 month old LeprCre;R26tdTomato/+;Glsfl/+ (Wild type) or LeprCre;R26tdTomato/+;Glsfl/fl hindlimbs. Inset images of boxed region show individual channels (K’, K’’, K’’’, L’, L’’, L’’’). Quantification of PLIN, tomato double positive cells shown in (K’’’ and L’’’). n=3. *p≤0.05, Student’s t test. See also Figure S4 and Table S3.
Figure 5:
Figure 5:. Gls activity is required for SSC proliferation and expansion.
(A) Colony forming unit (CFU) assay of 4-month old LeprCre;Glsfl/+ (Wild Type) or LeprCre;Glsfl/fl mutant littermates. (B-C) Tukey box and whisker plots of the number of colonies per mouse containing greater than 50 cells (B) or greater than 10 cells (C). (D) Prevalence of colonies binned for cell number. N ≥ 208 colonies from 6 animals. (E-H) CFU assay (E,G) or Tukey box and whisker plots (F,H) showing the effect of glutamine withdrawal (E-F) or GLS inhibition treatment (G-H) on the number of colonies containing at least 50 cells isolated from 4-month old C57Bl/6 wild type mice. n=6 mice. (I-J) Effect of glutamine withdrawal (I) or (J) GLS inhibition on EDU incorporation in SSC. (K) Western blot analyses of the effect of GLS inhibition on cell cycle protein expression in ST2 cells. (L) Western blot analyses of cell cycle markers in SSC cultured in mineralization media for up to 7 days. Phosphorylated-Histone H3 normalized to total Histone H3; others normalized to β-Actin. Fold change ± SD relative to control for 3 independent experiments. *p≤0.05, **p≤0.005, ***p≤0.0005, ****p≤0.00005. See also Figure S6.
Figure 6:
Figure 6:. Transaminase dependent αKG production is critical for SSC proliferation.
(A-B) CFU assay (A) or Tukey box and whisker plots (B) showing the effect of glutamine withdrawal and supplementation with downstream metabolites on colony formation in 4-month old C57Bl/6 wild type mice. n=5 mice. (C) Graphical depiction of tracing glutamine metabolism using 15Nα-glutamine. Red filled circles denote 15N whereas black and red open circles denote 12C and 14N respectively. OAA – oxaloacetate. (D) The effect of BPTES treatment on the fractional contribution of 15Nα-glutamine to glutamate, aspartate and alanine. (E-F), CFU assay (E) or Tukey box and whisker plots (F) showing the effect of BPTES, AOA, or Bithionol on colony formation. n=5 mice.

References

    1. (2004). In Bone Health and Osteoporosis: A Report of the Surgeon General, (Rockville (MD: ). - PubMed
    1. Almeida M, Han L, Martin-Millan M, O’Brien CA, and Manolagas SC (2007). Oxidative stress antagonizes Wnt signaling in osteoblast precursors by diverting beta-catenin from T cell factor- to forkhead box O-mediated transcription. J Biol Chem 282, 27298–305. - PubMed
    1. Bai XC, Lu D, Bai J, Zheng H, Ke ZY, Li XM, and Luo SQ (2004). Oxidative stress inhibits osteoblastic differentiation of bone cells by ERK and NF-kappaB. Biochem Biophys Res Commun 314, 197–207. - PubMed
    1. Balani DH, Ono N, and Kronenberg HM (2017). Parathyroid hormone regulates fates of murine osteoblast precursors in vivo. J Clin Invest 127, 3327–3338. - PMC - PubMed
    1. Becker DJ, Kilgore ML, and Morrisey MA (2010). The societal burden of osteoporosis. Curr Rheumatol Rep 12, 186–91. - PubMed

Publication types

LinkOut - more resources