. 2019 Apr 18;26(4):471-481.e3.
doi: 10.1016/j.chembiol.2019.01.005. Epub 2019 Feb 14.

Detection of Low-Abundance Metabolites in Live Cells Using an RNA Integrator

Affiliations

Detection of Low-Abundance Metabolites in Live Cells Using an RNA Integrator

Mingxu You et al. Cell Chem Biol. .

Abstract

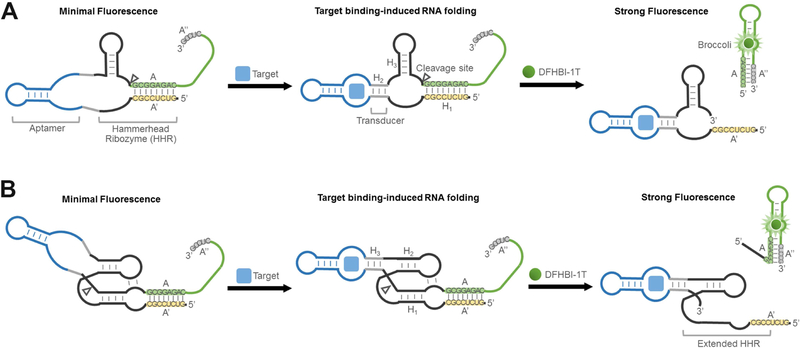
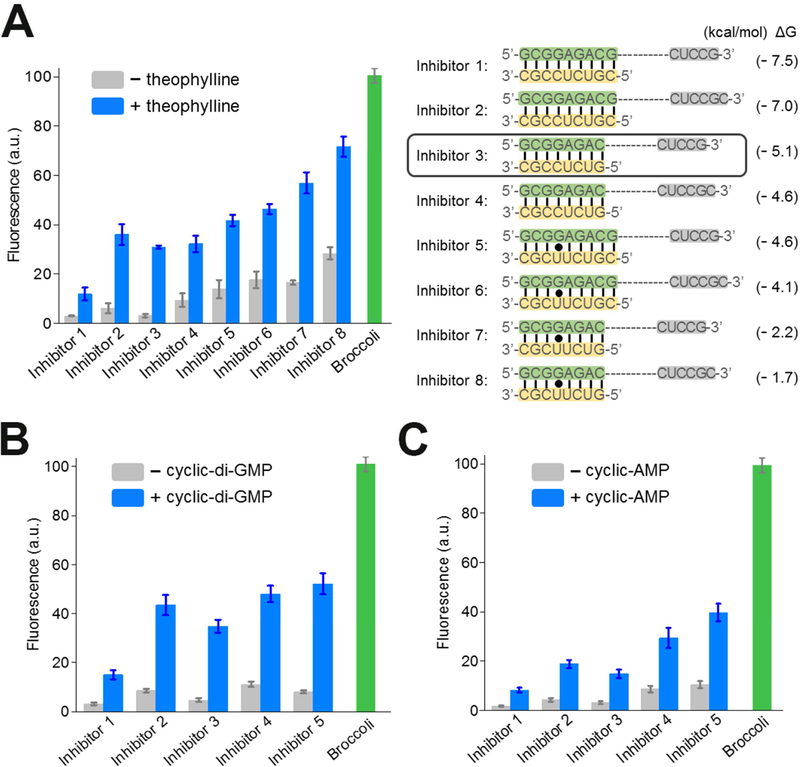
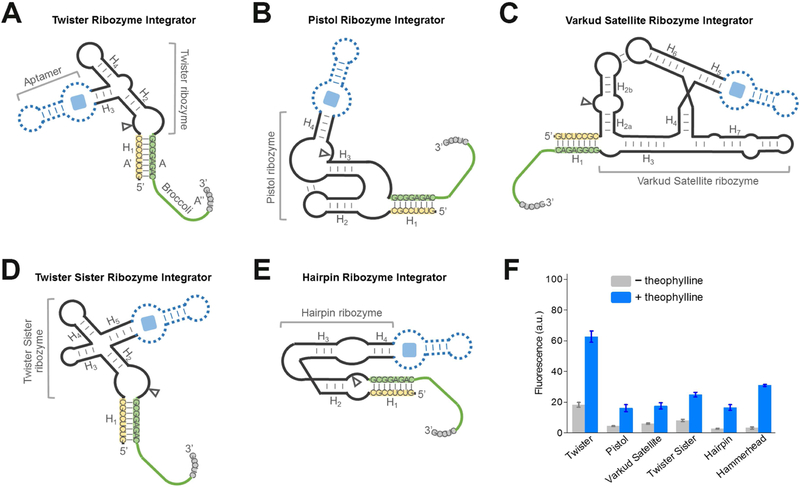
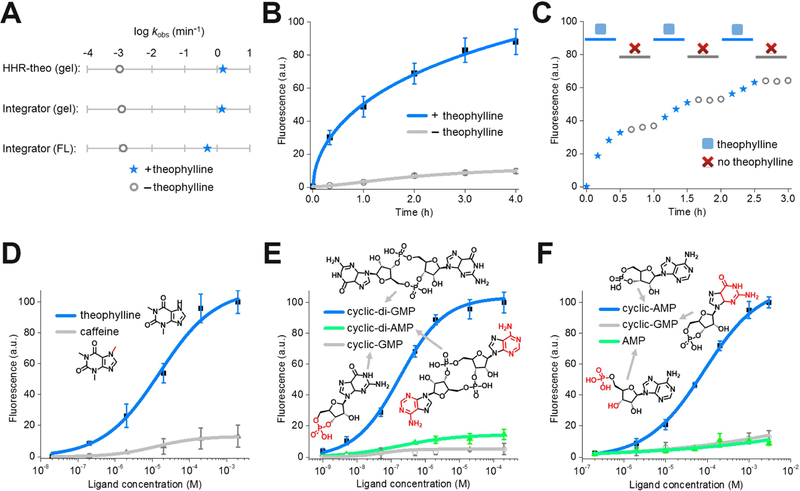
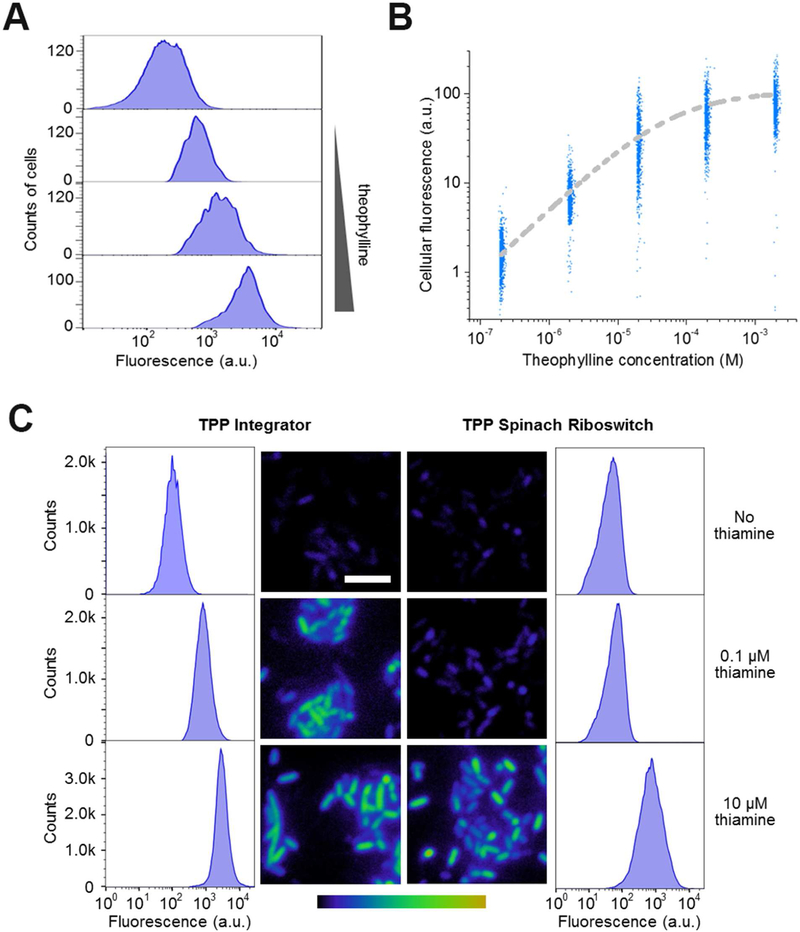
Genetically encoded biosensors are useful tools for detecting the presence and levels of diverse biomolecules in living cells. However, low-abundance targets are difficult to detect because they are often unable to bind and activate enough biosensors to detect using standard microscopic imaging approaches. Here we describe a type of RNA-based biosensor, an RNA integrator, which enables detection of low-abundance targets in vitro and in living cells. The RNA integrator is an RNA sequence comprising a ribozyme and an unfolded form of the fluorogenic aptamer Broccoli. Upon binding its target, the ribozyme undergoes cleavage and releases Broccoli, which subsequently folds and becomes fluorescent. Importantly, each target molecule can bind and induce cleavage of multiple copies of the integrator sensor, resulting in an amplified signal. We show that this approach can be generalized to numerous different ribozyme types for the detection of various small molecules.

Keywords: RNA probes; cellular imaging; fluorescence; fluorogenic aptamer; low-abundance metabolite; ribozyme.


Conflict of interest statement

DECLARATION OF INTERESTS

S.R.J. is a co-founder of Lucerna Technologies and has equity in this company. Lucerna has licensed commercialization of technology related to Spinach and other RNA–fluorophore complexes.

Figures

Figure 1.
Figure 1.. Secondary structure and design of RNA integrators.
(A) Schematic of RNA integrators based on the minimal catalytic domain of hammerhead ribozyme (HHR). Shown are the sequences from the Inhibitor 3 complex. (B) Secondary structure and design of RNA integrators that function in low magnesium levels. The Inhibitor 3 complex (sequences shown) was incorporated as the reporter.
Figure 2.
Figure 2.. Optimization of the RNA integrator performance.
(A) Optimization of inhibitor sequences. In each case, the A’ inhibitor strand (yellow) forms a duplex with the A strand region (green) in Broccoli. After the target-induced cleavage of HHR, the A strands can instead form duplexes with an A” sequence (grey), which is a component of Broccoli stem required for the fluorescence activation. Shown are mean and SEM values of three independent replicates. The predicted Gibbs free energy change (ΔG) during hybridization switch between the A-A’ duplex and A-A’’ duplex was calculated using mfold online software (Zuker, 2003). (B and C) Optimization of (B) cyclic di-guanylate-targeting and (c) cyclic adenosine monophosphate-targeting RNA integrators. Sequences of Inhibitor 1 – 5 are indicated in Figure 2A. Shown are mean and SEM values of three independent replicates.
Figure 3.
Figure 3.. Generation of RNA integrators with diverse natural cis-acting ribozymes.
(A – E) Secondary structure and design of the optimal (A) twister ribozyme integrator, (B) pistol ribozyme integrator, (C) Varkud satellite ribozyme integrator, (D) twister sister ribozyme integrator, and (E) hairpin ribozyme integrator. The integrator is generated by swapping Broccoli-inhibitor A-A’-A’’ complex (green-yellow-grey) into one domain of the ribozyme. Shown are the sequences from the Inhibitor 3 complex. In experiments to test the performance of theophylline-regulated integrator, a theophylline-binding aptamer module (dotted blue) was inserted into the corresponding domain of the ribozyme. (F) Performance of optimal RNA integrators using each of the six ribozymes. Shown are mean and SEM values of three independent replicates. The fluorescence signal was normalized to that of Broccoli.
Figure 4.
Figure 4.. In vitro characterization of the HHR-based RNA integrator.
(A) The apparent cleavage rate constant and fluorescence activation rate constant of theophylline-regulated RNA integrator. The apparent cleavage rate constant was measured in a 6% TBE-urea gel using either RNA integrator or previously reported allosteric theophylline-regulated HHR structure (HHR-theo) (Soukup et al., 2000). Shown are the measured rate constants after adding either 0 μM (open grey circle) or 200 μM theophylline (blue star). (B) Measurement of the rate of RNA integrator activation. As can be seen, addition of 200 μM theophylline led to rapid signal acquisition (blue), with more than half of the total fluorescence signal appearing in ~55 min. Shown are mean and SEM values of three independent replicates. (C) Fluorescence accumulation of the RNA integrator during repeated addition-and-removal of the target. A rapid signal increase was observed during the 30 min incubation with 200 μM theophylline (blue star). A gel filtration spin column was then used to remove the theophylline (open grey circle). After 30 min, 200 μM fresh theophylline was added again (blue star). This cycle was repeated three times. (D – F) Dose-response curve for fluorescence activation of the (D) theophylline, (E) cyclic di-guanylate, and (F) cAMP RNA integrator by target or analogs. Shown are mean and SEM values of three independent replicates. Chemical structures of analogs are drawn with differences from the target indicated in red.
Figure 5.
Figure 5.. Metabolite detection in living cells using the RNA integrator.
(A) Theophylline-induced fluorescence activation in E. coli. Cells expressing the theophylline integrator were incubated with 0, 2, 20, or 200 μM theophylline (up to bottom) for 3 h and then fluorescence signal from 5,000 individual cells was quantified in each case by flow cytometry. (B) Dose-response curve for cellular fluorescence activation of the theophylline integrator. At each concentration, shown are the individual fluorescence values of 1,000 representative cells as measured by flow cytometry after 3 h incubation with theophylline. (C) Sensitivity of the RNA integrator for the cellular imaging of TPP biosynthesis. We used a previously reported Spinach riboswitch (You et al., 2015) as the control. In this experiment, after culturing in thiamine-free media for 2 h, we added 0, 0.1 μM, or 10 μM thiamine and imaged the cellular fluorescence level after another 3 h incubation. Images are pseudocolored to show the fold increase in fluorescence at each time point relative to 0 min without adding thiamine. Color scale represents 0- to 15.0-fold changes (black to yellow) in fluorescence signal. Scale bar, 5 μm. In addition, flow cytometry was used to quantify the fluorescence of 100,000 individual cells in these cases.

Comment in

  • Adding Broccoli to the Biosensor Menu.
    Costales MG, Disney MD. Costales MG, et al. Cell Chem Biol. 2019 Apr 18;26(4):463-465. doi: 10.1016/j.chembiol.2019.04.004. Cell Chem Biol. 2019. PMID: 31002799

References

    1. Beilstein K, Wittmann A, Grez M, and Suess B (2015). Conditional control of mammalian gene expression by tetracycline-dependent hammerhead ribozymes. ACS Synth. Biol 4, 526–534. - PubMed
    1. Birikh KR, Heaton PA, and Eckstein F (1997). The structure, function and application of the hammerhead ribozyme. Eur. J. Biochem 245, 1–16. - PubMed
    1. Borujeni AE, Mishler DM, Wang J, Huso W, and Salis HM (2016). Automated physics-based design of synthetic riboswitches from diverse RNA aptamers. Nucleic Acids Res 44, 1–13. - PMC - PubMed
    1. Breaker RR (2002). Engineered allosteric ribozymes as a biosensor components. Curr. Opin. Biotechnol 13, 31–39. - PubMed
    1. Breaker RR, Emilsson GM, Lazarev D, Nakamura S, Puskarz IJ, Roth A, and Sudarsan N (2003). A common speed limit for RNA-cleaving ribozymes and deoxyribozymes. RNA 9, 949–957. - PMC - PubMed

Publication types

LinkOut - more resources