. 2019 Mar 25;48(6):765-779.e7.
doi: 10.1016/j.devcel.2019.01.017. Epub 2019 Feb 14.

YAP Partially Reprograms Chromatin Accessibility to Directly Induce Adult Cardiogenesis In Vivo

Affiliations

YAP Partially Reprograms Chromatin Accessibility to Directly Induce Adult Cardiogenesis In Vivo

Tanner O Monroe et al. Dev Cell. .

Abstract

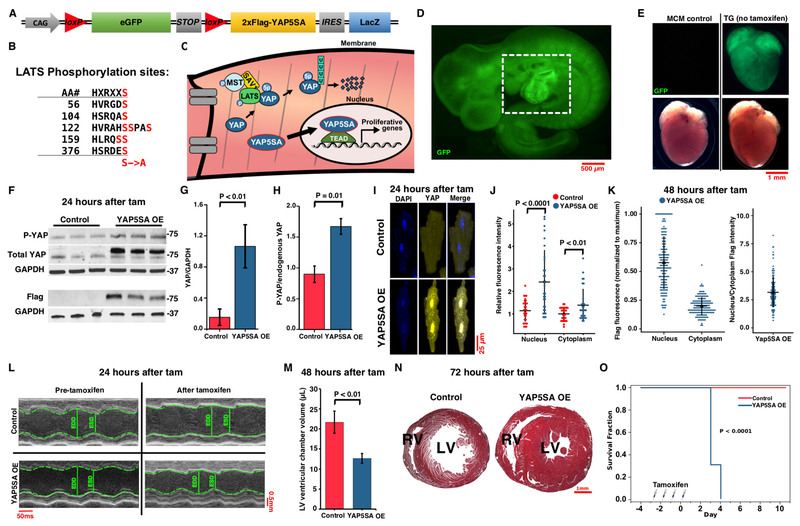
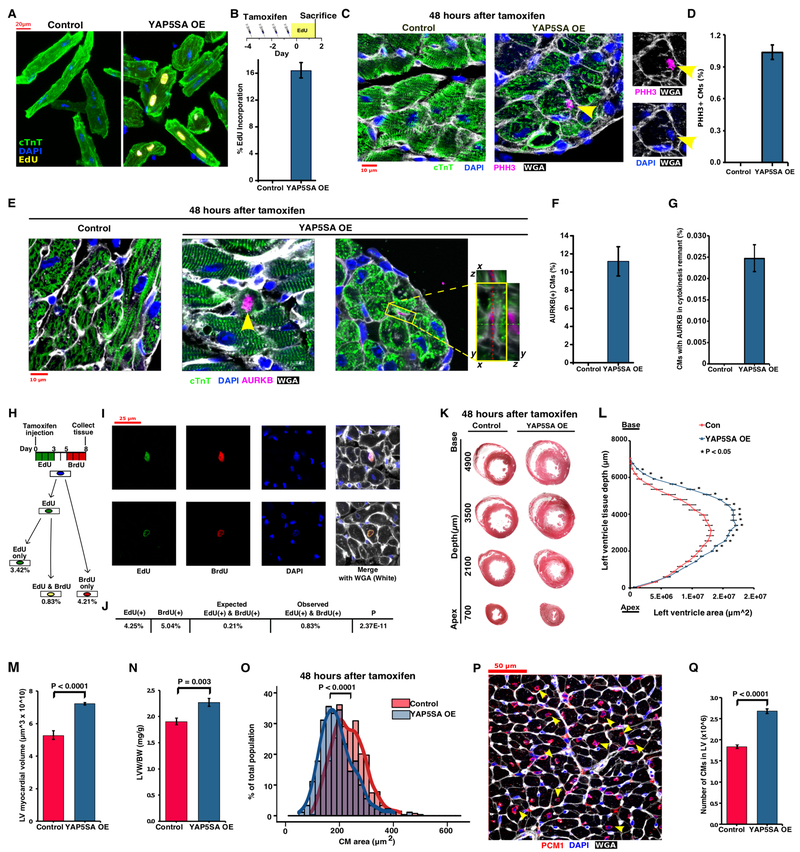
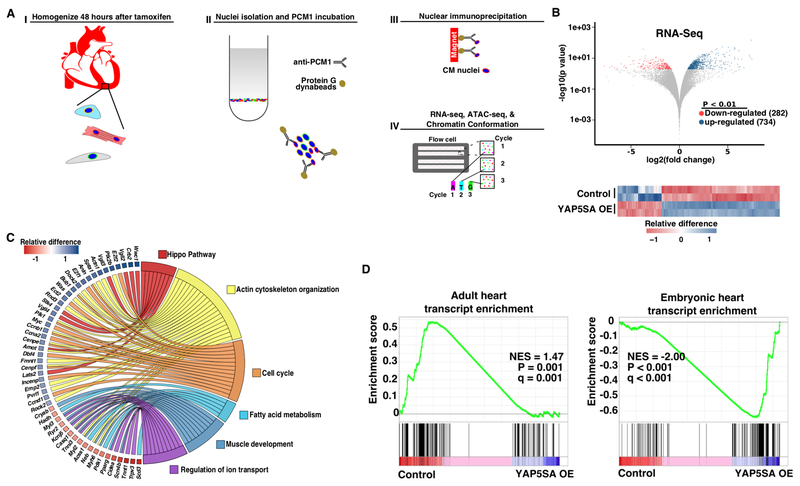
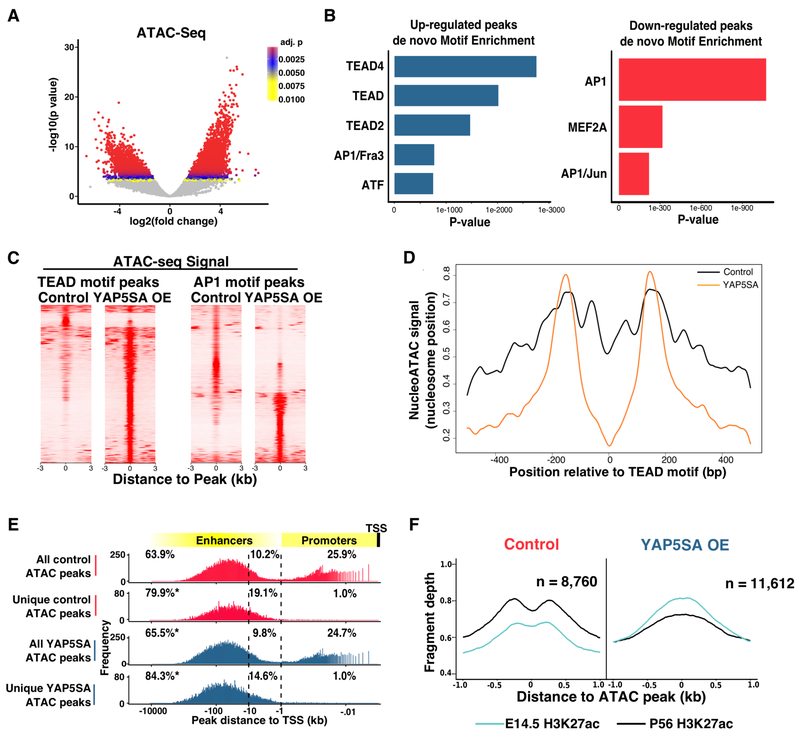
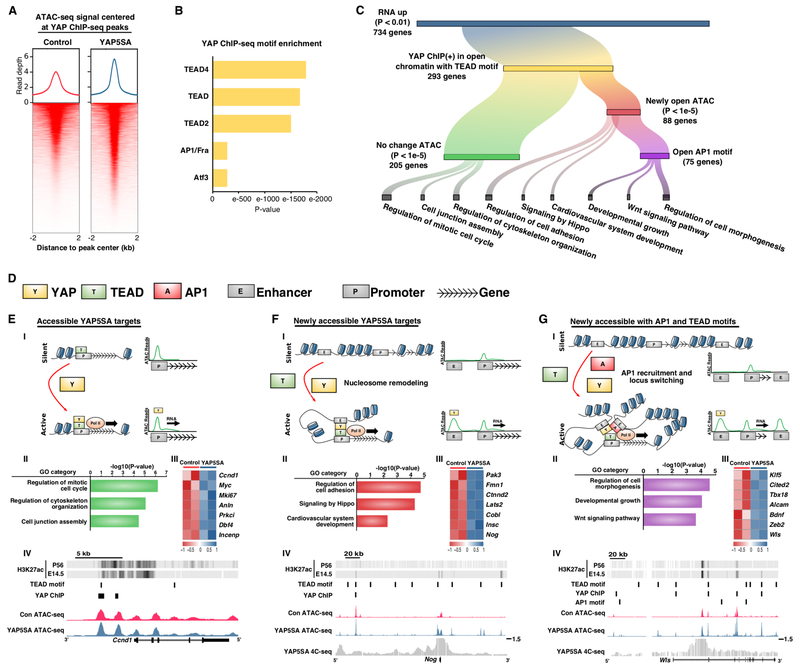
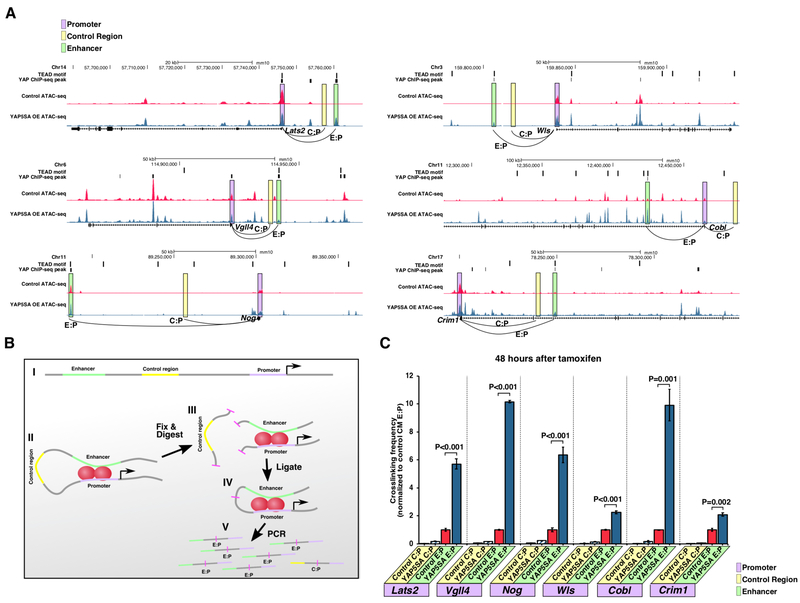
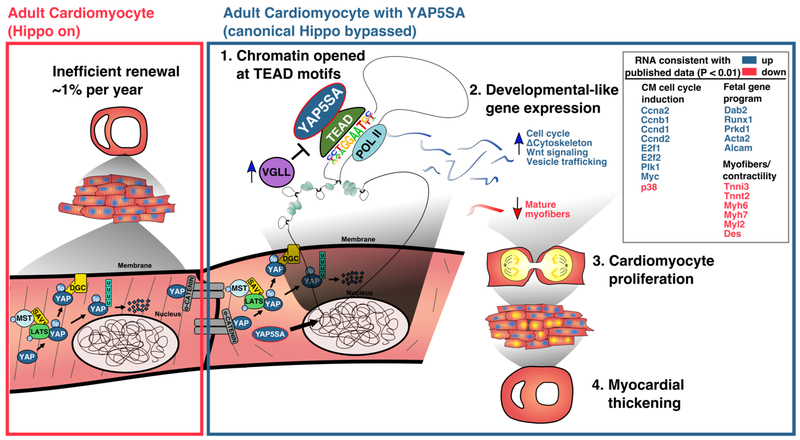
Specialized adult somatic cells, such as cardiomyocytes (CMs), are highly differentiated with poor renewal capacity, an integral reason underlying organ failure in disease and aging. Among the least renewable cells in the human body, CMs renew approximately 1% annually. Consistent with poor CM turnover, heart failure is the leading cause of death. Here, we show that an active version of the Hippo pathway effector YAP, termed YAP5SA, partially reprograms adult mouse CMs to a more fetal and proliferative state. One week after induction, 19% of CMs that enter S-phase do so twice, CM number increases by 40%, and YAP5SA lineage CMs couple to pre-existing CMs. Genomic studies showed that YAP5SA increases chromatin accessibility and expression of fetal genes, partially reprogramming long-lived somatic cells in vivo to a primitive, fetal-like, and proliferative state.

Keywords: Hippo pathway; Yap; cardiomyocyte proliferation; chromatin accessibility; heart development; heart failure; regeneration; reprogramming; transcription.


Figures

Figure 1.
Figure 1.. Design and expression of YAP5SA transgene.
(A) YAP5SA transgene (TG). (B) Serine phosphorylation sites mutated in YAP5SA (STAR methods). (C) Model of Hippo signaling in adult CMs. (D) E9.5 YAP5SA with GFP expression. (E) GFP fluorescence in MCM and TG hearts at P0. (F) Western blot: Flag-YAP5SA and phosphorylation of endogenous YAP 24 hrs after fourth tam. Controls: MCM mice with tam. (G, H) Western blot quantification. Total YAP & Flag n=3 mice/genotype. P-YAP (mouse S112) control n=4, YAP5SA n=3. (I) IF of control and YAP5SA OE CMs 24 hrs after fourth tam. (J) Quantification of nuclear and cytoplasmic YAP IF in CMs from control or YAP5SA OE, shown as dot plots with mean +/− SDM, relative to mean control cytoplasmic intensity. Control n=3 hearts, 30 CMs. YAP5SA OE n=3 hearts, 30 CMs. Control: MCM with tam. (K) Quantification of Flag IF in YAP5SA OE CMs, shown as dot plots with mean +/− SDM. n=3 hearts, 50 CMs each, 48 hrs after tam. (L) M-mode ECHO before and 24 hrs after tam. Control: MCM mice with tam. (M) LV chamber volume control and YAP5SA OE 48 hrs after tam. n=6/group. Control: MCM mice with tam. (N) Histology 72 hrs after tam. Control: MCM with tam. (O) Kaplan Meier survival analysis control (n=11) and YAP5SA OE (n=13). Statistics: Mantel-Cox test. Control: MCM with tam. G,H,J,M groups compared by ANOVA with Bonferroni post-hoc tests. G,H,M shown as Mean +/− SEM. See also Fig. S1 and S2.
Figure 2.
Figure 2.. Proliferation of adult cardiomyocytes.
(A) EdU-stained CMs. (B) tam & EdU labeling strategy; Quantification of EdU incorporation (n=4 hearts/group, 200-300 CMs/heart). (C) pHH3 IF Control: MCM with tam. Positive CM indicated (yellow arrow) separate channels on right (D) pHH3 quantification in CMs. YAP5SA n=5; Controls n=9; 3 MCM with & 3 no tam, and 3 YAP5SA MCM mice no tam. 300-400 CMs/heart, 48 hrs after fourth tam injection. (E) AURKB IF: Positive CMs indicated (yellow arrows) or inset with z-projection. Control: MCM with tam. (F) Quantification of AURKB(+) CM nuclei (n=3 YAP5SA; Control n=9 mice; 3 MCM with & 3 no tam, and 3 YAP5SA MCM mice no tam. 200-300 CMs/heart, 48 hrs after fourth tam). (G) Quantification of AURKB in cytokinesis remnant (YAP5SA n=3; Control n=9, 3 MCM with & 3 no tam, and 3 YAP5SA MCM no tam. 48 hrs after fourth tam ~30mm2 imaged each with ~900 CMs/mm3). (H) EdU & BrdU labeling protocol and % of labeled CMs from low dose protocol. (I) EdU(+) and BrdU(+) CMs with WGA. (J) Chi-squared table of labeled CMs. (K) Sections of LV at indicated depth (L) Area of LV at indicated depth * P<0.05 significance (M) Total LV tissue volume (N) Ratio of LV weight/body weight (K-N n=6 YAP5SA; Controls n=12, 3 YAP5SA MCM no tam, 3 MCM no tam, 6 MCM with tam), 48 hrs after fourth tam (O) Histograms of areas of isolated CMs from control and YAP5SA. YAP5SA n=6; Controls n=9, 3 YAP5SA MCM no tam, 3 MCM no tam, 3 MCM with tam; ~100 cells/heart, 48 hrs after fourth tam. (P) CMs labeled with PCM-1 (Yellow arrows). (Q) CM number in LV (YAP5SA n=5; Control n=11, 5 MCM with tam, 3 YAP5SA no tam, 3 MCM no tam), 48 hrs after fourth tam. L-O,Q groups compared by ANOVA with post-hoc Bonferroni tests; and tam protocol from 2B. Data in B,D,F,G,L,M,N,Q shown as mean +/−SEM. See also Fig. S1.
Figure 3.
Figure 3.. YAP5SA cardiomyocytes express a primitive genetic profile.
(A) Protocol for CM-enriched nuclear RNA and ATAC-seq. Control: MCM with tam. 48 hrs after tam. (B) (Top) Volcano plot of YAP5SA RNA-seq adjusted P-value<0.01, 734 genes up-regulated; 282 down-regulated. Two samples/genotype. (Bottom) Heat map differentially regulated genes. (C) Circle plot of select genes indicated ontologies. Gene expression relative difference (log2 fold change). (D) Gene set enrichment analysis of top 200 most differentially regulated genes: adult hearts relative to embryonic (left) or embryonic relative to adult (right) against RNA-seq dataset (normalized enrichment score, NES, relative to control. Data from (Uosaki et al.,2015). See Fig. S2,S3 and S4.
Figure 4.
Figure 4.. YAP5SA opens chromatin at TEAD and AP-1 elements
(A) Volcano plot of YAP5SA ATAC-seq. YAP5SA OE CMs: 11,612 peaks up-regulated and 8,760 down-regulated at P<0.035 log2 fold change. Two samples/genotype. (B) (Left) Enriched motifs in ATAC-seq peaks from YAP5SA OE CMs. (Right) Enriched motifs in ATAC-seq peaks from control CMs (adjusted P<0.035). (C) ATAC-seq signal at all peaks containing TEAD (left) or AP-1 (right) motifs. (D) Nucleosome signal for all TEAD motif peaks, normalized between 0 and 1. (E) Distance to TSS of ATAC-seq peaks. * P≤0.001 relative to control ATAC proportions. (Chisquared test with Yates correction). (F) H3K27Ac fragment coverage from E14.5 and P56 hearts centered around top ATAC-seq peaks (adjusted P≤0.035). N: number of interrogated ATAC-seq peaks. See also Fig. S3 and S4.
Figure 5.
Figure 5.. Identification of YAP targets and YAP5SA mechanism
(A) Heat map of ATAC-seq reads centered at YAP ChIP-seq peaks. (B) Enriched transcription factor motifs in YAP ChIP-seq peaks (GSM2220157) (C) YAP5SA target genes and gene ontologies from integrated genomics (RNA-seq up P<0.01; YAP ChIP-seq peak in open chromatin [normalized read count < 2 over the peak] & containing a TEAD motif; ATAC-seq up [P < 1e−5]). (D) Model key (E) I. Model of YAP5SA activation by binding to promoters of already accessible genes: RNA up, ATAC no change, open TEAD motifs. II. Gene ontology of 205 genes fitting this criteria; and III. Heat map of selected genes. IV. Sequencing track. (F) I. Model of YAP5SA activation of genes through chromatin remodeling: RNA up, ATAC up, newly open TEAD motifs. II. Gene ontology of 88 genes fitting this criteria; and III. Heat map of selected genes. IV. Sequencing track. (G) I. Model of YAP5SA Activation of genes with AP-1-asociated open chromatin: RNA up, ATAC up, open, newly open TEAD motifs & AP-1 motifs. II. Gene ontology of 75 genes fitting this criteria; and III. Heat map of selected genes. IV. Sequencing track. AIV, BIV, and CIV are density plots indicating reads from H3K27ac ChIP-seq data from adult and embryonic hearts and our 4C data. TEAD motifs and AP-1 motifs indicated. 5’ and 3’ are shown relative to top strand of DNA. For E-G See Table S1. full gene lists. ATAC-seq tracks scaled to YAP5SA OE maximum. Black notch scale on the 4C-seq tracks indicates 4C coverage/1e3 reads.
Figure 6.
Figure 6.. YAP5SA increases enhancer-promoter contacts
(A) Gene tracks with enhancers (green). Control regions closer to promoter than enhancer used for 3C (yellow). Promoters (purple). C:P, Control to Promoter contact. E:P, Enhancer to Promoter contact. (B) Cartoon of difference between 2D and 3D enhancer-promoter proximity. (I) 2D proximity. (II) 3D proximity (III) fixing DNA/chromatin interactions and digesting DNA. Loci not in contact diffuse away. (IV) Ligation of loci in contact. (V) qPCR of ligated loci. E:P interactions are more common than C:P, reflecting contact frequency (C) Quantification of chromatin contact in CM nuclei by 3C at genomic loci indicated in Fig. 7A, normalized to Control CM enhancer-promoter contacts. Groups compared: ANOVA with post-hoc Bonferroni tests. Data shown mean +/− SEM. n=3 replicates/group (from pooled CM nuclei from 6 Control hearts or 6 YAP5SA OE hearts, STAR methods). Controls: both YAP5SA no tam and tam-injected MCM control. See Table S2 for primers.
Figure 7.
Figure 7.. Model.
Adult CMs have high Hippo activity. YAP5SA bypasses canonical Hippo inhibition: (1) chromatin remodeling centered around TEAD motifs. (2) gene expression resembling fetal CMs – expression of cell-cycle genes and reduced expression of cytoskeletal and contractile genes. Previously published observations indicated. (3) CM proliferation. (4) Thickening of myocardium. Vestigial-like genes are up-regulated and antagonize YAP-dependent de-differentiation.

Comment in

References

    1. Ahuja P, Perriard E, Perriard JC, and Ehler E (2004). Sequential myofibrillar breakdown accompanies mitotic division of mammalian cardiomyocytes. Journal of cell science 117, 3295–3306. - PubMed
    1. Alkass K, Panula J, Westman M, Wu TD, Guerquin-Kern JL, and Bergmann O (2015). No Evidence for Cardiomyocyte Number Expansion in Preadolescent Mice. Cell 163, 1026–1036. - PubMed
    1. Bergmann O, Zdunek S, Felker A, Salehpour M, Alkass K, Bernard S, Sjostrom SL, Szewczykowska M, Jackowska T, Dos Remedios C, et al. (2015). Dynamics of Cell Generation and Turnover in the Human Heart. Cell 161, 1566–1575. - PubMed
    1. Bersell K, Arab S, Haring B, and Kuhn B (2009). Neuregulin1/ErbB4 signaling induces cardiomyocyte proliferation and repair of heart injury. Cell 138, 257–270. - PubMed
    1. Bersell K, Choudhury S, Mollova M, Polizzotti BD, Ganapathy B, Walsh S, Wadugu B, Arab S, and Kuhn B (2013). Moderate and high amounts of tamoxifen in alphaMHC-MerCreMer mice induce a DNA damage response, leading to heart failure and death. Disease models & mechanisms 6, 1459–1469. - PMC - PubMed

Publication types

MeSH terms