

doi: 10.2138/rmg.2016.81.03.
Epub 2016 Jan 1.
Nucleosynthetic Isotope Variations of Siderophile and Chalcophile Elements in the Solar System
Affiliations
- PMID: 30774562
- PMCID: PMC6376206
- DOI: 10.2138/rmg.2016.81.03
Item in Clipboard
Nucleosynthetic Isotope Variations of Siderophile and Chalcophile Elements in the Solar System
Rev Mineral Geochem.
2016.
No abstract available
Figures
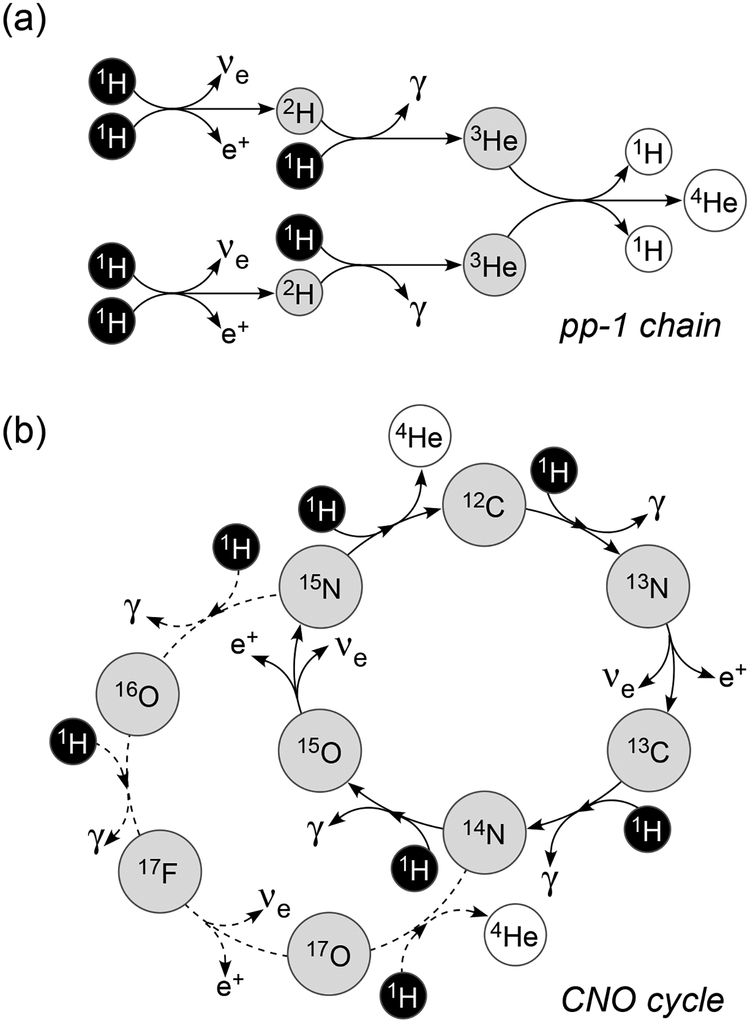
Schematic view of hydrogen burning. (a) pp-1 chain and (b) CNO cycle.
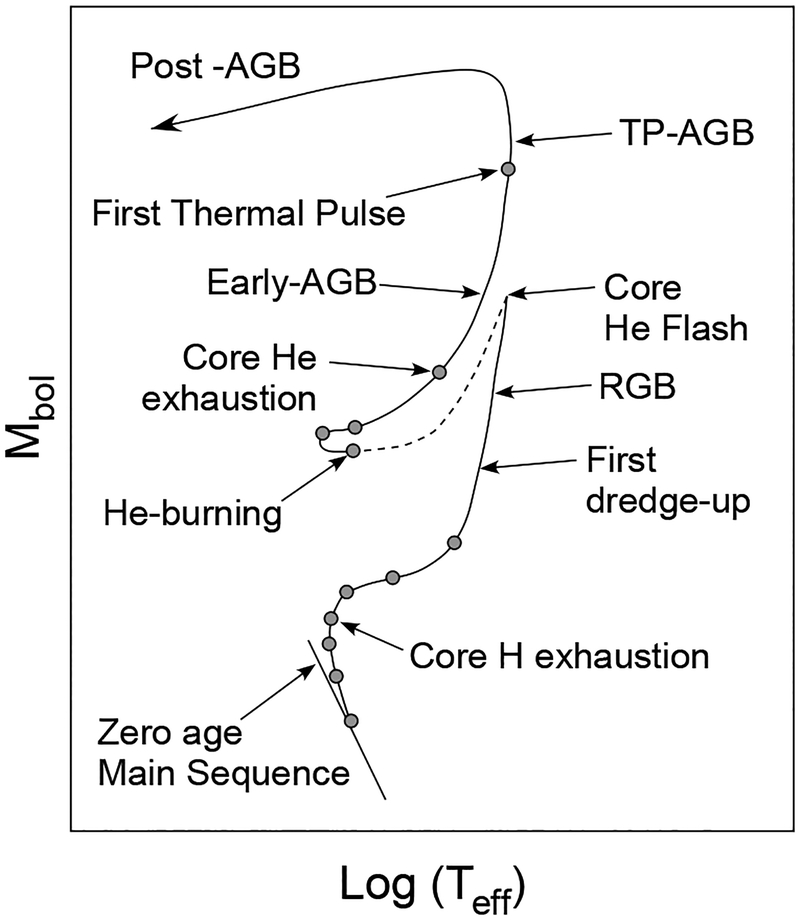
Schematic evolution of a 1 M☉ star with solar metallicity in the H-R diagram. Figure modified from Busso et al. (1999).
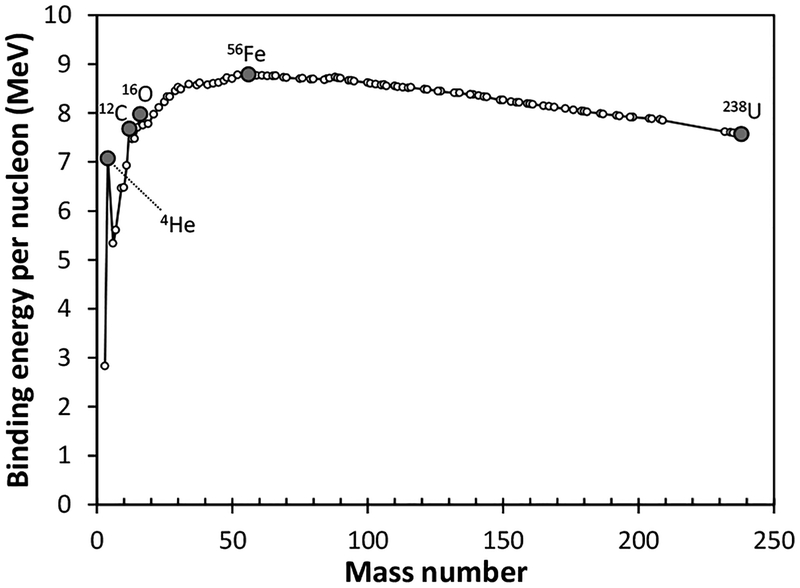
Binding energy per nucleon (experimental values). Data source: Ghahramany et al. (2012).
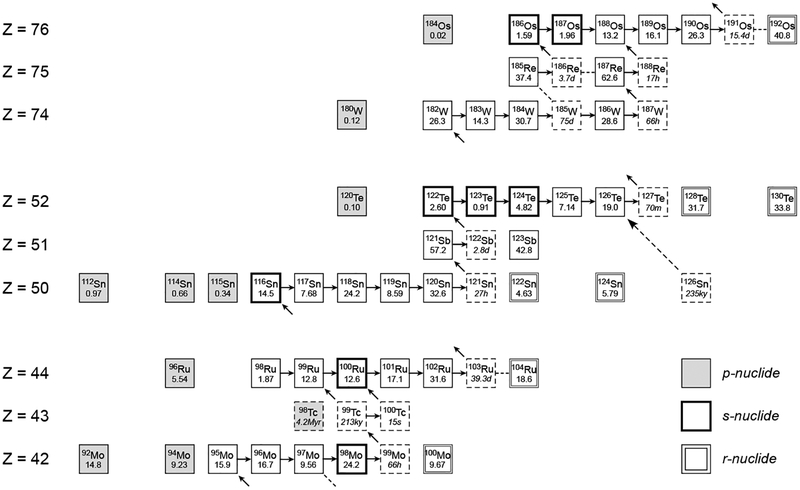
s-process pathways around Mo–Tc–Ru, Sn–Sb–Te, and W–Re–Os. Filled, bold, and double boxes are nuclides produced dominantly by the p-, s-, and r-processes. Dashed boxes are radioactive nuclides with their half-lives. Numbers in boxes are terrestrial abundances. Broken lines indicate minor path which may occur in specific conditions.
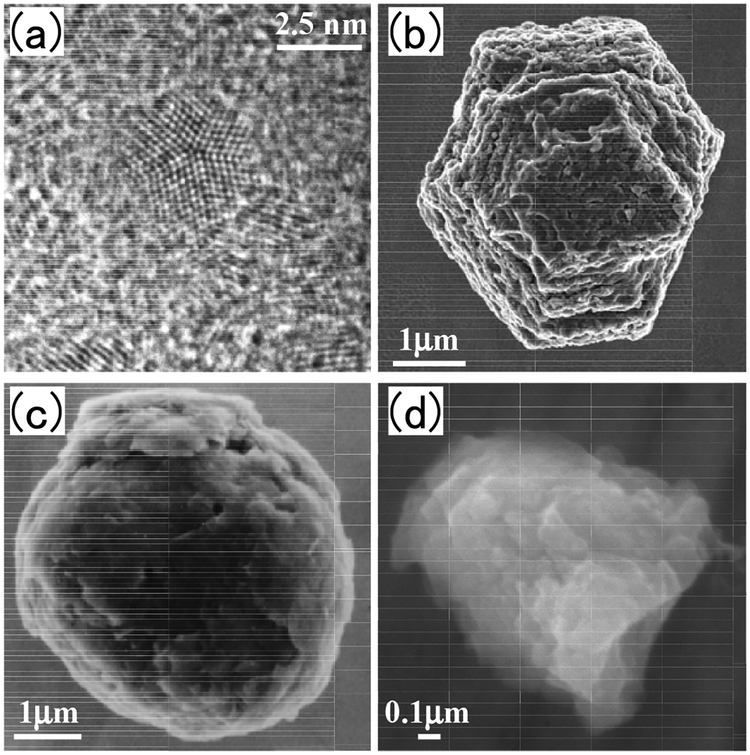
Images of presolar grains. (a) nanodiamond (b) SiC (c) graphite, and (d) corundum. Used by the following permission. (a) Tyrone L. Daulton, Washington University in St. Louis (b) Scott Messenger, NASA (c) Sachiko Amari, Washington University in St. Louis (d) Aki Takigawa, Kyoto University.
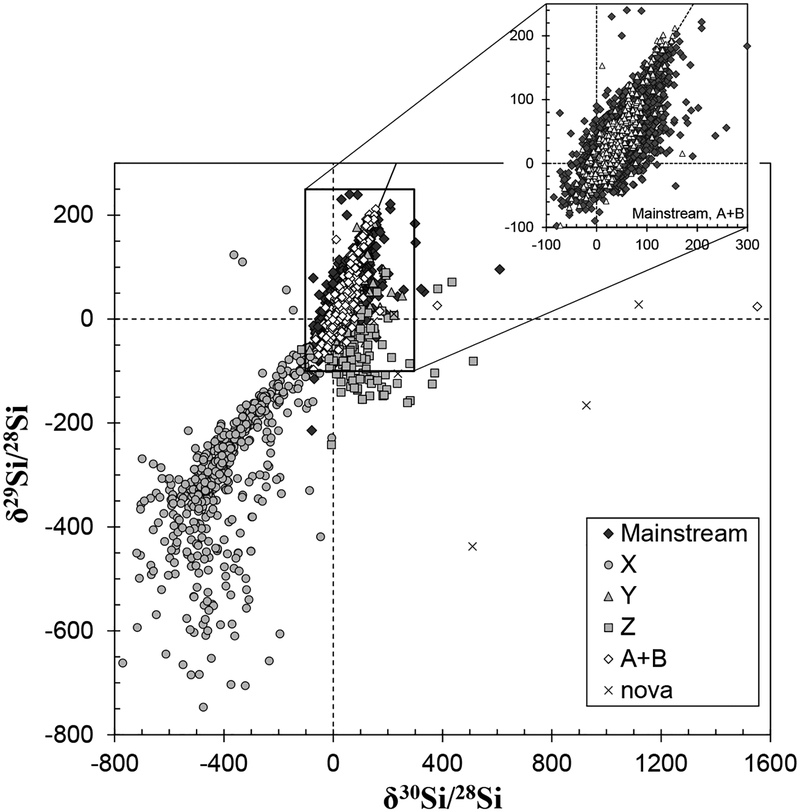
Silicon isotopic compositions of presolar silicon carbide grains. The presolar grain database by Hynes and Gyngard (2009) was used to plot the data. The original sources of representative data are Alexander (1993), Alexander and Nittler (1999), Amari et al. (2001a, 2001b, 2001c), Barzyk et al. (2007), Besmehn and Hoppe (2003), Hoppe et al. (1994, 1996), Huss et al. (1997), Lin et al. (2002), Marhas et al. (2008), Nittler and Alexander (2003), Virag et al. (1992), and Zinner et al. (2003, 2007). The full references for the entire data suite are available in Hynes and Gyngard (2009).
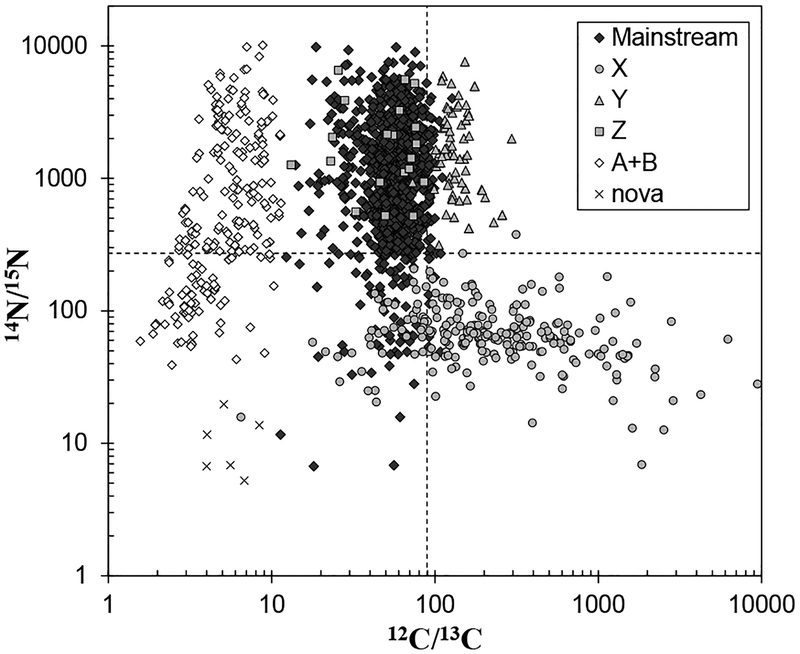
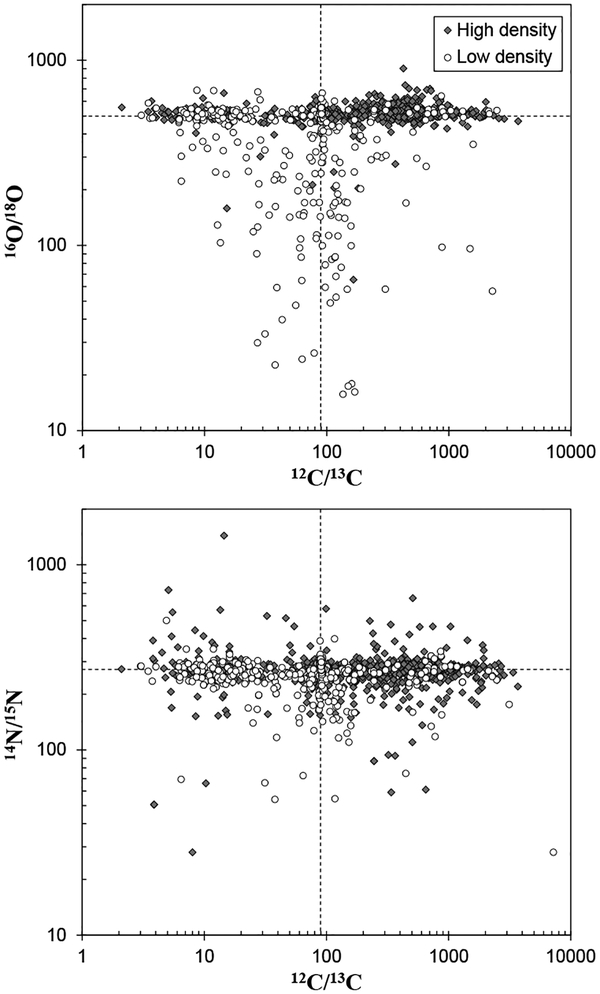
Carbon and nitrogen isotopic compositions of presolar silicon carbide grains. Dashed lines are those of solar system average. Data are from the same sources as for Figure 6.
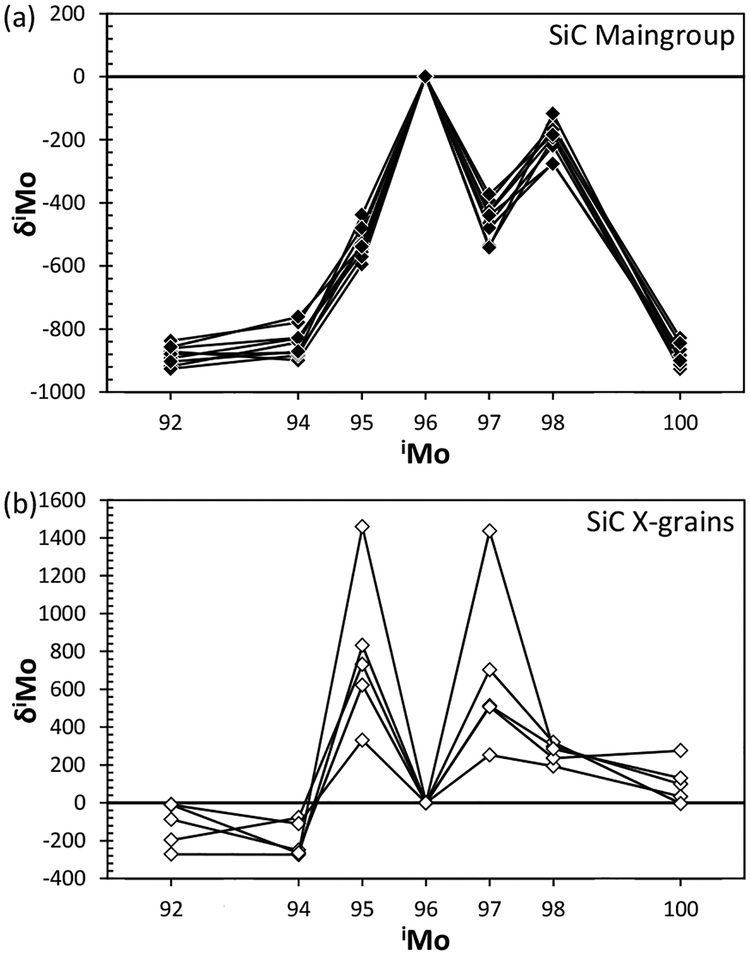
Representative data for Mo isotope compositions in (a) mainstream SiC grains and (b) type X SiC grains. Data are from Barzyk et al. (2007) and Pellin et al. (2006).
Carbon, nitrogen, and oxygen isotopic compositions of presolar graphite grains. Dashed lines are those of solar system average. The presolar grain database by Hynes and Gyngard (2009) was used to plot the data. The original sources of representative data are Amari et al. (1993), Hoppe et al. (1995), and Jadhav et al. (2013). The full references for the entire data are available in Hynes and Gyngard (2009).
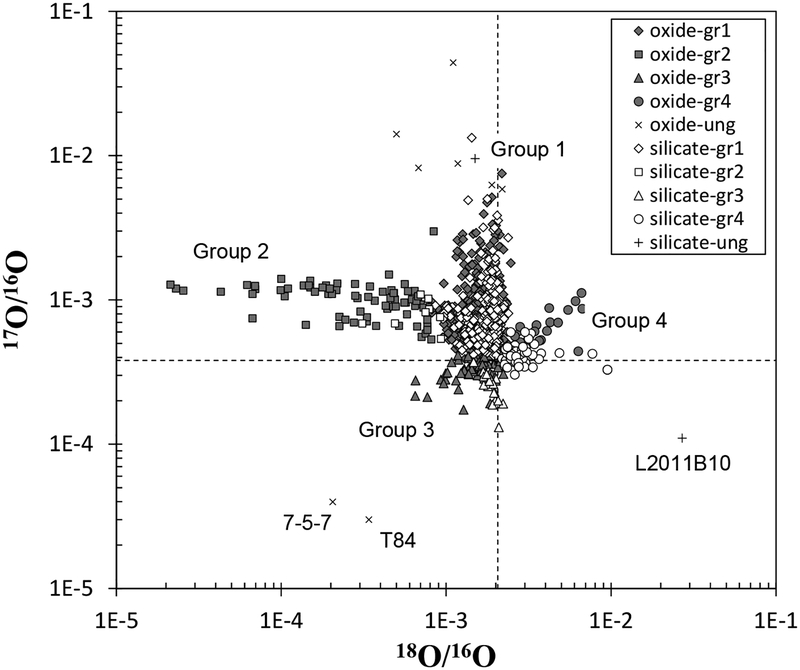
Oxygen isotopic compositions of presolar oxide and silicate grains. Dashed lines are those of solar system average. The presolar grain database by Hynes and Gyngard (2009) was used to plot the data. The original sources of representative data are Bose et al. (2010), Choi et al. (1998, 1999), Floss and Stadermann (2009), Gyngard et al. (2010), Mostefaoui and Hoppe, (2004), Nagashima et al. (2004), Nguyen et al. (2003), Nguyen and Zinner (2004), Nguyen et al. (2007, 2010), Nittler et al. (1997, 2008), Vollmer et al. (2009a, 2009b), and Zinner et al. (2003, 2005). The full references for the entire data are available in Hynes and Gyngard (2009).
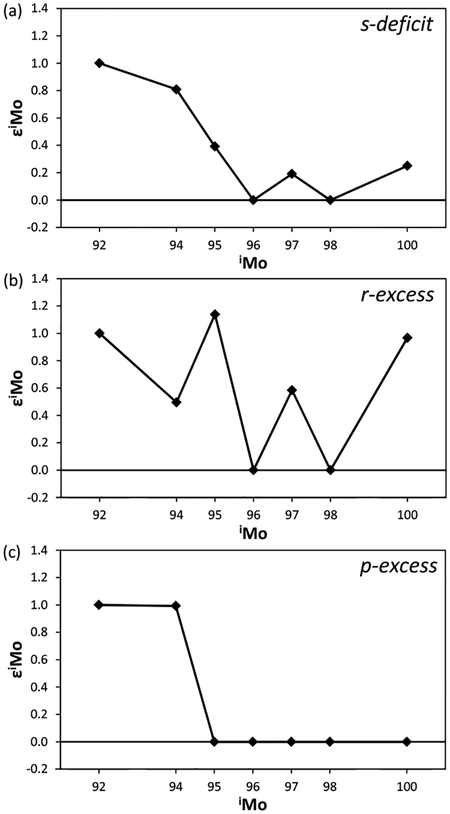
Molybdenum isotope patterns representing (a) s-deficit, (b) r-excess, and (c) p-excess relative to the terrestrial component. The model patterns were calculated by subtracting an s-process endmember component (Arlandini et al. 1999) from the solar system composition and scaled to a mixing ratio of (p + r)/s yielding ε92Mo = 1.
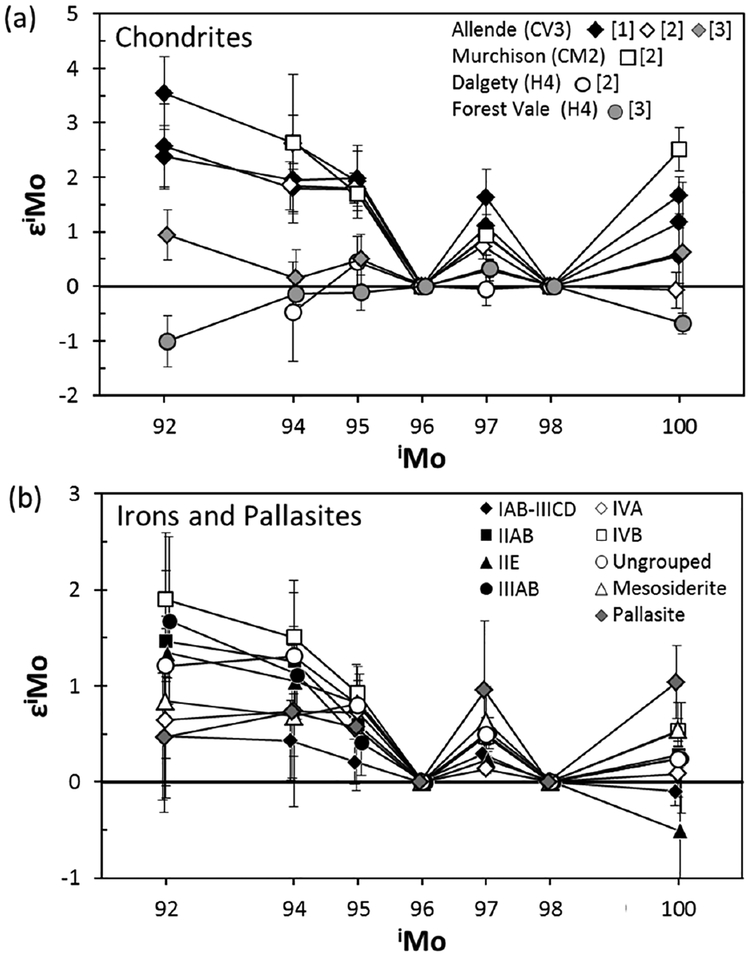
(a) Molybdenum isotope patterns for bulk aliquots of chondrites. Data sources: [1] Dauphas et al. (2002a), [2] Yin et al. (2002), [3] Becker and Walker (2003a). For [1] and [2], error bars are uncertainties of individual measurements estimated by 2 SE (standard error) of multiple lines of data acquisition in a single isotopic measurement. For [3], error bars are 2 SE of multiple data obtained by different isotopic measurements. (b) Mo isotope anomalies for iron meteorites (Dauphas et al. 2002a). Error bars are 2 SE of multiple isotopic measurements.
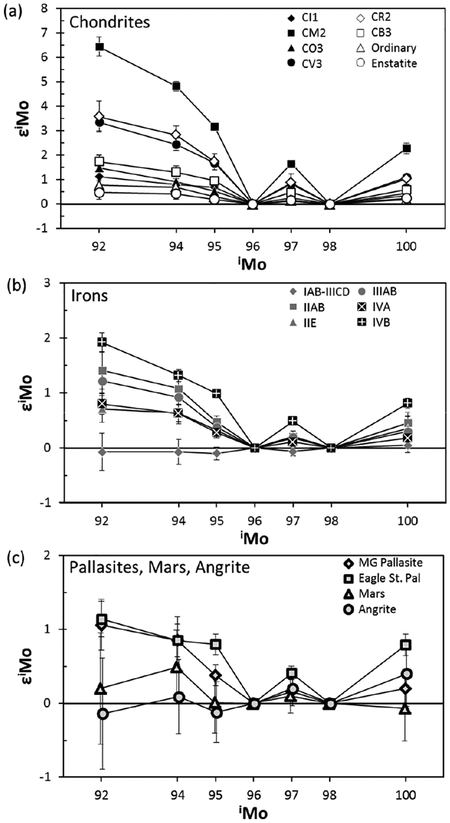
Molybdenum isotope patterns for (a) bulk chondrites, (b) iron meteorites, and (c) pallasites, angrite and Martian meteorite. Data are from Burkhardt et al. (2011). Error bars are 2 SE of multiple data obtained by different isotopic measurements excluding angrite and Martian meteorite for which 2 SD (standard deviation) from repeated analyses of a terrestrial standard is applied.
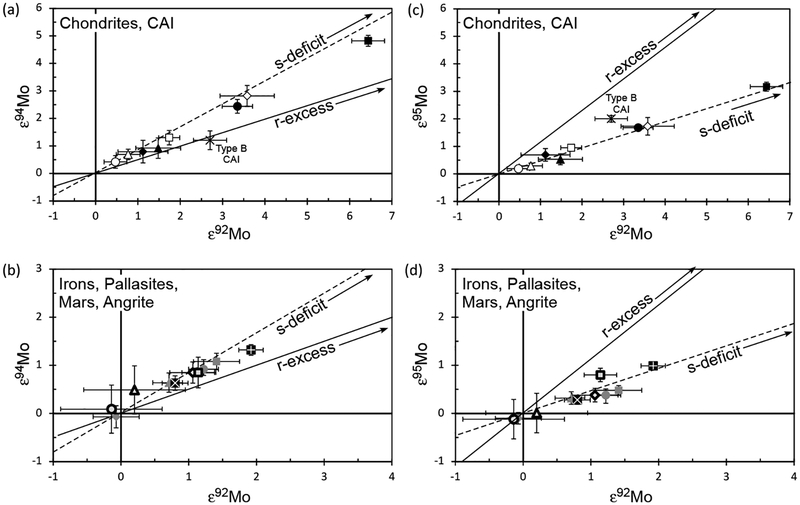
Plots of Mo isotope anomalies in εiMo–ε92Mo space for meteorites and CAI. Data are from Burkhardt et al. (2011). Symbols and errors are the same as Figure 13.
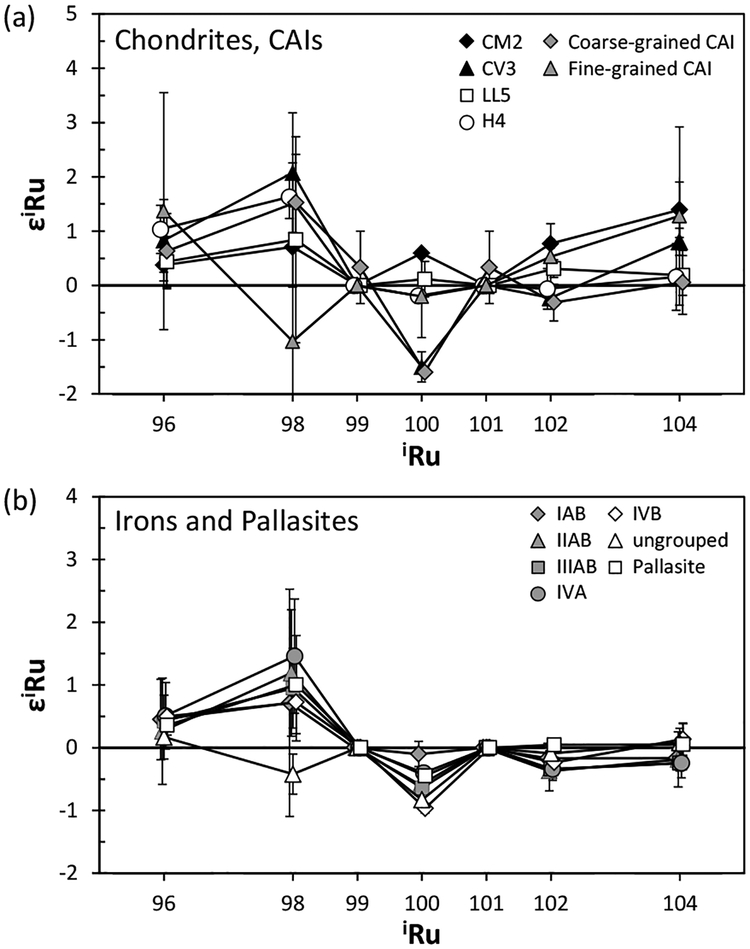
Ruthenium isotope compositions for chondrites, CAIs, and iron meteorites in εRu units. Data are from Chen et al. (2010). Error bars are 2SE of multiple data obtained by different isotopic measurements excluding fine-grained CAI for which internal precision of individual isotopic run is applied.
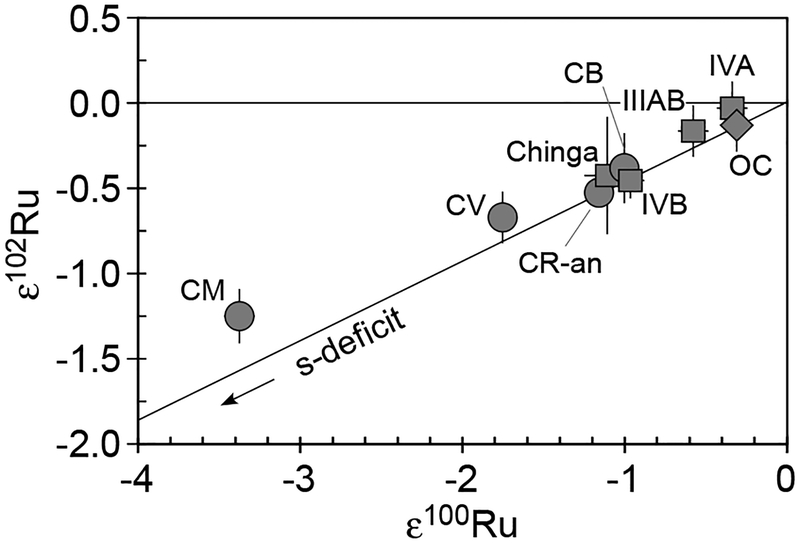
Plot of Ru isotope anomalies for chondrites and iron meteorites in ε102Mo–ε100Ru space. Data are from Fischer-Gödde et al. (2013).
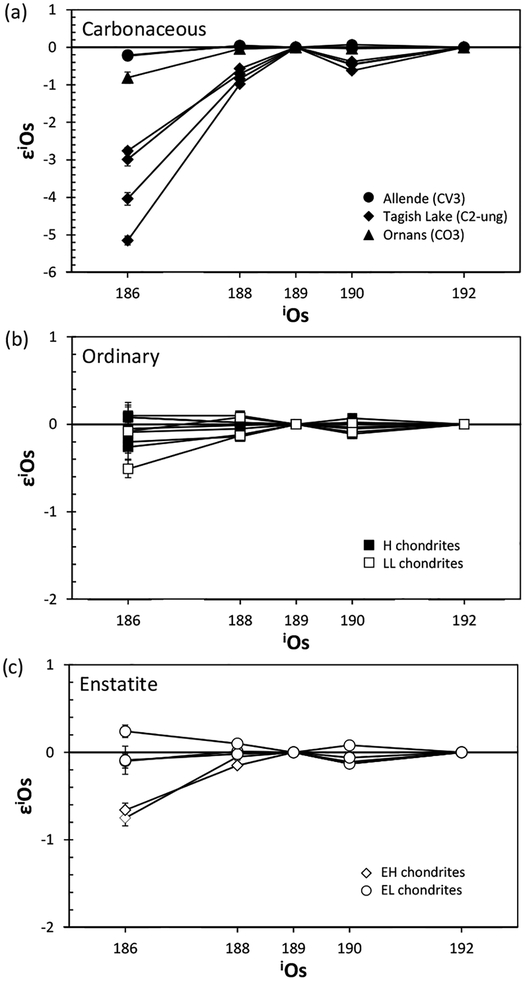
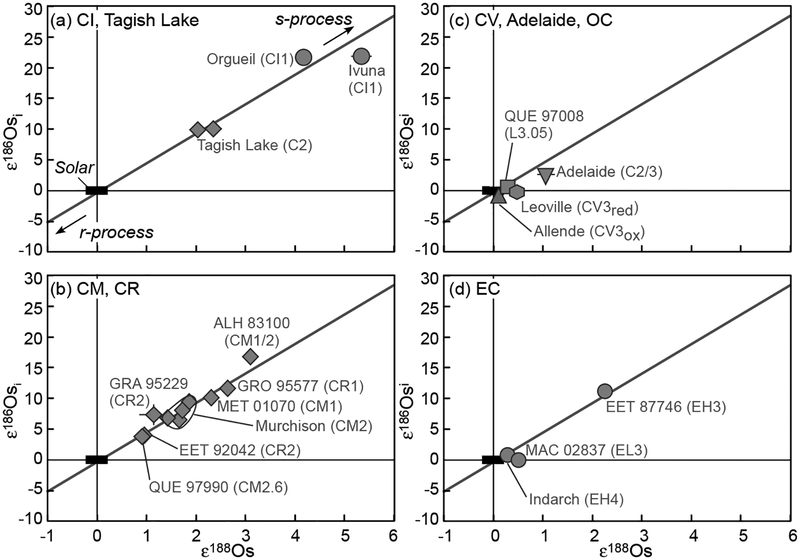
Osmium isotope compositions in (a) carbonaceous, (b) ordinary, and (c) enstatite chondrites. Data are from Brandon et al. (2005). Error bars are 2 SE of individual measurements.
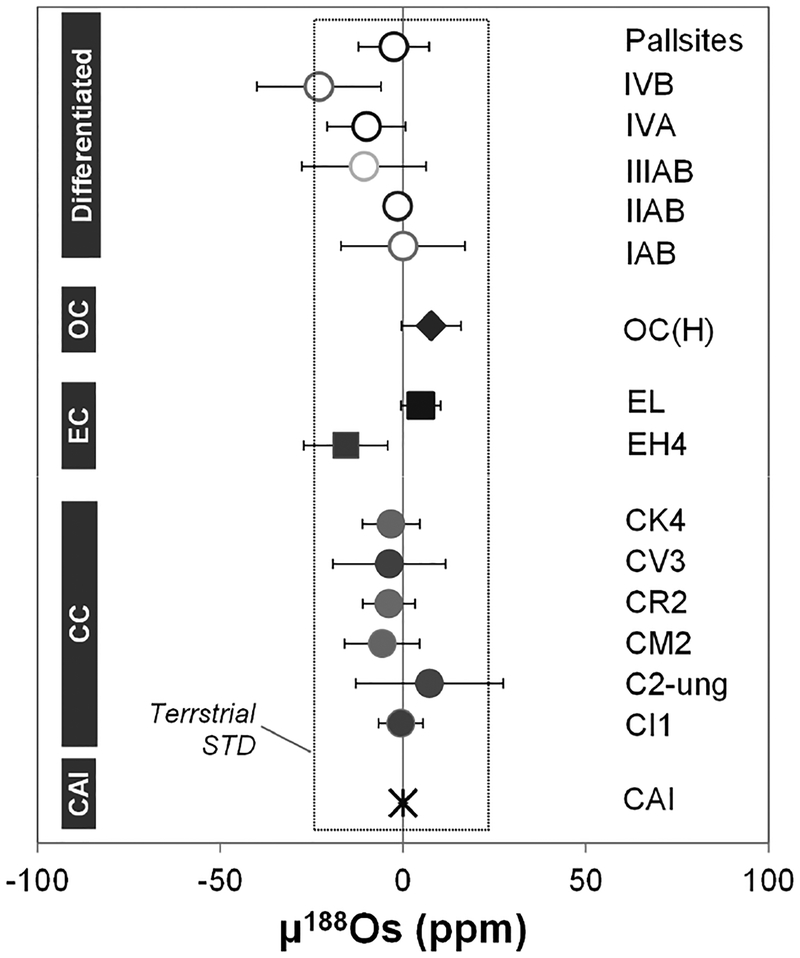
μ188Os values for CAIs, chondrites, iron meteorites, and pallasites. Error bars are 2 SE for samples with multiple analyses or the internal precision of individual isotopic run for samples with single measurement. Data sources: Yokoyama et al. (2007, 2010, 2011) and Walker (2012).
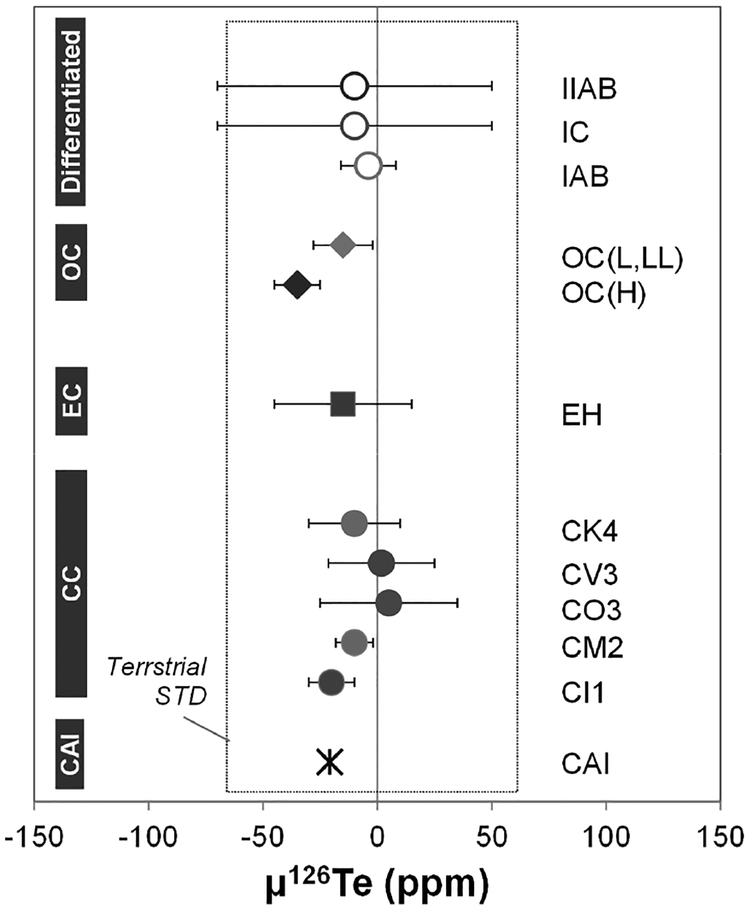
μ126Te values for CAIs, chondrites, and iron meteorites. Error bars are 2 SE for samples with multiple analyses or the external reproducibility (2 SD) of Te standard measurements for samples with single isotopic run. Note that the error bar for CAI is significant (~500 ppm) and omitted in this.
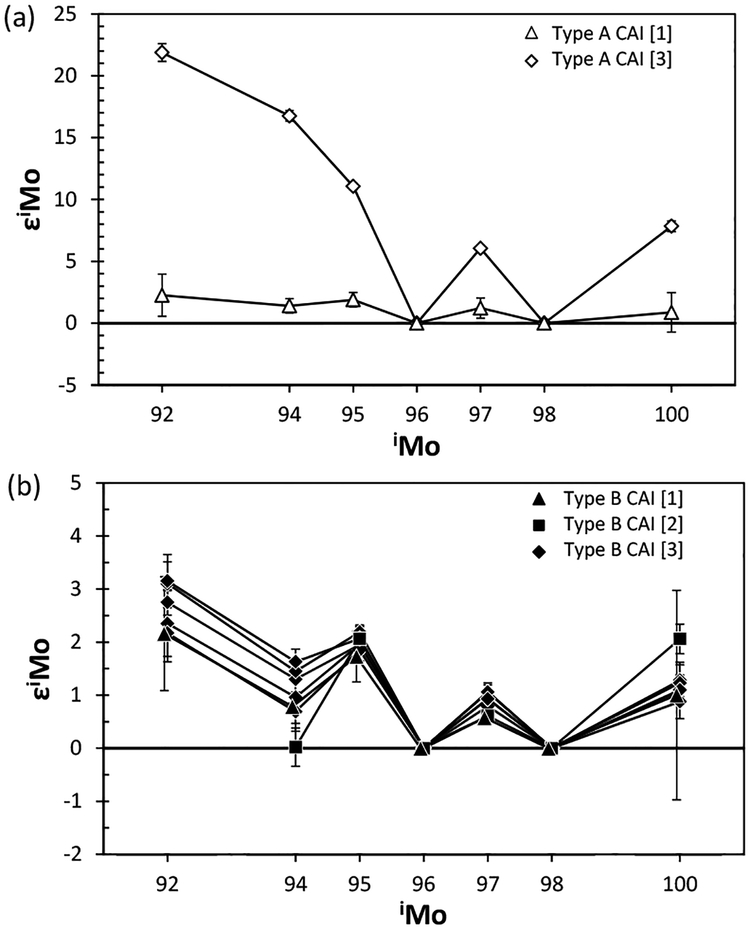
Molybdenum isotope compositions in (a) Type A CAIs and (b) Type B CAIs. Data Sources: [1] Becker et al. (2003a), [2] Yin et al. (2002), [3] Burkhardt et al. (2011). Error bars are the internal precision of individual isotopic run for samples with single measurement.
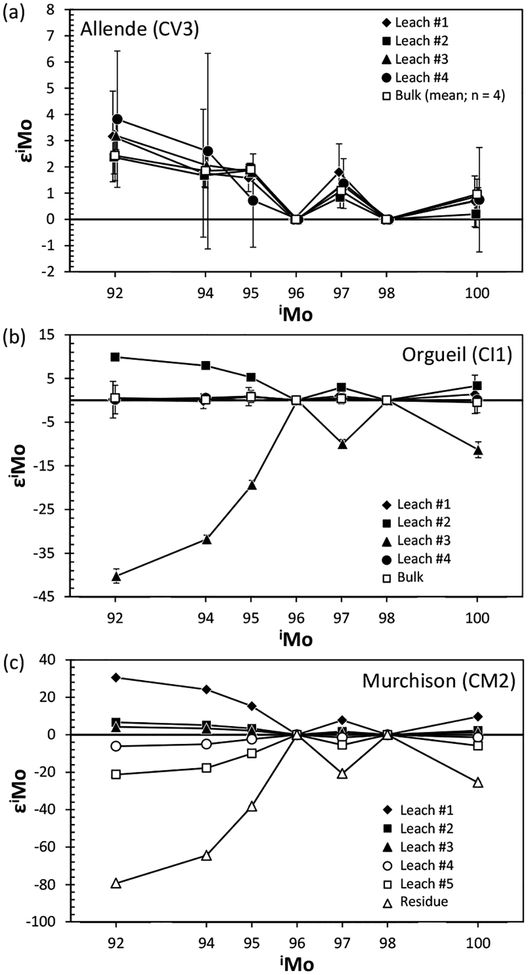
Molybdenum isotope compositions in acid leachates from (a) Allende, (b) Orgueil, and (c) Murchison. Data sources: Dauphas et al. (2002a, 2002b), Burkhardt et al. (2012b). Error bars are the internal precision of individual isotopic run for samples with single measurement.
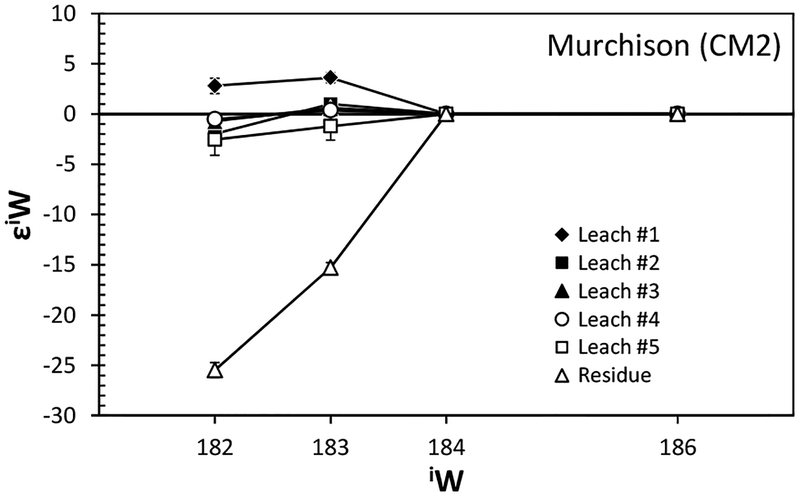
Tungsten isotope compositions in acid leachates from Murchison. Data source: Burkhardt et al. (2012a). Error bars are the internal precision of individual isotopic run for samples with single measurement.
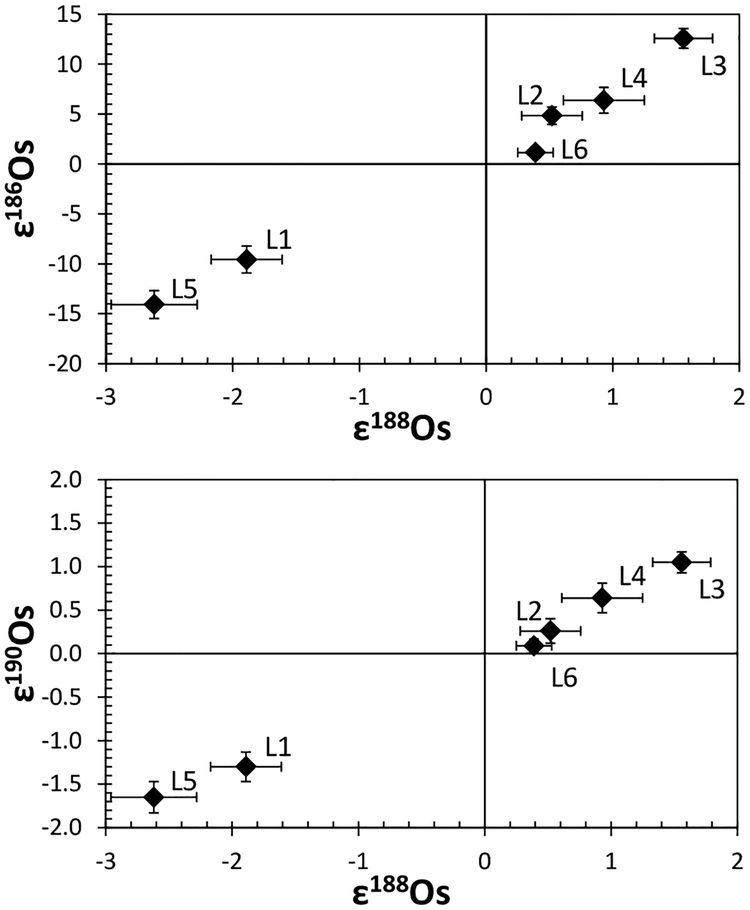
Osmium isotope anomalies in acid leachates from Murchison. L1–L6 indicate leaching steps. Data source: Reisberg et al. (2009). Error bars are the internal precision of individual isotopic run for samples with single measurement.
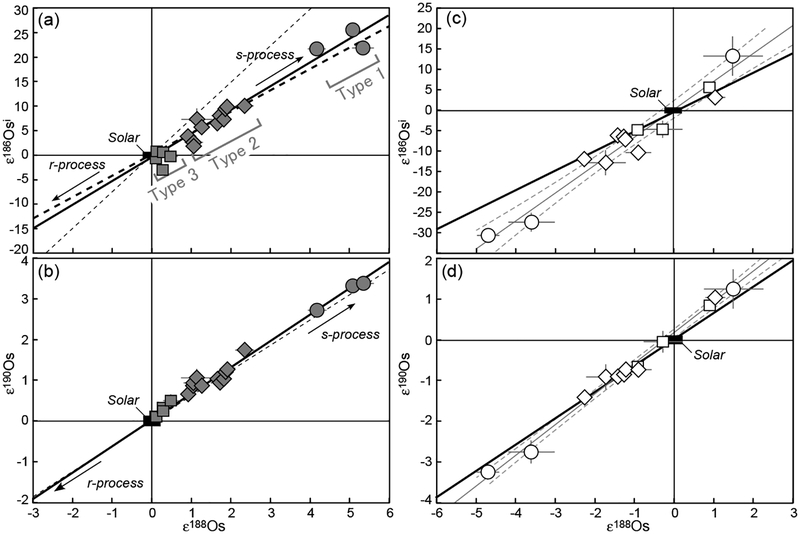
Osmium isotope anomalies in (a, b) acid residues and (c, d) acid leachates from carbonaceous and ordinary chondrites. Data are from Yokoyama et al. (2010). Error bars are uncertainties of individual measurements (2 SE). Circle, diamond, and square symbols are residues (filled) and leachates (open) from chondrite samples with petrologic types 1, 2, and 3, respectively. Black bold lines represent mixing lines between a solar component and a presumed s-process component, for which the slopes are 4.84 ± 0.34 for (a,c) and 0.647 ± 0.027 for (b,d). Bold and thin dashed lines in (a, b) are mixing trends for the solar and an s-process component calculated by Reisberg et al. (2009) using the Os MACS values in Mosconi et al. (2006) and Bao et al. (2000), respectively. Gray thin lines in (c, d) represent regressions of leachate samples with 2σ error envelope (gray dashed curves).
Osmium isotope anomalies in acid residues from carbonaceous, ordinary and enstatite chondrites. Data are from Yokoyama et al. (2011). Error bars are uncertainties of individual measurements (2 SE). Bold lines are regressions of data for acid residues from ten primitive chondrites obtained in Yokoyama et al. (2010) which represent mixing lines between solar component and presumed s-process component.
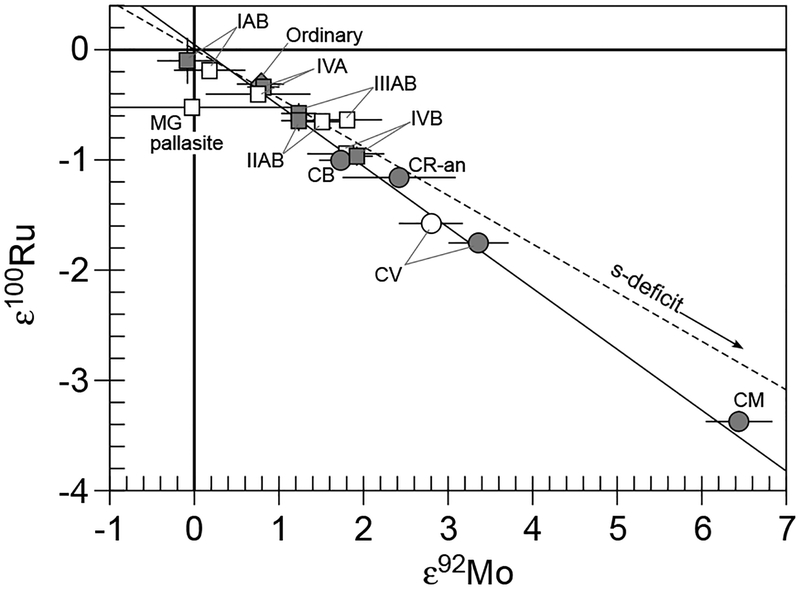
Correlation of Mo and Ru isotope anomalies in meteorites. Data are from Dauphas et al. (2004) and Fischer-Gödde et al. (2013).
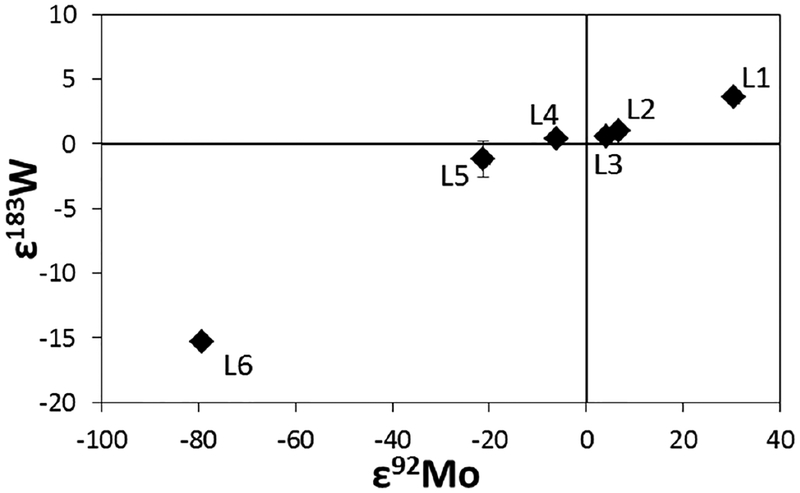
Correlation of Mo and W isotope anomalies in meteorites. Data are from Burkhardt et al. (2012b).
References
-
- Akram W, Schönbächler M, Sprung P, Vogel N (2013) Zirconium–Hafnium Isotope Evidence from Meteorites for the Decoupled Synthesis of Light and Heavy Neutron-rich Nuclei. Astrophys J 777:169
-
- Albarède F (2009) Volatile accretion history of the terrestrial planets and dynamic implications. Nature 461:1227–1233 - PubMed
-
- Albarède F, Telouk P, Blichert-Toft J, Boyet M, Agranier A, Nelson B (2004) Precise and accurate isotopic measurements using multiple-collector ICPMS. Geochim Cosmochim Acta 68:2725–2744
-
- Alexander CMO’D (1993) Presolar SiC in Chondrites: How Variable and How Many Sources. Geochim Cosmochim Acta 57:2869–2888
-
- Alexander CMO’D, Nittler LR (1999) The galactic evolution of Si, Ti, and O isotopic ratios. Astrophys J 519:222–235
Grants and funding
LinkOut - more resources
Full Text Sources
Other Literature Sources