

Combinatorial representation of parameter space for switching networks
- PMID: 30774565
- PMCID: PMC6376991
- DOI: 10.1137/15M1052743
Combinatorial representation of parameter space for switching networks
Abstract
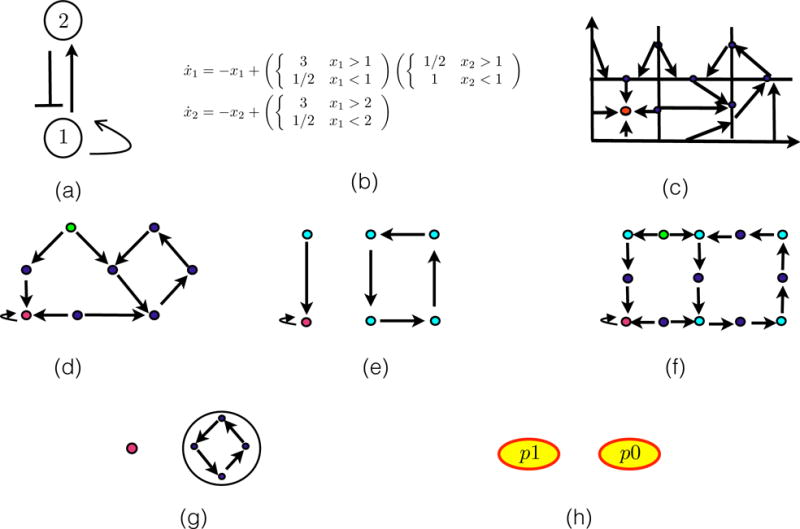
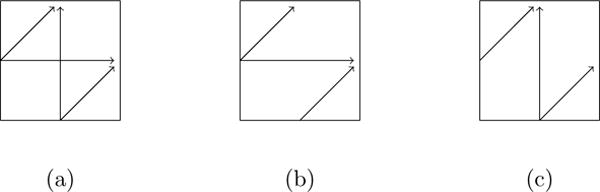
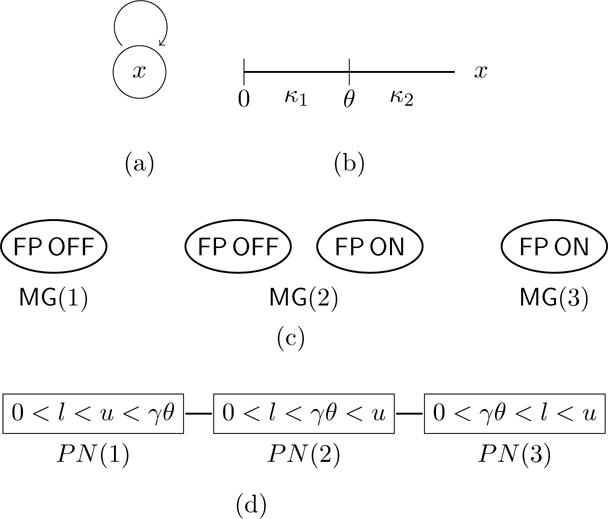
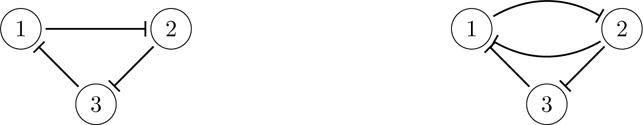
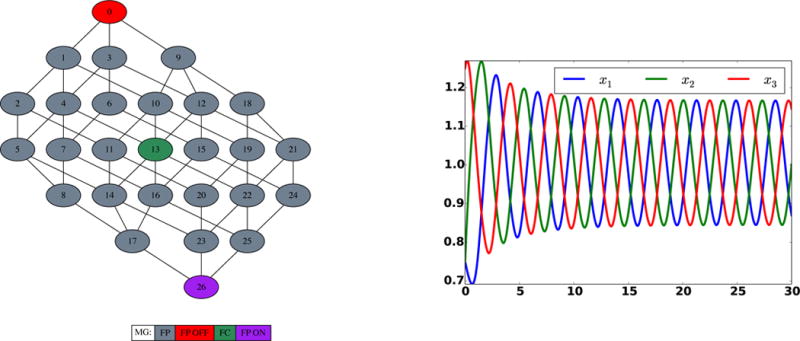
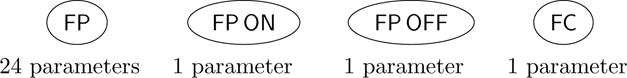
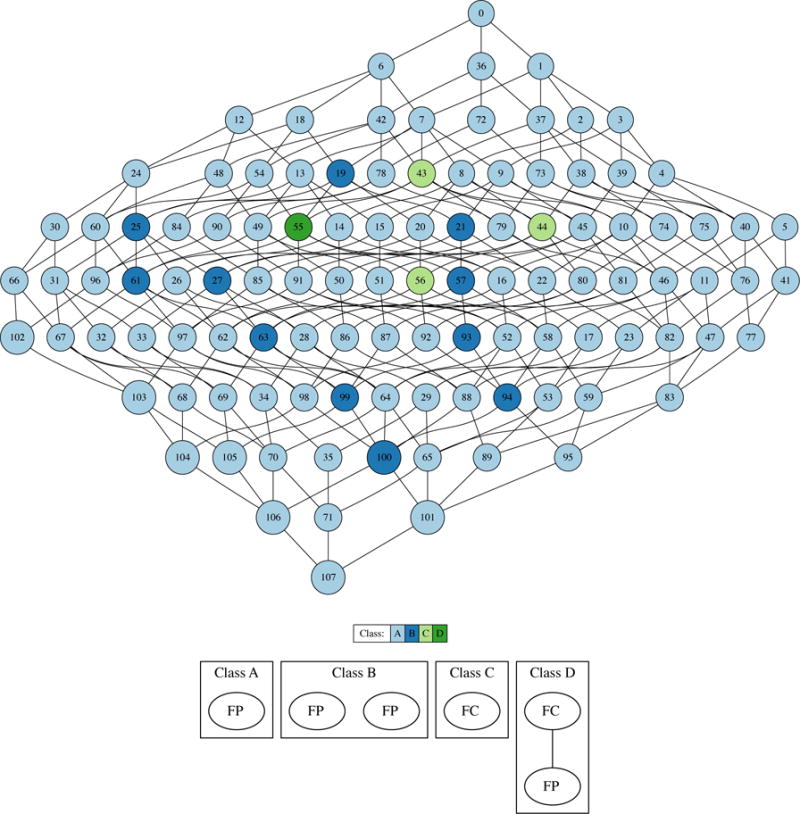
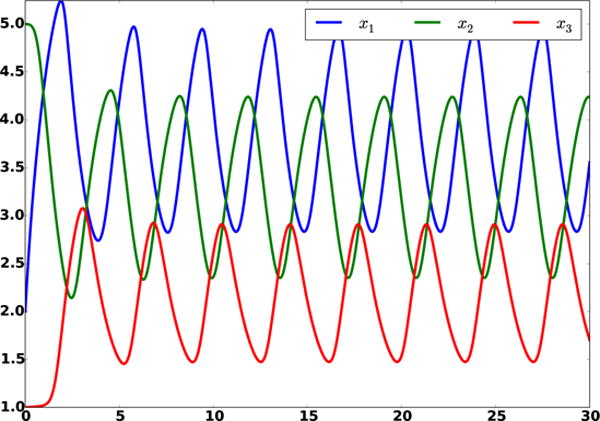
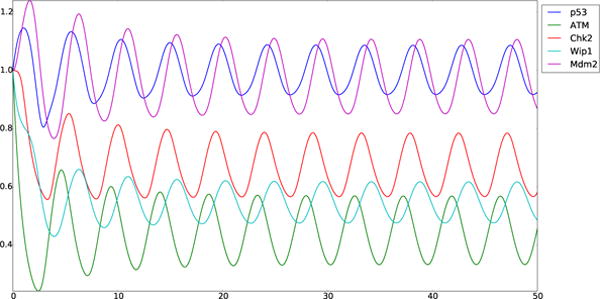
We describe the theoretical and computational framework for the Dynamic Signatures for Genetic Regulatory Network ( DSGRN) database. The motivation stems from urgent need to understand the global dynamics of biologically relevant signal transduction/gene regulatory networks that have at least 5 to 10 nodes, involve multiple interactions, and decades of parameters. The input to the database computations is a regulatory network, i.e. a directed graph with edges indicating up or down regulation. A computational model based on switching networks is generated from the regulatory network. The phase space dimension of this model equals the number of nodes and the associated parameter space consists of one parameter for each node (a decay rate), and three parameters for each edge (low level of expression, high level of expression, and threshold at which expression levels change). Since the nonlinearities of switching systems are piece-wise constant, there is a natural decomposition of phase space into cells from which the dynamics can be described combinatorially in terms of a state transition graph. This in turn leads to a compact representation of the global dynamics called an annotated Morse graph that identifies recurrent and nonrecurrent dynamics. The focus of this paper is on the construction of a natural computable finite decomposition of parameter space into domains where the annotated Morse graph description of dynamics is constant. We use this decomposition to construct an SQL database that can be effectively searched for dynamical signatures such as bistability, stable or unstable oscillations, and stable equilibria. We include two simple 3-node networks to provide small explicit examples of the type of information stored in the DSGRN database. To demonstrate the computational capabilities of this system we consider a simple network associated with p53 that involves 5 nodes and a 29-dimensional parameter space.
Figures


References
-
- Aho AV, Garey MR, Ullman JD. The transitive reduction of a directed graph. SIAM Journal on Computing. 1972;1(2):131–137.
-
- Albert R, Collins JJ, Glass L. Introduction to Focus Issue: Quantitative approaches to genetic networks. Chaos. 2013 Jun;23(2):025001. - PubMed
-
- Arai Z, Kalies W, Kokubu H, Mischaikow K, Oka H, Pilarczyk P. A database schema for the analysis of global dynamics of multiparameter systems. SIAM Journal on Applied Dynamical Systems. 2009;8(3):757–789.
-
- Belta C, Habets LCGJM. Controlling a class of nonlinear systems on rectangles. IEEE Trans Automatic Cont. 2006 Nov;51(11):1749–1759.
Grants and funding
LinkOut - more resources
Full Text Sources
Research Materials
Miscellaneous