. 2019 Feb 1:10:17.
doi: 10.3389/fphys.2019.00017. eCollection 2019.

The Left and Right Ventricles Respond Differently to Variation of Pacing Delays in Cardiac Resynchronization Therapy: A Combined Experimental- Computational Approach

Affiliations

The Left and Right Ventricles Respond Differently to Variation of Pacing Delays in Cardiac Resynchronization Therapy: A Combined Experimental- Computational Approach

Erik Willemen et al. Front Physiol. .

Abstract

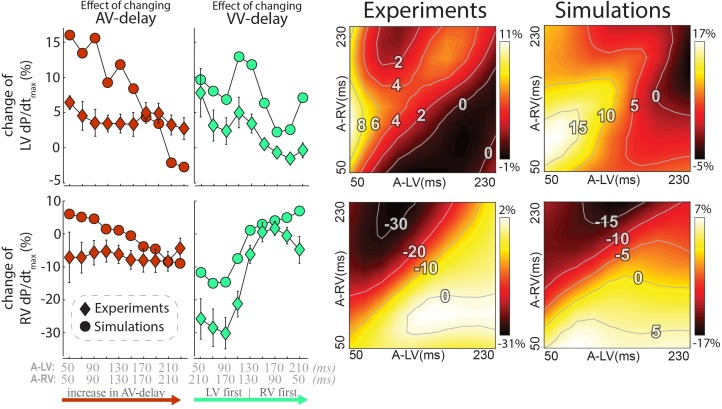
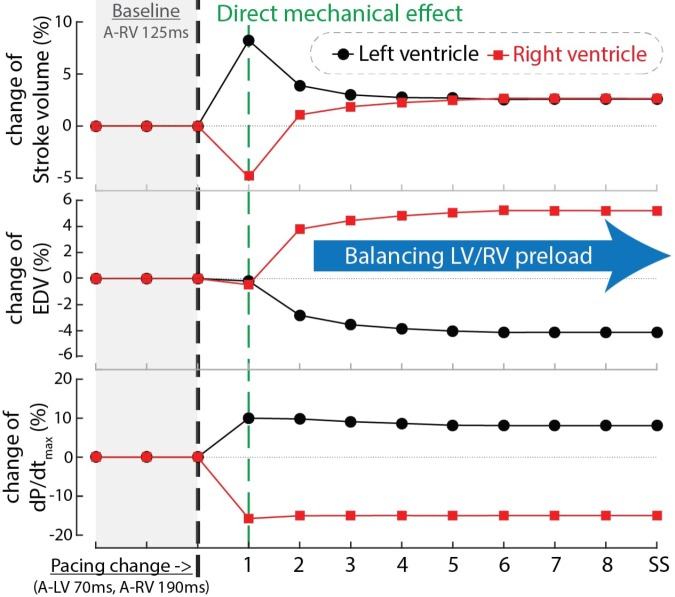
Introduction: Timing of atrial, right (RV), and left ventricular (LV) stimulation in cardiac resynchronization therapy (CRT) is known to affect electrical activation and pump function of the LV. In this study, we used computer simulations, with input from animal experiments, to investigate the effect of varying pacing delays on both LV and RV electrical dyssynchrony and contractile function. Methods: A pacing protocol was performed in dogs with atrioventricular block (N = 6), using 100 different combinations of atrial (A)-LV and A-RV pacing delays. Regional LV and RV electrical activation times were measured using 112 electrodes and LV and RV pressures were measured with catheter-tip micromanometers. Contractile response to a pacing delay was defined as relative change of the maximum rate of LV and RV pressure rise (dP/dtmax) compared to RV pacing with an A-RV delay of 125 ms. The pacing protocol was simulated in the CircAdapt model of cardiovascular system dynamics, using the experimentally acquired electrical mapping data as input. Results: Ventricular electrical activation changed with changes in the amount of LV or RV pre-excitation. The resulting changes in dP/dtmax differed markedly between the LV and RV. Pacing the LV 10-50 ms before the RV led to the largest increases in LV dP/dtmax. In contrast, RV dP/dtmax was highest with RV pre-excitation and decreased up to 33% with LV pre-excitation. These opposite patterns of changes in RV and LV dP/dtmax were reproduced by the simulations. The simulations extended these observations by showing that changes in steady-state biventricular cardiac output differed from changes in both LV and RV dP/dtmax. The model allowed to explain the discrepant changes in dP/dtmax and cardiac output by coupling between atria and ventricles as well as between the ventricles. Conclusion: The LV and the RV respond in a opposite manner to variation in the amount of LV or RV pre-excitation. Computer simulations capture LV and RV behavior during pacing delay variation and may be used in the design of new CRT optimization studies.

Keywords: CircAdapt; cardiac resynchronization therapy; computer simulation; dyssynchrony; hemodynamics; optimization; right ventricle; therapy optimization studies.


Figures

FIGURE 1
FIGURE 1
Schematic representation of the methods used in this study. Hundred different A-LV/A-RV pacing delay combinations were programmed (A) while pressures and local electrical activation were measured (B). Generic activation maps, derived from local electrograms, were used as onset of mechanical activation in the computer simulations (C). The resulting output of the simulations and measurements was compared for validation purposes. The green square in the heat maps indicates the baseline pacing setting.
FIGURE 2
FIGURE 2
Epicardial electric activation maps in a paced dog heart with complete AV block during LV pre-excitation (left), simultaneous pacing (middle), and RV pre-excitation (right). Black arrows indicate capture, whereas gray arrows indicate loss of capture.
FIGURE 3
FIGURE 3
Changes in electrical dyssynchrony indices during variation in pacing delay in the animal experiments. The left column shows the effect of increasing AV delay during simultaneous RV + LV pacing; the middle column shows changes in VV delay (green, from LV pre-excitation to RV pre-excitation) and the heat maps on the right are the results for all pacing setting (mean of six dogs, bars represent standard errors of the mean). From top to bottom: Total activation time (TAT) of the total LV (free wall and septum), RV free wall (RVFW), and VEU (Ventricular Electrical Uncoupling). The green square in each heat map indicate the baseline pacing setting.
FIGURE 4
FIGURE 4
Changes in contractile response as a result of changes in pacing delays in experiments and simulations. Percentile change from baseline of LV dP/dtmax (top) and RV dP/dtmax (bottom). The left rows depict the same AV and VV delay settings as in Figure 3 are shown. Heat maps for both the experiment (3rd column) and simulations (4th column). Diamonds: Canine measurements (Mean (standard error of the mean) of six dogs; Circles: Simulation output.
FIGURE 5
FIGURE 5
Relative change in simulated steady-state cardiac output with a change in pacing delay settings. Depicted are the changes relative to baseline (see text).
FIGURE 6
FIGURE 6
Time courses of the relative change of stroke volume (top), end-diastolic volume (EDV, mid) and dP/dtmax of the LV (black circles) and RV (red squares) after changing pacing delay from baseline (A-RV 125 ms) to LV pre-excitation (A-LV 70 ms, A-RV 190 ms) in computer simulations. The black dashed line indicates the start of the change in pacing delay. The numbers in the blue bar indicate the number of simulated cardiac cycles. SS, steady state.
FIGURE 7
FIGURE 7
Relative change in stroke volume of the left (black circles) and right (red squares) ventricle over a number of simulated cycles until steady-state (SS) after changing pacing delay (the nine settings shown in the black bars). Black dashed line indicates the moment of changing the pacing delays while the green line marks the first beat.

Similar articles

Cited by

References

    1. Abraham W. W. T., Fisher W. G. W., Smith A. L., Delurgio D. B., Leon A. R., Loh E., et al. (2002). Cardiac resynchronization in chronic heart failure. N. Engl. J. Med. 346 1845–1853. 10.1056/NEJMoa013168 - DOI - PubMed
    1. Arts T., Delhaas T., Bovendeerd P., Verbeek X., Prinzen F. (2005). Adaptation to mechanical load determines shape and properties of heart and circulation: the CircAdapt model. Am. J. Physiol. Heart Circ. Physiol. 288 1943–1954. 10.1152/ajpheart.00444.2004 - DOI - PubMed
    1. Arts T., Lumens J., Kroon W., Delhaas T. (2012). Control of whole heart geometry by intramyocardial mechano-feedback: a model study. PLoS Comput. Biol. 8:e1002369. 10.1371/journal.pcbi.1002369 - DOI - PMC - PubMed
    1. Arts T., Prinzen F. W., Snoeckx L. H. E., Rijcken J. M., Reneman R. S. (1994). Adaption of cardiac structure by mechanical feedback in the environment of the cell: a model study. Biophys. J. 66 953–961. 10.1016/S0006-3495(94)80876-8 - DOI - PMC - PubMed
    1. Auger D., Hoke U., Bax J. J., Boersma E., Delgado V. (2013). Effect of atrioventricular and ventriculoventricular delay optimization on clinical and echocardiographic outcomes of patients treated with cardiac resynchronization therapy: a meta-analysis. Am. Heart J. 166 20–29. 10.1016/j.ahj.2013.03.021 - DOI - PubMed