. 2019 Feb 1:10:22.
doi: 10.3389/fendo.2019.00022. eCollection 2019.

Teneurin C-Terminal Associated Peptide (TCAP)-1 and Latrophilin Interaction in HEK293 Cells: Evidence for Modulation of Intercellular Adhesion

Affiliations

Teneurin C-Terminal Associated Peptide (TCAP)-1 and Latrophilin Interaction in HEK293 Cells: Evidence for Modulation of Intercellular Adhesion

Mia Husić et al. Front Endocrinol (Lausanne). .

Abstract

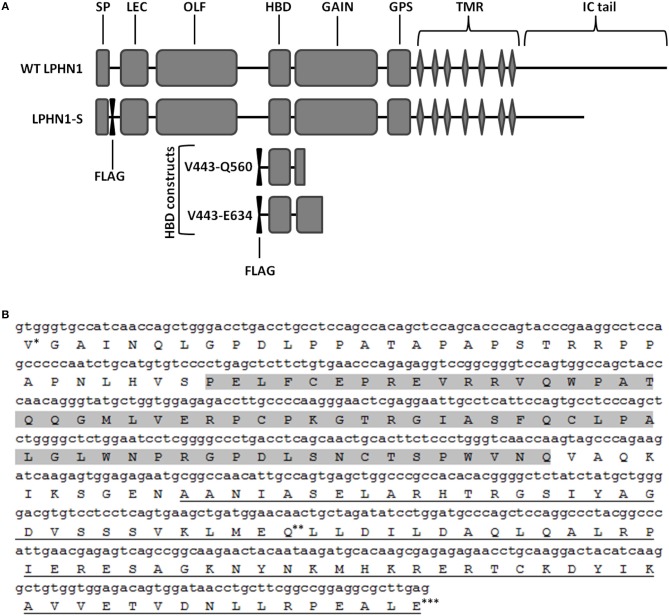
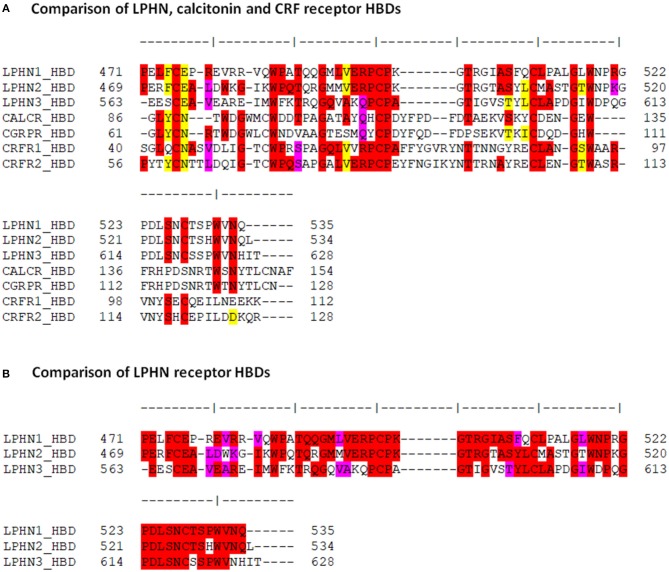
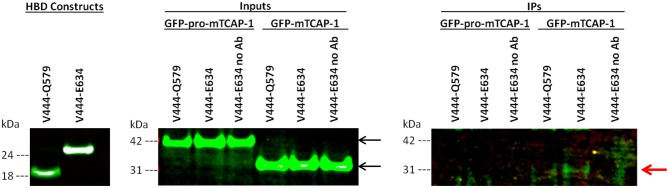
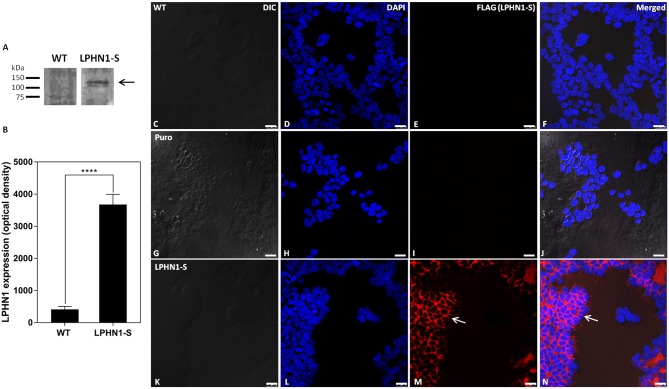
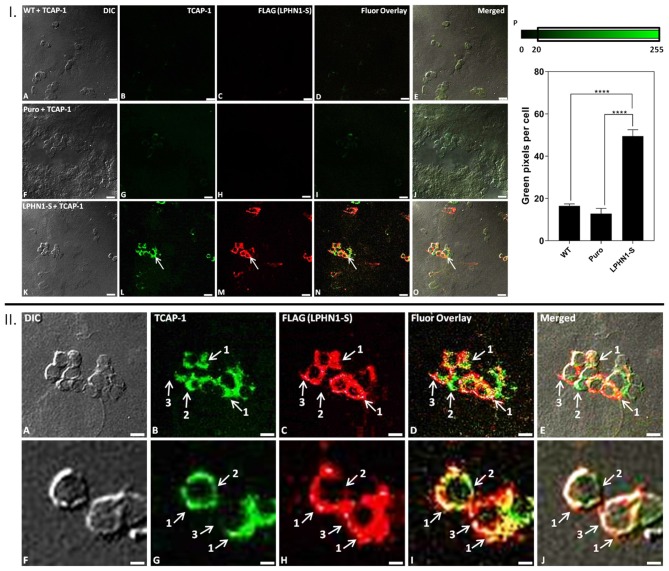
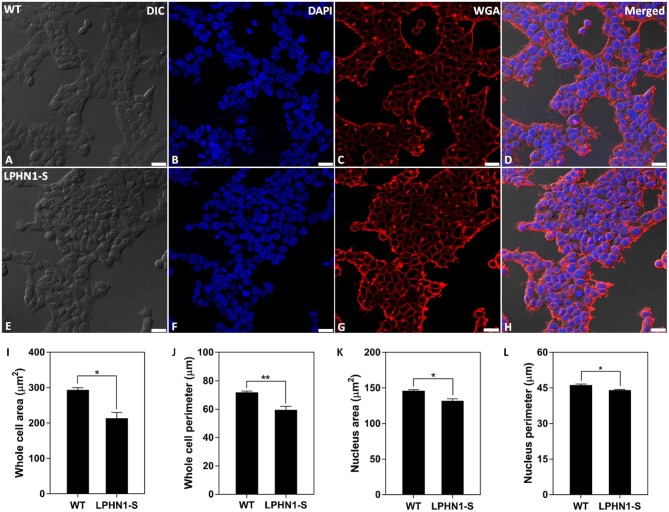
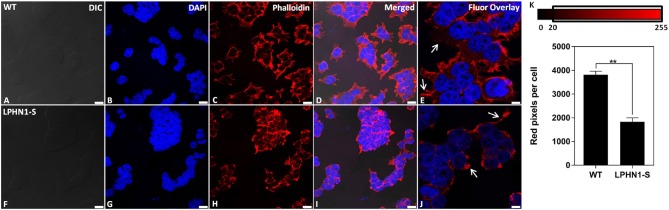
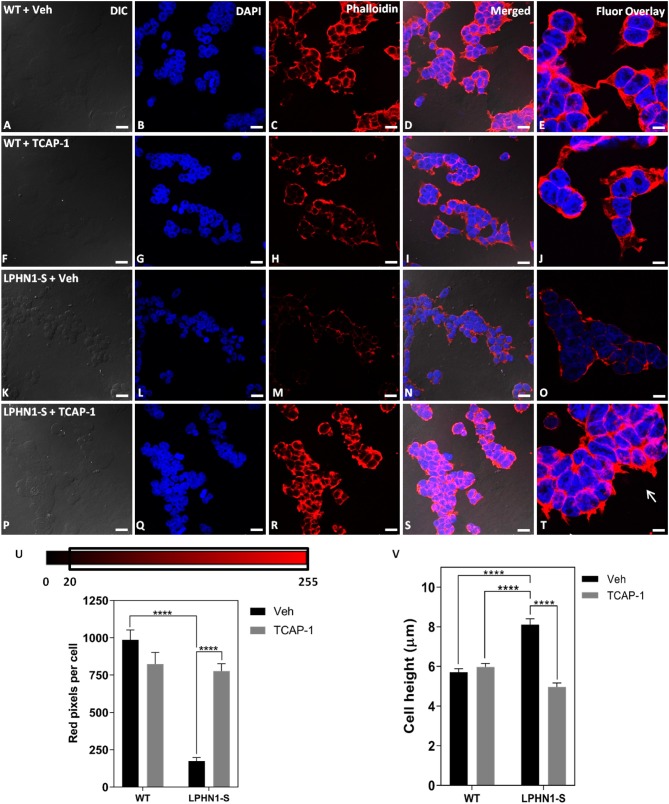
The teneurins are a family of four transmembrane proteins essential to intercellular adhesion processes, and are required for the development and maintenance of tissues. The Adhesion G protein-coupled receptor (GPCR) subclass latrophilins (ADGRL), or simply the latrophilins (LPHN), are putative receptors of the teneurins and act, in part, to mediate intercellular adhesion via binding with the teneurin extracellular region. At the distal tip of the extracellular region of each teneurin lies a peptide sequence termed the teneurin C-terminal associated peptide (TCAP). TCAP-1, associated with teneurin-1, is itself bioactive, suggesting that TCAP is a critical functional region of teneurin. However, the role of TCAP-1 has not been established with respect to its ability to interact with LPHN to induce downstream effects. To establish that TCAP-1 binds to LPHN1, a FLAG-tagged hormone binding domain (HBD) of LPHN1 and a GFP-tagged TCAP-1 peptide were co-expressed in HEK293 cells. Both immunoreactive epitopes were co-localized as a single band after immunoprecipitation, indicating an association between the two proteins. Moreover, fluorescent co-labeling occurred at the plasma membrane of LPHN1 over-expressing cells when treated with a FITC-tagged TCAP-1 variant. Expression of LPHN1 and treatment with TCAP-1 modulated the actin-based cytoskeleton in these cells in a manner consistent with previously reported actions of TCAP-1 and affected the overall morphology and aggregation of the cells. This study indicates that TCAP-1 may associate directly with LPHN1 and could play a role in the modulation of cytoskeletal organization and intercellular adhesion and aggregation via this interaction.

Keywords: GPCR; LPHN; TCAP; adhesion; latrophilin; peptides; receptor-ligand interaction; teneurin.


Figures

Figure 1
Figure 1
Schematic of the wild-type LPHN1 and the constructs expressed in HEK293 cells. (A) Wild-type (WT) LPHN1 contains, on its extracellular region, a signal peptide (SP), a lectin domain (LEC), an olfactomedin-like domain (OLF), a hormone binding domain (HBD) and a GPCR autoproteolysis inducing (GAIN) domain, a GPCR proteolytic site (GPS), followed by a 7-transmembrane region (TMR) and an intracellular (IC) tail. The LPHN1 construct expressed in HEK293 cells, LPHN1-S, contains a FLAG tag downstream of the SP and a truncated intracellular (IC) tail. Constructs used for the co-immunoprecipitation assay of the LPHN1 HBD and TCAP-1 and their constituent domains are also indicated (HBD constructs). Each construct contains an N-terminal FLAG tag. The range of amino acid residues surrounding the HBD domain in each construct is indicated in the construct names. (B) Sequence of the LPHN1 region used for co-immunoprecipitation of TCAP-1. Construct V444-Q579 is composed of Valine 444 (*) to Glutamine 579 (**); construct V444-E634 is composed of residues Valine 444 (*) to Glutamic acid 634 (***). Gray highlight: HBD; Underline: GAIN domain.
Figure 2
Figure 2
Comparison of the amino acid sequences among the LPHN, calcitonin and CRF HBDs. (A) Amino acid sequence alignment of the HBDs for murine LPHN, calcitonin, and CRF receptors. (B) Alignment of the putative HBDs for the three LPHN receptors. Residue identity is indicated in red, conservative substitutions are indicated in pink, and homologous replacements are indicated in yellow.
Figure 3
Figure 3
The mature TCAP-1 peptide interacts with the HBD and a partial GAIN domain of LPHN1. (HBD constructs) LPHN1 HBD constructs were successfully expressed in HEK293 cells. (Inputs) Input lanes indicate strong presence of GFP-pro-mTCAP-1 or mature TCAP-1 in cell lysates prior to immunoprecipitation with HBD constructs V444-Q579 and V444-E634. Expected band size of GFP-pro-mTCAP-1 and GFP-mTCAP-1 are 40 and 30 kDa, respectively (black arrows). (IPs) Immunoprecipitation lanes show western blot resolution of corresponding eluates from input lanes. “No Ab” indicates that no anti-FLAG antibody was used to for immunoprecipitation of the HBD construct, serving as a negative control. No bands corresponding to GFP-pro-mTCAP-1 were isolated with either of the HBD constructs used for IP. A faint band at ~30 kDa, corresponding to GFP-mTCAP-1, is present when HBD V444-Q579 was used for IP. A stronger band of the same size is seen when IP was performed using HBD V444-E634 (red arrow). No bands corresponding to the GFP-pro-mTCAP-1 peptide were observed in the IP.
Figure 4
Figure 4
HEK-LPHN1-S cells strongly express LPHN1-S, whereas HEK-WT and HEK-puro cells do not. (A) Western blot of LPHN1 expression in HEK-WT and HEK-LPHN1-S cells. A band at ~120 kDa is present in the HEK-LPHN1-S cells, but not in the HEK-WT cells (black arrow). Expected size is 116 kDa. (B) Quantification of LPHN1 protein expression in HEK-WT and HEK-LPHN1 cells. (Mean ± SEM; n = 4; ****p < 0.0001; two-tailed t-test) (C–F) Confocal images of HEK-WT cells. (G–J) Confocal images of HEK-Puro cells. (K–N) Confocal images of HEK-LPHN1-S cells. (C,G,K) DIC image. (D,H,L) DAPI staining of nuclear proteins. (E,I,M) FLAG-tagged LPHN1-S. (F,J,N) Merged images of A–C, G–I, and K–M, respectively. White arrow in M,N indicates FLAG-tagged LPHN1-S expression in HEK-LPHN1-S cells. A strong FLAG signal is seen at the cell membrane of HEK-LPHN1-S cells only, indicating strong expression of the LPHN1-S construct in this region (white arrow). HEK-WT and HEK-Puro cells showed no FLAG signal. Scale bar in all images is 25 μm.
Figure 5
Figure 5
FITC-K37-mTCAP-1 co-localizes with LPHN1 expression. I: (A–E) HEK-WT cells treated with FITC-K37-mTCAP-1. (F–J) HEK-Puro cells treated with FITC-K37-mTCAP-1. (K–O) HEK-LPHN1-S cells treated with FITC-K37-mTCAP-1. Arrows indicate regions of FITC-K37-mTCAP-1 and LPHN1-S co-localization. (A,F,K) DIC. (B,G,L) FITC-K37-mTCAP-1. (C,H,M) FLAG (LPHN1-S) expression. (D,I,N) FITC-K37-mTCAP-1 and FLAG (LPHN1-S) fluorescence channel overlay images. (E,J,O) Merged image of all channels. A low level of green fluorescence is seen in HEK-WT and HEK-Puro cells, indicating some uptake of FITC-K37-mTCAP-1. However, HEK-LPHN1-S cells show a much brighter green fluorescence signal, indicating a higher uptake of FITC-K37-mTCAP-1. Scale bar in all images is 25 μm. (P) Average number of green pixels per cell with an intensity ranging from 20 to 255 in HEK-WT, HEK-Puro, and HEK-LPHN1-S cells treated with FITC-K37-mTCAP-1. Pixel intensity range is indicated above graph. HEK-LPHN1-S cells have a significantly higher number of green pixels with intensities of 20–255 per cell, indicating a higher degree of FITC-K37-mTCAP-1 uptake compared to HEK-WT and HEK-Puro cells. No significant differences between HEK-WT and HEK-Puro cells were observed. (Mean ± SEM; n = 5; ****p < 0.0001; one-way ANOVA) II: (A–J) Confocal images of HEK-LPHN1-S cells. (A,F) DIC. (B,G) FITC-K37-mTCAP-1. (C,H) LPHN1-S. (D,I) Merged images of B–C and G–H, respectively. (E,J) Merged images of A–C and F–H, respectively. Scale bar in A–E is 20 μm and in F–J is 6 μm. Regions of FITC-K37-mTCAP-1 and LPHN1-S co-localization on the cell membrane were predominant (arrows labeled 1); however, areas of only FITC-K37-mTCAP-1 localization (arrows labeled 2) or of only LPHN1-S localization (arrows labeled 3) were also seen present in HEK293-LPHN1-S cells.
Figure 6
Figure 6
HEK-LPHN1-S cells have a smaller whole cell and nuclear size than HEK-WT cells. (A–D) Confocal images of HEK-WT cells. (E–H) Confocal images of HEK-LPHN1-S cells. (A,E) DIC. (B,F) DAPI staining of nuclear protein. (C,G) WGA membrane stain. (D,H) Merged images of A–C and E–G, respectively. (I–L) Quantification of WT and LPHN1-S HEK whole cell size, whole cell perimeter, nuclear size and nuclear perimeter. HEK-LPHN1-S cells had significantly smaller whole cell area, whole cell perimeter, nuclear area, and nuclear perimeter than HEK-WT cells. Scale bar is 25 μm. (Mean ± SEM, n = 3, *p < 0.05, **p < 0.01, two-tailed t-test).
Figure 7
Figure 7
HEK-LPHN1-S cells have decreased f-actin expression compared to HEK-WT cells. (A–E) Confocal images of HEK-WT cells. (F–J) Confocal images of HEK-LPHN1-S cells. (A,F) DIC. (B,G) DAPI staining of nuclear proteins. (C,H) Phalloidin staining of f-actin. (D,I) Merged images of A–C and F–H, respectively. (E,J) DAPI and Phalloidin fluorescence overlay. White arrows indicate f-actin projections. HEK-WT cells are larger than HEK-LPHN1-S cells and express a much greater amount of f-actin. Their f-actin projections appear to be greater in both number and size than those of HEK-LPHN1-S cells. Scale bar in A–D, F–I is 25 μm, and in E,J is 10 μm. (K) Average number of red pixels (f-actin-bound Phalloidin signal) per cell with an intensity of 20–225 (intensity range indicated above). HEK-LPHN1-S cells have significantly fewer red pixels per cell compared to HEK-WT cells, indicating less Phalloidin staining and thus a reduced expression of f-actin. (Mean ± SEM, n = 5, **p < 0.01, two-tailed t-test).
Figure 8
Figure 8
mTCAP-1 treatment induces a strong up-regulation of f-actin and changes in cell height in HEK-LPHN1-S cells but not in HEK-WT cells. (A–E) Images of HEK-WT cells treated with vehicle for 60 min. (F–J) Images of HEK-LPHN1 cells treated with 100 nM mTCAP-1 for 60 min. (K–O) Images of HEK-WT cells treated with vehicle for 60 min. (P–T) Images of HEK-LPHN1 cells treated with mTCAP-1 for 60 min. (A,F,K,P) DIC. (B,G,L,Q) DAPI staining of nuclear proteins. (C,H,M,R) Phalloidin staining of f-actin. (D,I,N,S) Merged images of A–C, F–H, K–N, and P–S, respectively. (E,J,O,T) DAPI and Phalloidin fluorescence overlay. White arrows in T indicate f-actin projections. mTCAP-1 treatment does not cause an increase in f-actin in HEK-WT cells. In HEK-LPHN1-S cells, however, a significant upregulation of f-actin is seen upon treatment with mTCAP-1. Scale bar in A–D, F–I, K–N, P–S is 25 μm and in E,J,O,T is 10 μm. (U) Average number of red pixels (f-actin-bound Phalloidin signal) per cell with an intensity of 20–225 (intensity range indicated above) in HEK-WT and HEK-LPHN1 cells treated with either vehicle (gray) or 100 nM mTCAP-1 (black) for 60 min. Compared to vehicle treatment, mTCAP-1 increased f-actin in HEK-LPHN1-S cells only. (Mean ± SEM; n = 5, ****p < 0.0001; two-way ANOVA and a Tukey's post hoc test) (V) Height measurements of HEK-LPHN1-S and HEK-WT cells treated with either vehicle (gray) or 100 nM mTCAP-1 (black) for 60 min. No differences were observed between mean cell heights of vehicle and mTCAP-1 treated HEK-WT cells. Vehicle-treated HEK-LPHN1-S cells were larger than either HEK-WT group. mTCAP-1 treatment of HEK-LPHN1-S cells decreased cell height. (Mean ± SEM; n = 3, 4 measurements per n; ****p < 0.0001; two-way ANOVA with a Tukey's post hoc test).

Similar articles

Cited by

References

    1. Baumgartner S, Chiquet-Ehrismann R. Tena, a Drosophila gene related to tenascin shows selective transcript localization. Mech Dev. (1993) 40:165–76. 10.1016/0925-4773(93)90074-8 - DOI - PubMed
    1. Baumgartner S, Martin D, Hagios C, Chiquet-Ehrismann R. Ten-m, a Drosophila gene related to tenascin is a new pair-rule gene. EMBO J. (1994) 13:3728–40. 10.1002/j.1460-2075.1994.tb06682.x - DOI - PMC - PubMed
    1. Levine A, Bashan-Ahmed A, Budai-Hadrian O, Gartenberg D, Menasherow S, Wides R. Odd Oz: a novel Drosophila pair rule gene. Cell (1994) 77:587–98. 10.1016/0092-8674(94)90220-8 - DOI - PubMed
    1. Nunes SM, Ferralli J, Choi K, Brown-Luedi M, Minet AD, Chiquet-Ehrismann R. The intracellular domain of teneurin-1 interacts with MBD1 and CAP/ponsin resulting in subcellular codistribution and translocation to the nuclear matrix. Exp Cell Res. (2005) 305:122–32. 10.1016/j.yexcr.2004.12.020 - DOI - PubMed
    1. Tucker RP, Chiquet-Ehrismann R. Teneurins: a conserved family of transmembrane proteins involved in intercellular signalling during development. Dev Biol. (2006) 290:237–45. 10.1016/j.ydbio.2005.11.038 - DOI - PubMed