. 2019 Feb 1:10:127.
doi: 10.3389/fimmu.2019.00127. eCollection 2019.

Deficiency in IL-33/ST2 Axis Reshapes Mitochondrial Metabolism in Lipopolysaccharide-Stimulated Macrophages

Affiliations

Deficiency in IL-33/ST2 Axis Reshapes Mitochondrial Metabolism in Lipopolysaccharide-Stimulated Macrophages

Huadan Xu et al. Front Immunol. .

Abstract

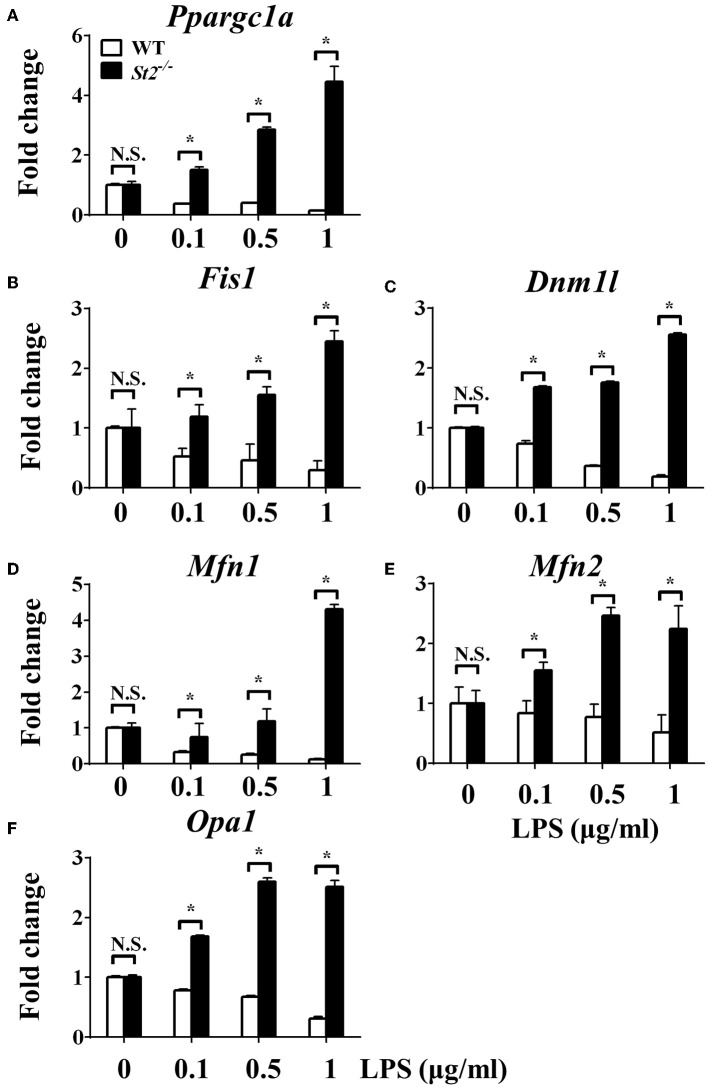
The polarization and function of macrophages play essential roles in controlling immune responses. Interleukin (IL)-33 is a member of the IL-1 family that has been shown to influence macrophage activation and polarization, but the underlying mechanisms are not fully understood. Mitochondrial metabolism has been reported to be a central player in shaping macrophage polarization; previous studies have shown that both aerobic glycolysis and oxidative phosphorylation uniquely regulate the functions of M1 and M2 macrophages. Whether IL-33 polarizes macrophages by reshaping mitochondrial metabolism requires further investigation. In this work, we examined the mitochondrial metabolism of bone marrow-derived macrophages (BMDMs) from either wild type (WT), Il33-overexpressing, or IL-33 receptor knockout (St2-/-) mice challenged with lipopolysaccharide (LPS). We found that after LPS stimulation, compared with WT BMDMs, St2-/- BMDMs had reduced cytokine production and increased numbers and activity of mitochondria via the metabolism regulator peroxisome proliferator-activated receptor-C coactivator-1 α (PGC1α). This was demonstrated by increased mitochondrial DNA copy number, mitochondria counts, mitochondria fission- and fusion-related gene expression, oxygen consumption rates, and ATP production, and decreased glucose uptake, lactate production, and extracellular acidification rates. For Il33-overexpressing BMDMs, the metabolic reprogramming upon LPS stimulation was similar to WT BMDMs, and was accompanied by increased M1 macrophage activity. Our findings suggested that the pleiotropic IL-33/ST2 pathway may influence the polarization and function of macrophages by regulating mitochondrial metabolism.

Keywords: ATP; IL-33; PGC1α; ST2; macrophage.


Figures

Figure 1
Figure 1
ST2 deficiency impaired macrophages responses upon LPS stimulation. BMDMs from BALB/c or St2−/− mice were stimulated with LPS (0, 0.1, 0.5, and 1.0 μg/ml) for 72 h. Total RNA was isolated and the expression of Il1a (A), Il1b (B), Ifng (C), and Nos2 (D) was evaluated by qPCR; the concentration of IL-1α (E), IL-1β (F), and IFNγ (G) in the supernatant was evaluated by ELISA. Vertical bars = SEMs (n = 3 per group per experiment). N.S., no significant difference; *p < 0.05.
Figure 2
Figure 2
ST2 deficiency affected the metabolism of macrophages upon LPS stimulation. BMDMs from BALB/c or St2−/− mice were stimulated with LPS (0, 0.1, 0.5, and 1.0 μg/ml) for 24 h and the (A) extracellular oxygen consumption rate (OCR) was immediately measured by fluorescence intensity of a typical oxygen probe; (B) extracellular acidification rate (ECAR) was measured by incubation at 37°C for 3 h. The lactate excretion (C), glucose uptake (D), ATP (E), and relative mitochondrial DNA copy numbers (F) of BMDMs were measured after 72 h stimulation of LPS (0, 0.1, 0.5, 1.0 μg/ml). Vertical bars = SEMs (n = 3 per group per experiment). N.S., no significant difference; *p < 0.05.
Figure 3
Figure 3
ST2 deficiency was associated with enhanced mitochondrial biogenesis. BMDMs from BALB/c or St2−/− mice were stimulated with LPS (0, 0.1, 0.5, and 1.0 μg/ml). After 72 h, total RNA was isolated and the expression of Ppargc1a (A), Fis1 (B), Dnm1l (C), Mfn1 (D), Mfn2 (E), and Opa1 (F) were evaluated by qPCR, respectively. Vertical bars = SEMs (n = 3 per group per experiment). N.S., no significant difference; *p < 0.05.
Figure 4
Figure 4
ST2 deficiency was associated with increased mitochondria mass. BMDMs from WT (A) or St2−/− (B) mice stimulated with LPS (0, 0.1, 0.5, and 1.0 μg/ml) for 72 h. Mitochondrial mass was observed with confocal laser microscopy in BMDMs stained with MitoTracker Red (scale bar: 20 μm). Data are representative of three experiments.
Figure 5
Figure 5
IL-33 over-expression promoted the macrophages responses upon LPS stimulation. BMDMs from BALB/c or Il33 over-expressing (Il33 Tg) mice were stimulated with LPS (0, 0.1, 0.5, and 1.0 μg/ml) for 72 h. Total RNA was isolated and the expression of Il1a (A), Il1b (B), Ifng (C), and Nos2 (D) was evaluated by qPCR; the concentration of IL-1α (E), IL-1β (F), and IFNγ (G) in the supernatant was evaluated by ELISA. Vertical bars = SEMs (n = 3 per group per experiment). N.S., no significant difference; *p < 0.05.
Figure 6
Figure 6
IL-33 over-expression affected the metabolism of macrophages upon LPS stimulation. BMDMs from BALB/c or Il33 over-expressing (Il33 Tg) mice were stimulated with LPS (0, 0.1, 0.5, and 1.0 μg/ml) for 24 h and the (A) extracellular oxygen consumption rate (OCR) was immediately measured by fluorescence intensity of a typical oxygen probe; (B) extracellular acidification rate (ECAR) was measured by incubation at 37°C for 3 h. The lactate excretion (C), glucose uptake (D), ATP (E) and relative mitochondrial DNA copy numbers (F) of BMDMs were measured after 72 h stimulation of LPS (0, 0.1, 0.5, 1.0 μg/ml). Vertical bars = SEMs (n = 3 per group per experiment). N.S., no significant difference; *p < 0.05.
Figure 7
Figure 7
IL-33 over-expression was associated with reduced mitochondrial biogenesis. BMDMs from BALB/c or Il33 over-expressing (Il33 Tg) mice were stimulated with LPS (0, 0.1, 0.5, and 1.0 μg/ml). After 72 h, total RNA was isolated and the expression of Ppargc1a (A), Fis1 (B), Dnm1l (C), Mfn1 (D), Mfn2 (E), and Opa1 (F) was evaluated by qPCR, respectively. Vertical bars = SEMs (n = 3 per group per experiment). N.S., no significant difference; *p < 0.05.

Similar articles

Cited by

References

    1. Morris SM, Jr. Arginine metabolism: boundaries of our knowledge. J Nutr. (2007) 137:1602S−9S. 10.1093/jn/137.6.1602S - DOI - PubMed
    1. Van den Bossche J, O'Neill LA, Menon D. Macrophage immunometabolism: where are we (Going)? Trends Immunol. (2017) 38:395–406. 10.1016/j.it.2017.03.001 - DOI - PubMed
    1. Nagy C, Haschemi A. Time and demand are two critical dimensions of immunometabolism: the process of macrophage activation and the pentose phosphate pathway. Front Immunol. (2015) 6:164. 10.3389/fimmu.2015.00164 - DOI - PMC - PubMed
    1. Palsson-McDermott EM, Curtis AM, Goel G, Lauterbach MA, Sheedy FJ, Gleeson LE, et al. Pyruvate kinase M2 regulates Hif-1alpha activity and IL-1beta induction and is a critical determinant of the warburg effect in LPS-activated macrophages. Cell Metab. (2015) 21:65–80. 10.1016/j.cmet.2014.12.005 - DOI - PMC - PubMed
    1. Galvan-Pena S, O'Neill LA. Metabolic reprograming in macrophage polarization. Front Immunol. 5:420. 10.3389/fimmu.2014.00420 - DOI - PMC - PubMed

Publication types

MeSH terms

Substances

LinkOut - more resources