. 2019 Feb 1:9:3101.
doi: 10.3389/fimmu.2018.03101. eCollection 2018.

Immune Cell Composition in Human Non-small Cell Lung Cancer

Affiliations

Immune Cell Composition in Human Non-small Cell Lung Cancer

Branislava Stankovic et al. Front Immunol. .

Abstract

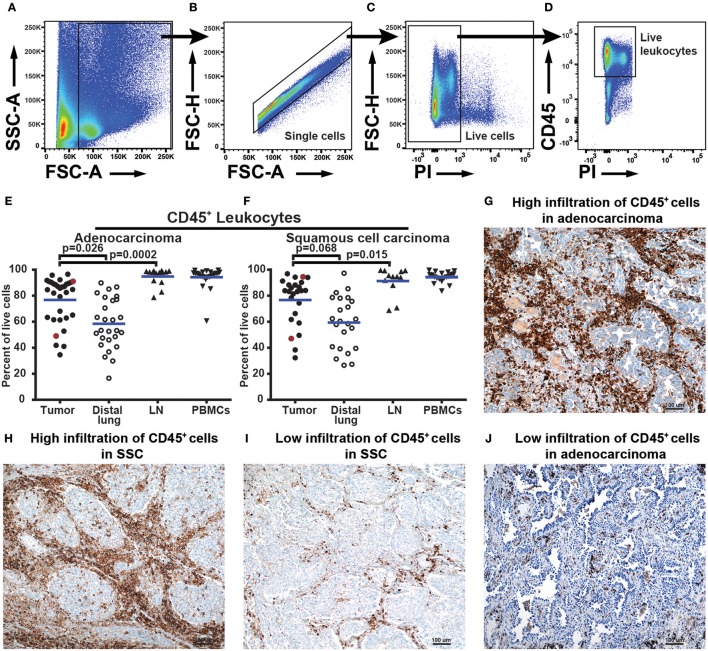
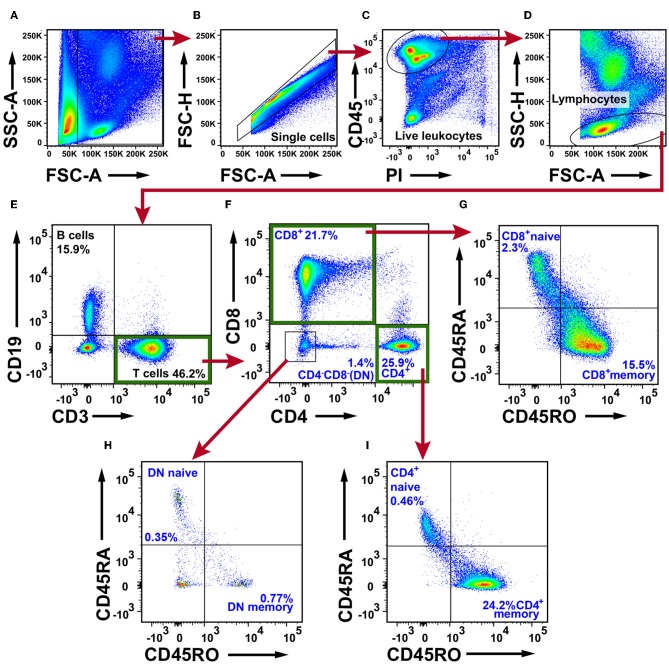
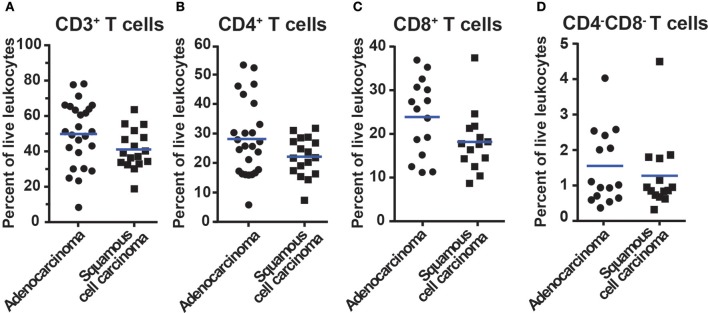
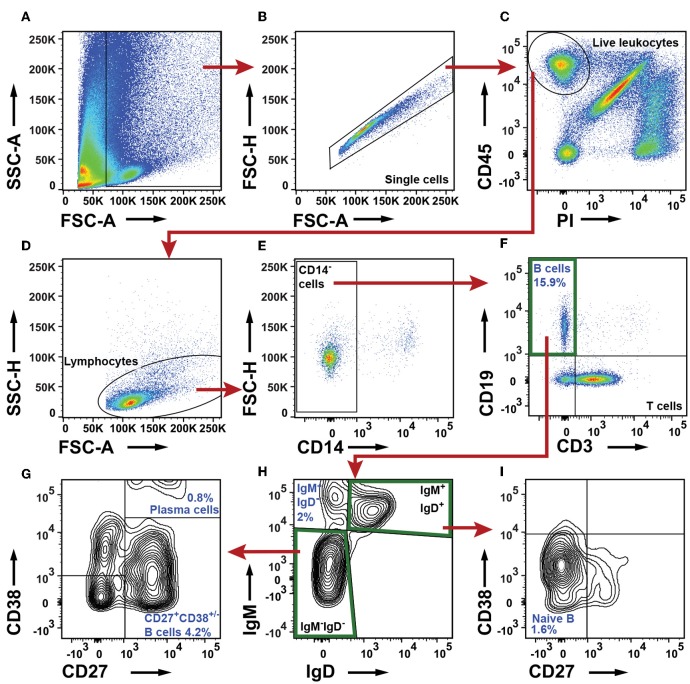
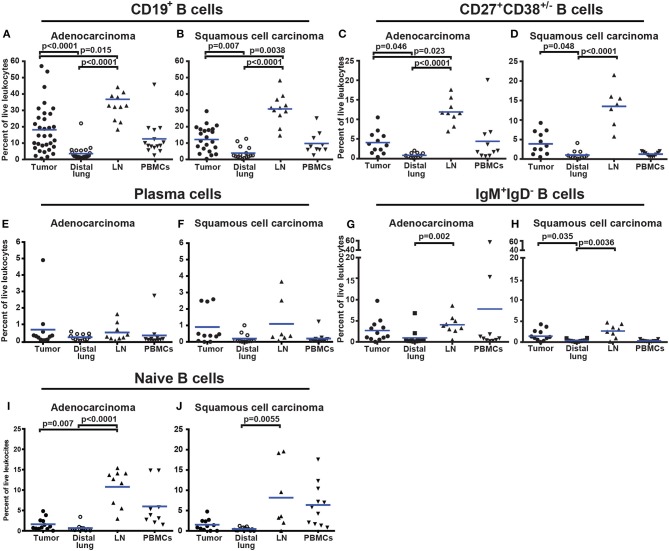
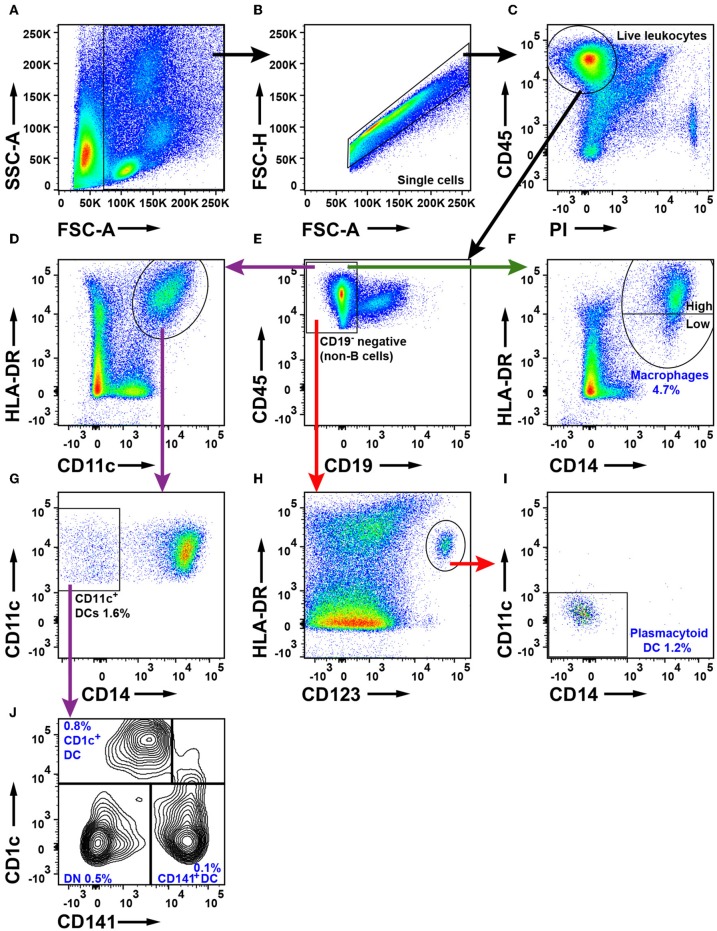
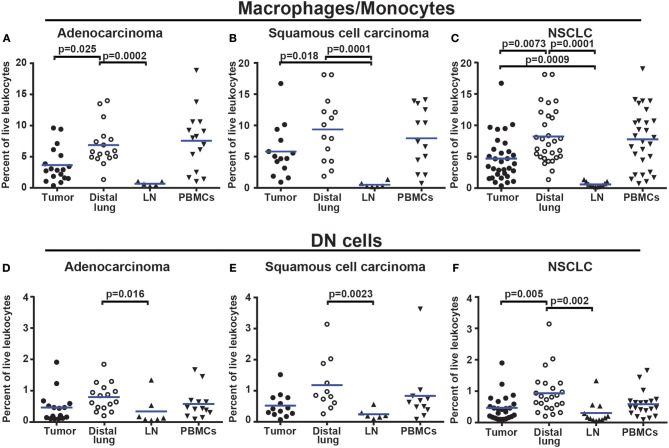
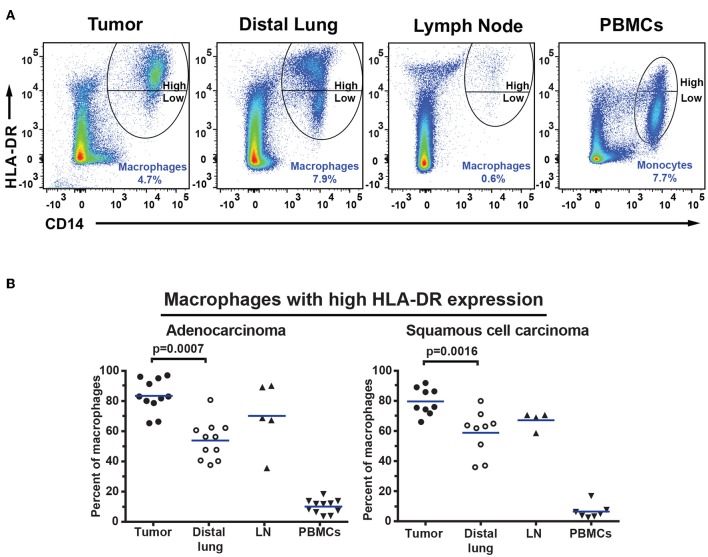
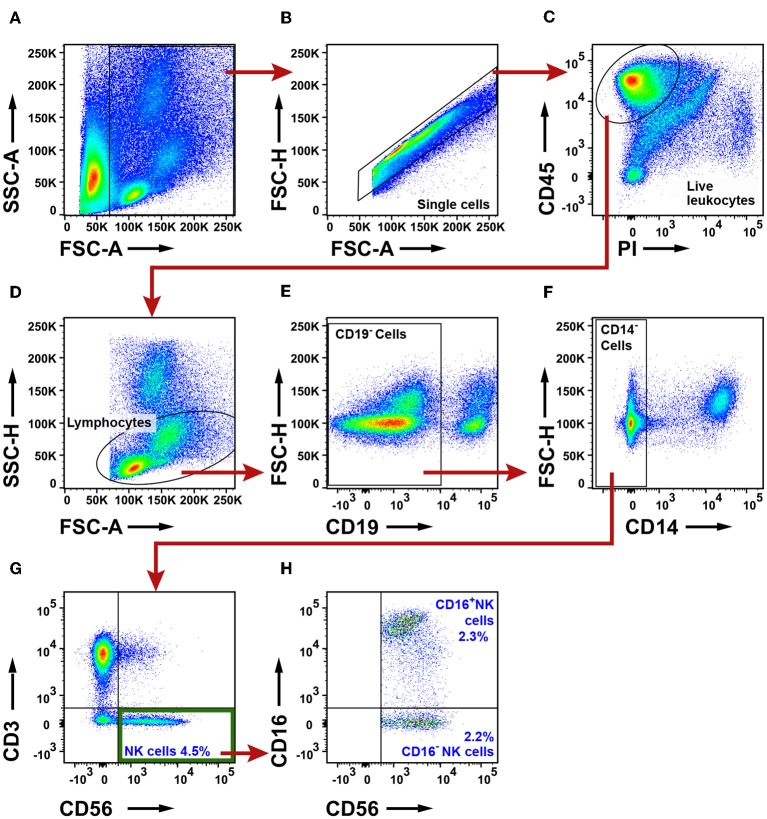
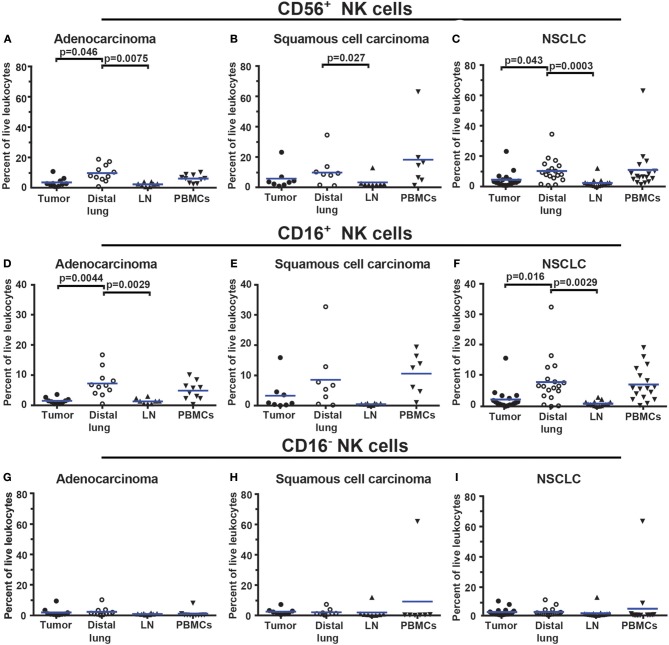
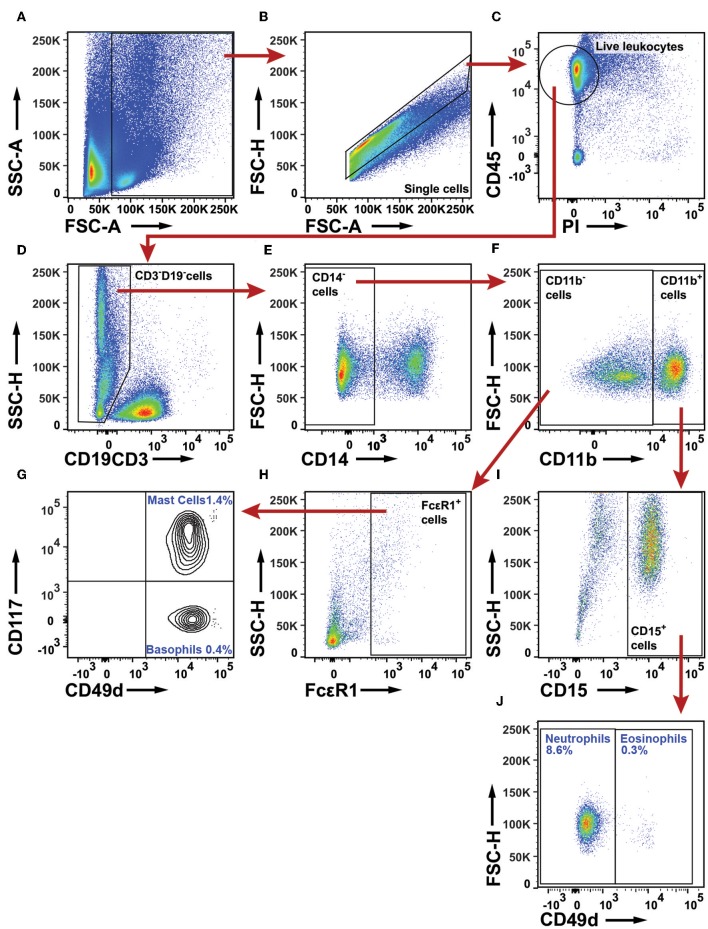
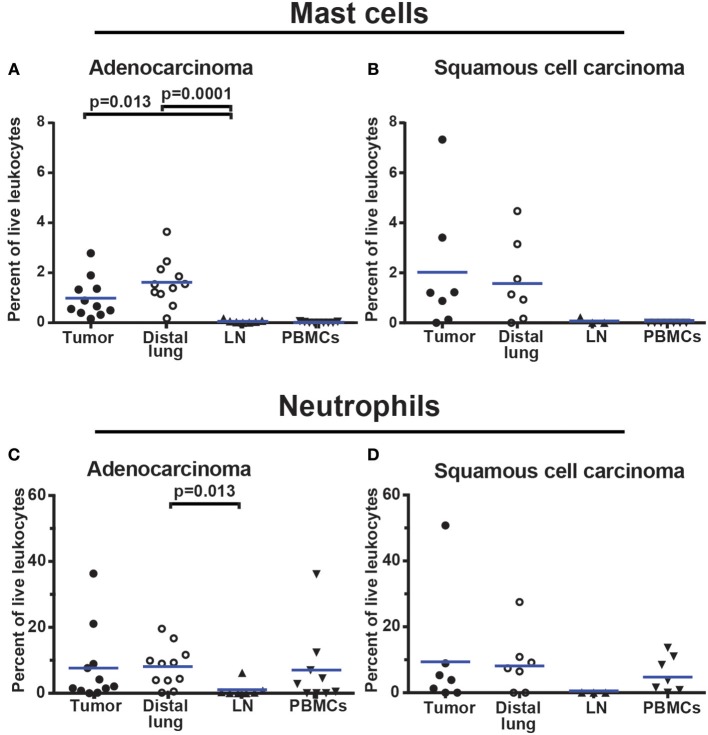
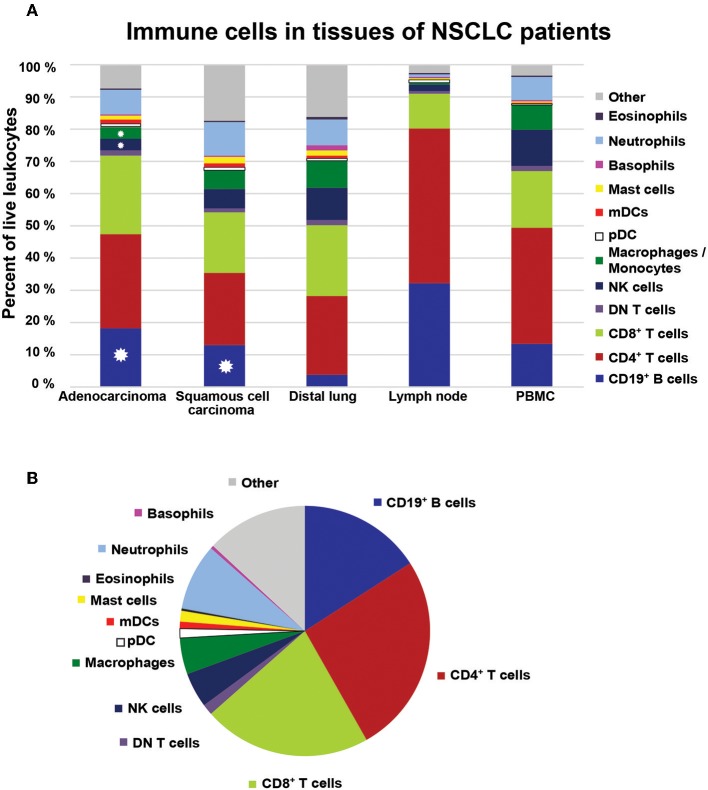
Non-small cell lung cancer (NSCLC) is the leading cause of cancer-related death in the world. Immunological analysis of the tumor microenvironment (immunoscore) shows great promise for improved prognosis and prediction of response to immunotherapy. However, the exact immune cell composition in NSCLC remains unclear. Here, we used flow cytometry to characterize the immune infiltrate in NSCLC tumors, non-cancerous lung tissue, regional lymph node, and blood. The cellular identity of >95% of all CD45+ immune cells was determined. Thirteen distinct immune cell types were identified in NSCLC tumors. T cells dominated the lung cancer landscape (on average 47% of all CD45+ immune cells). CD4+ T cells were the most abundant T cell population (26%), closely followed by CD8+ T cells (22%). Double negative CD4-CD8- T cells represented a small fraction (1.4%). CD19+ B cells were the second most common immune cell type in NSCLC tumors (16%), and four different B cell sub-populations were identified. Macrophages and natural killer (NK) cells composed 4.7 and 4.5% of the immune cell infiltrate, respectively. Three types of dendritic cells (DCs) were identified (plasmacytoid DCs, CD1c+ DCs, and CD141+ DCs) which together represented 2.1% of all immune cells. Among granulocytes, neutrophils were frequent (8.6%) with a high patient-to-patient variability, while mast cells (1.4%), basophils (0.4%), and eosinophils (0.3%) were less common. Across the cohort of patients, only B cells showed a significantly higher representation in NSCLC tumors compared to the distal lung. In contrast, the percentages of macrophages and NK cells were lower in tumors than in non-cancerous lung tissue. Furthermore, the fraction of macrophages with high HLA-DR expression levels was higher in NSCLC tumors relative to distal lung tissue. To make the method readily accessible, antibody panels and flow cytometry gating strategy used to identify the various immune cells are described in detail. This work should represent a useful resource for the immunomonitoring of patients with NSCLC.

Keywords: NSCLC; flow cytometry; human lung cancer; immunomonitoring; immunoscore; tumor-infiltrating immune cells.


Figures

Figure 1
Figure 1
NSCLC tumors are infiltrated by various quantities of CD45+ leukocytes. (A–F) Data obtained by flow cytometry analysis of 57 patients, 32 with adenocarcinoma and 25 with squamous cell carcinoma. (A) The size of the events (FSC-A) was used to exclude cellular debris and define all cells. (B) Single cells were identified using FSC-A and FSC-H and doublets were gated out. (C) Live cells are negative for propidium iodide (PI) stain. (D) Live leukocytes were defined as CD45+PI cells. (E) and (F) show leukocytes (CD45+PI) as percent of all live cells identified by flow cytometry of (E) adenocarcinoma and (F) squamous cell carcinoma. Each symbol in the graphs (E,F) represents data from one patient. Statistical calculations were performed with non-parametric Kruskal-Wallis analysis and Dunn's post-test, comparing tumor to distal lung and lymph node (LN). Red dots in graphs (E) and (F) show patient samples also analyzed by immunohistochemistry. (G–J) Immunohistochemistry analysis of tissue sections from tumors of four NSCLC patients. HE staining (blue) and anti-CD45 staining of immune cells (brown) at 100× magnifications. The area shown in the pictures is representative of the inflammation in the tumor as a whole. (G) Adenocarcinoma tumor showing high infiltration of CD45+ cells (91% of all cells in flow cytometry). (H) Squamous cell carcinoma tumor with high infiltration of CD45+ cells (96% of all cells in flow cytometry). (I) Low infiltration of CD45+ cells in squamous cell carcinoma (45% of all cells in flow cytometry). (J) Low infiltration of CD45+ cells in adenocarcinoma tumor (52% of all cells in flow cytometry).
Figure 2
Figure 2
Flow cytometry analysis of T cells in NSCLC tumor tissue. (A) Gate for nucleated cells based on the size and complexity of the event (FCS-A and SSC-A, respectively). (B) Nucleated cells were further plotted in FSC-A and FSC-H to gate single cells and exclude doublets. (C) From the single cell gate, live leukocytes were defined as CD45+PI. (D) A lymphocyte gate was made based on FSC-A and SSC-H. (E) CD19+ B cells were excluded from the lymphocyte population, and the CD19CD3+ population was defined as T cells. (F) T cells were further divided in CD4+, CD8+, and CD4CD8 populations. Each subset was examined for the naive phenotype CD45RA+CD45RO and the effector/memory phenotype CD45RACD45RO+. (G) Naive/memory phenotyping of CD8+ T cells. (H) Naive/memory phenotyping of CD4CD8 T cells. (I) Naive/memory phenotyping of CD4+ T cells. The percentages presented in the figure are average values of all NSCLC patients analyzed for T cells (n = 30; 15 adenocarcinoma, 14 squamous cell carcinoma, one large cell carcinoma). Percentages were calculated from the total number of live leukocytes (CD45+PI population). DN, double negative T cells.
Figure 3
Figure 3
Percentage of T cells in NSCLC tumors of different histological types. Data for adenocarcinoma and squamous cell carcinoma are presented. The gating strategy is described in Figure 2. Percentages of (A) All CD3+ T cells, (B) CD3+CD4+ T cells, (C) CD3+CD8+ T cells, and (D) CD3+CD4CD8 T cells, i.e., double negative T cells. The percentages of T cells were calculated from the total number of live leukocytes (CD45+PI) in the sample. Each symbol represents data for one patient (n = 42; 25 adenocarcinoma, 17 squamous cell carcinoma), and mean values are indicated with blue lines. Statistical calculations were performed with non-parametric Kruskal-Wallis analysis and Dunn's post-test, and no significant differences were observed between the groups.
Figure 4
Figure 4
Flow cytometry analysis of B cell sub-populations in NSCLC tumors. (A) The FSC-A and SSC-A plot was used to identify nucleated cells. (B) In the FSC-A and FSC-H plot single cells were gated and doublets were excluded. (C) Live leukocytes were defined as CD45+PI. (D) A lymphocyte gate was set in a FSC-A and SSC-H plot. (E) CD14+ macrophages were excluded. (F) B cell gate defining all B cells as CD19+ and CD3. (G–I) Determination of B cell sub-populations. (G) Characterization of IgMIgD B cells. Two populations were identified: CD27+CD38++ plasma cells and CD27+CD38+/− cells (H) A IgD/IgM plot was used to identify an IgM+IgD B cell sub-population and to define IgMIgD and IgM+IgD+ gates. (I) Further characterization of IgM+IgD+ B cells: naive B cells are defined as CD27CD38+/−. The percentage numbers presented in the figure are average values of all NSCLC patients analyzed for the indicated B cell sub-populations (n = 23; 12 adenocarcinoma, 11 squamous cell carcinoma). For each patient, the percentages of B cells and their sub-populations were calculated from the total number of live leukocytes.
Figure 5
Figure 5
Percentage of all CD19+ B cells and B-cell sub-populations in different tissues from NSCLC patients. (A,B) Comparison of percentages of CD19+ B cells in patients diagnosed with (A) adenocarcinoma (n = 33) and (B) squamous cell carcinoma (n = 23). (C,D) Percentage of CD27+CD38+/− B cells in tissues of patients diagnosed with (C) adenocarcinoma (n = 12) and (D) squamous cell carcinoma (n = 11). (E) Presence of plasma cells in adenocarcinoma (n = 12) and (F) in squamous cell carcinoma (n = 11). (G) Percentage of IgM+IgD B cells in adenocarcinoma (n = 12) and (H) squamous cell carcinoma (n = 11). (I) Percentage of naïve B cells in adenocarcinoma (n = 12) and (J) squamous cell carcinoma (n = 11). The cells were gated as indicated in Figure 4. Each symbol represents data from one patient as percentage of the total number of live leukocytes (CD45+PI) and blue lines indicate mean values. Statistical analysis was performed using non-parametric Kruskal-Wallis analysis and Dunn's post-test comparing tumor, distal lung, and lymph node (LN).
Figure 6
Figure 6
Flow cytometry analysis of macrophages and DCs in NSCLC tumors. (A) FSC-A and SSC-A were used to gate nucleated cells. (B) FSC-A and FSC-H were used to gate single cells and exclude doublets. (C) Live leukocytes were defined as CD45+PI. (E) Exclusion of CD19+ B cells. (D) Gate for HLA-DR+ and CD11c+ cells. (F) Macrophages were defined as CD14+HLA-DR+ cells. HLA-DR expression on macrophages was considered either high or low as shown in the plot. (G) Myeloid DCs were defined as CD11c+CD14. (H) Plasmacytoid DCs were defined as HLA-DR+CD123+ and also (I) CD11c and CD14. (J) Two subsets of myeloid DCs were identified: CD141+ DCs and CD1c+ DCs. A double negative (DN) population was also observed. The percentages of the cell populations shown in the figure were calculated from the total number of live leukocytes and represent average values from 30 patients (16 adenocarcinoma, 13 squamous cell carcinoma and one large cell carcinoma).
Figure 7
Figure 7
Macrophages and DN myeloid cells are less abundant in NSCLC tumors than in distal lung. (A) Percentages of macrophages/monocytes in adenocarcinoma patients (n = 18), (B) squamous cell carcinoma patients (n = 14), and (C) NSCLC (n = 33). (D) Percentages of DN myeloid cells (presumably DCs and/or macrophages) in adenocarcinoma (n = 16), (E) squamous cell carcinoma (n = 13), and (F) NSCLC (n = 29). Cells were gated as shown in Figure 6. The percentages were calculated from the total number of live leukocytes (CD45+PI). Each symbol represents data from one patient. Mean values are indicated by blue lines. Statistical calculations were performed with non-parametric Kruskal-Wallis analysis and Dunn's post-test comparing tumor, distal lung, and lymph node (LN).
Figure 8
Figure 8
Macrophages in NSCLC tumors express high levels of HLA-DR. (A) Macrophages and monocytes were divided into two populations based on the expression level of HLA-DR on the surface: those with high and those with low HLA-DR expression as indicated. (B) Percentages of macrophages expressing high levels of HLA-DR in patients with adenocarcinoma (n = 11) and squamous cell carcinoma (n = 9). Cells were gated as shown in Figure 6. The percentages were calculated from the total number of macrophages/monocytes defined as CD14+HLA-DR+ cells. Each symbol represents data from one patient. Mean values are indicated by blue lines. Statistical calculations were performed with non-parametric Kruskal-Wallis analysis and Dunn's post-test comparing tumor, distal lung, and lymph node (LN).
Figure 9
Figure 9
Flow cytometry analysis of NK cells in NSCLC tumors. (A) A FSC-A and SSC-A plot was used to identify nucleated cells. (B) Single cells were gated and doublets were excluded. (C) Live leukocytes were defined as CD45+PI cells. (D) A lymphocyte gate was set based on the size and granularity of the cells. (E) CD19+ B cells were excluded. (F) CD14+ macrophages were excluded. (G) NK cells were defined as CD3CD56+. (H) Two NK cell subsets were identified: CD16+ and CD16 NK cells. The percentages of all the populations were calculated from the total number of live leukocytes, and average values from 19 patients are presented (11 adenocarcinoma, eight squamous cell carcinoma).
Figure 10
Figure 10
The percentage of NK cells is lower in NSCLC tumors compared to distal lung. (A–C) Percentages of all CD56+ NK cells in different tissues of patients diagnosed with (A) adenocarcinoma (n = 11), (B) squamous cell carcinoma (n = 8), and (C) NSCLC (n = 19). (D–F) Percentages of CD56+CD16+ NK cells in (D) adenocarcinoma, (E) squamous cell carcinoma and (F) NSCLC. (G–I) Percentages of CD56+CD16 NK cells in (G) adenocarcinoma, (H) squamous cell carcinoma, and (I) NSCLC. The gating strategy is presented in Figure 9. Each symbol represents data from one patient, as percentage of all live leukocytes (CD45+PI). Mean values are indicated with blue lines. Statistical calculations were performed with non-parametric Kruskal-Wallis analysis and Dunn's post-test comparing tumor, distal lung and lymph node (LN).
Figure 11
Figure 11
Flow cytometry analysis of granulocytes in NSCLC tumors. (A) A FSC-A and SSC-A plot was used to identify nucleated cells. (B) Single cells were gated and doublets were excluded. (C) Live leukocytes were defined as CD45+PI cells. (D) CD3+ T cells and CD19+ B cells were excluded. (E) CD14+ macrophages were excluded. (F) CD11b was used to separate granulocytes: CD11b cells include mast cells and basophils, whereas CD11b+ cells include neutrophils and eosinophils. (G) In the population of CD49d+ cells, basophils were distinguished from mast cells by use of CD117. (H) Mast cells and basophils are both defined as FcεR1+ cells. (I) From the CD11b+ leukocyte population, neutrophils and eosinophils were defined as CD15+ cells. (J) In the CD15+ population, neutrophils are CD49d and eosinophils CD49d+. The percentages indicated for each granulocyte population were calculated from the total number of live leukocytes for 18 NSCLC patients (11 adenocarcinoma and seven squamous cell carcinoma).
Figure 12
Figure 12
Granulocyte infiltration in NSCLC tumors. (A,B) Mast cell infiltration in (A) adenocarcinoma (n = 11) and (B) squamous cell carcinoma (n = 7). (C,D) Neutrophil infiltration in (C) adenocarcinoma (n = 11) and (D) squamous cell carcinoma (n = 7). Each symbol represents data from one patient as percentage of all live leukocytes (CD45+PI). The gating strategy is described in Figure 11. Mean values are indicated with blue lines. Statistical calculations were performed with non-parametric Kruskal-Wallis analysis and Dunn's post-test comparing tumor, distal lung, and lymph node (LN).
Figure 13
Figure 13
Immune cell composition in NSCLC. (A) The bar graph shows the immune cell composition in adenocarcinoma, squamous cell carcinoma, distal lung, regional lymph node, and PBMCs in the cohort of NSCLC patients (n = 68). Colors in the bars represent mean values based on data collected for the respective cell populations in the indicated tissue. Distal lung represents pooled data from non-cancerous lung tissue obtained from patients with adenocarcinoma and squamous cell carcinoma. Stars indicate significant differences in percentages of cells between tumor and distal lung calculated by Kruskal-Wallis analysis and Dunn's post-test. (B) The immune cell composition in NSCLC tumors illustrated as a pie chart.

References

    1. Siegel RL, Miller KD, Jemal A. Cancer statistics, 2017. CA Cancer J Clin. (2017) 67:7 10.3322/caac.21387 - DOI - PubMed
    1. Goldstraw P, Ball D, Jett JR, Le Chevalier T, Lim E, Nicholson AG, et al. . Non-small-cell lung cancer. Lancet (2011) 378:1727. 10.1016/S0140-6736(10)62101-0 - DOI - PubMed
    1. Travis WD, Brambilla E, Noguchi M, Nicholson AG, Geisinger K, Yatabe Y, et al. . International Association for the Study of Lung Cancer/American Thoracic Society/European Respiratory Society: international multidisciplinary classification of lung adenocarcinoma: executive summary. Proc Am Thorac Soc. (2011) 8:381. 10.1513/pats.201107-042ST - DOI - PubMed
    1. Chen Z, Fillmore CM, Hammerman PS, Kim CF, Wong K-K. Non-small-cell lung cancers: a heterogeneous set of diseases. Nat Rev Cancer (2014) 14:535. 10.1038/nrc3775 - DOI - PMC - PubMed
    1. Mirsadraee S, Oswal D, Alizadeh Y, Caulo A, van Beek E, Jr. The 7th lung cancer TNM classification and staging system: review of the changes and implications. World J Radiol. (2012) 4:128. 10.4329/wjr.v4.i4.128 - DOI - PMC - PubMed

Publication types

MeSH terms