. 2019 Feb 7:15:14.
doi: 10.1186/s13007-019-0388-x. eCollection 2019.

Bayesian analysis and prediction of hybrid performance

Affiliations

Bayesian analysis and prediction of hybrid performance

Filipe Couto Alves et al. Plant Methods. .

Abstract

Background: The selection of hybrids is an essential step in maize breeding. However, evaluating a large number of hybrids in field trials can be extremely costly. However, genomic models can be used to predict the expected performance of un-tested genotypes. Bayesian models offer a very flexible framework for hybrid prediction. The Bayesian methodology can be used with parametric and semi-parametric assumptions for additive and non-additive effects. Furthermore, samples from the posterior distribution of Bayesian models can be used to estimate the variance due to general and specific combining abilities even in cases where additive and non-additive effects are not mutually orthogonal. Also, the use of Bayesian models for analysis and prediction of hybrid performance has remained fairly limited.

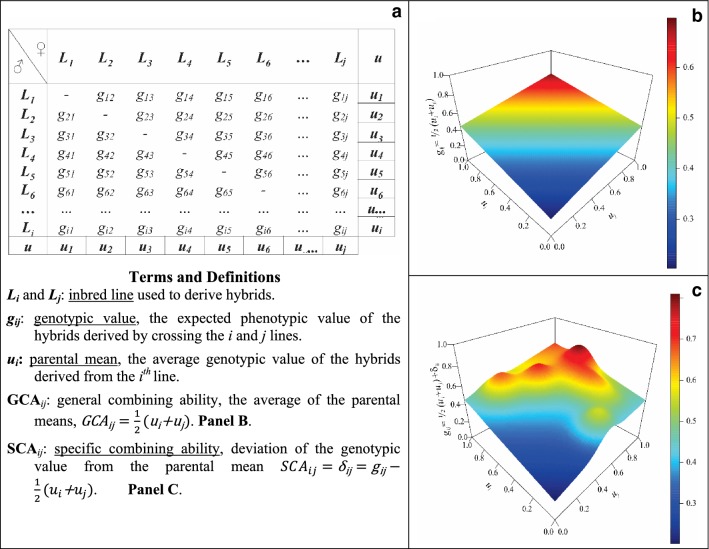
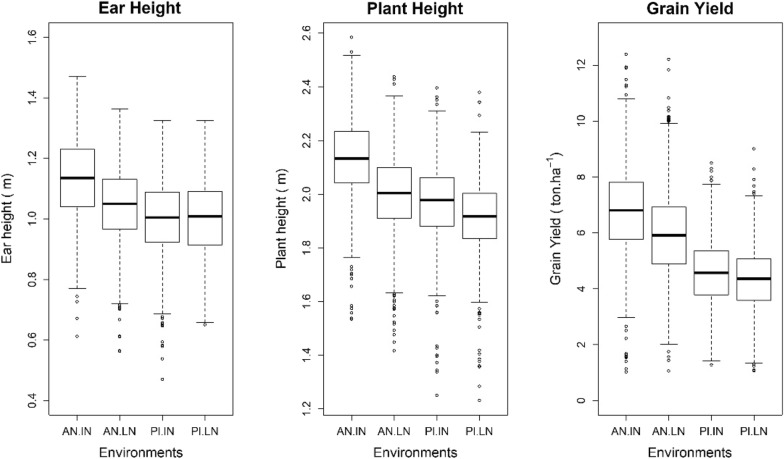
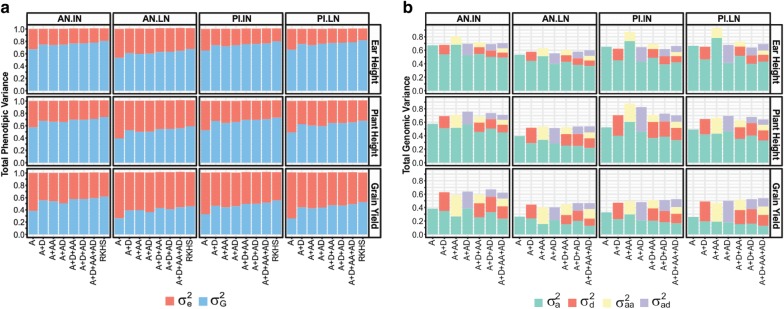
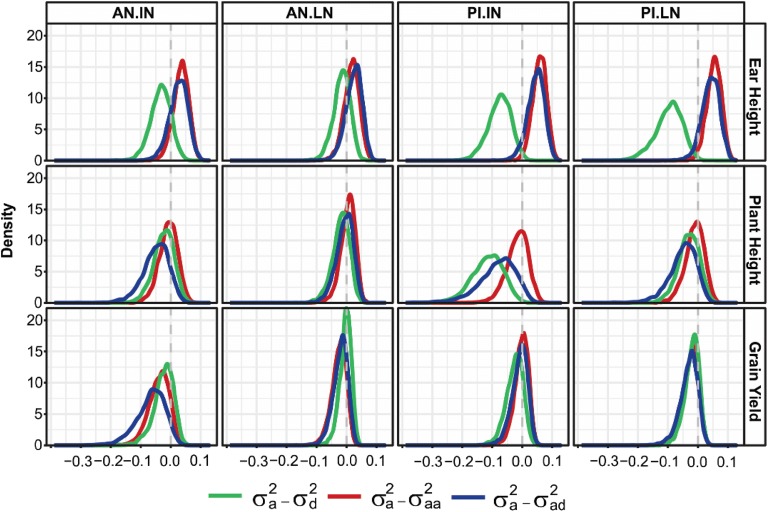
Results: We provided an overview of Bayesian parametric and semi-parametric genomic models for prediction of agronomic traits in maize hybrids and discussed how these models can be used to decompose the genotypic variance into components due to general and specific combining ability. We applied the methodology to data from 906 single cross tropical maize hybrids derived from a convergent population. Our results show that: (1) non-additive effects make a sizable contribution to the genetic variance of grain yield; however, the relative importance of non-additive effects was much smaller for ear and plant height; (2) genomic prediction can achieve relatively high accuracy in predicting phenotypes of un-tested hybrids and in pre-screening.

Conclusions: Genomic prediction can be a useful tool in pre-screening of hybrids and could contribute to the improvement of the efficiency and efficacy of maize hybrids breeding programs. The Bayesian framework offers a great deal of flexibility in modeling hybrid performance. The methodology can be used to estimate important genetic parameters and render predictions of the expected hybrid performance as well measures of uncertainty about such predictions.

Keywords: BGLR; Bayesian models; Convergent populations; Dominance; Epistasis; Genomic prediction; Hybrid prediction; Nitrogen; Non-additive effects; RKHS; Semi-parametric models; Specific combining ability; Stress; Tropical maize.


Figures

Fig. 1
Fig. 1
Prediction of hybrid performance using genomic regression models. a The grid shows all possible crosses between n lines (i=j) in a diallel mating design. b Hyper-plane generated by the general combining abilities of females and males. c Hypothetical hybrid performance surface influenced by both additive and non-additive effects (module)
Fig. 2
Fig. 2
Boxplot of phenotypes by trait and environments. AN.IN: Anhembi ideal nitrogen regime; AN.LN: Anhembi low nitrogen regime; PI.IN: Piracicaba ideal nitrogen regime; PI.LN: Piracicaba low nitrogen regime
Fig. 3
Fig. 3
Variance components (a) and variance parameters (b). a Estimated genetic variance explained by the model (σG2), and estimated error variance (σe2). b Individual variance parameters. AN.IN: Anhembi ideal nitrogen regime; AN.LN: Anhembi low nitrogen regime; PI.IN: Piracicaba ideal nitrogen regime; PI.LN: Piracicaba low nitrogen regime. A: Additive, D: Dominance, AA: Additive × additive, and AD: Additive × dominance effects. RKHS: Reproducing Kernel Hilbert Spaces model). σa2, σd2, σaa2,and σad2, additive, dominance, additive by additive, additive by dominance genetic parameters, respectively
Fig. 4
Fig. 4
Posterior density of the covariance between the additive and non-additive genetic components of models including two genetic terms by environment and traits. AN and PI: Anhembi and Piracicaba. IN and LN: ideal and low nitrogen availability. Covariance between effects in the A + D model is represented in green (σa2σd2); Covariance between effects in the A + AA model is represented in red (σa2σaa2); Covariance between effects in the A + AD model is represented in blue (σa2σad2). AN: Anhembi, PI: Piracicaba, IN: Ideal nitrogen, and LN: Low nitrogen. A: Additive effect, and D: Dominance effects. A: Additive effect, D: Dominance, AA: Additive-additive, and AD: Additive-dominance effects
Fig. 5
Fig. 5
Scatter plot of the predictive accuracies obtained by the A + D model (Additive-dominance) and A (Additive) model by trait at Anhembi with ideal nitrogen availability (AN.IN). Each point represents one TRN-TST partition. The same population partitions were considered across models
Fig. 6
Fig. 6
Heatmaps of genomic estimated genetic/genotypic values of all possible single-crosses at Anhembi with ideal nitrogen (AN.IN). a, b Ear height predicted using the additive and additive-dominance models; (c, d) Grain yield predicted using the additive and additive-dominance models. Lines and columns of each plot were sorted by the mean performance of parental inbred lines at all crosses considering the predicted values from the Additive model
Fig. 7
Fig. 7
Proportion of the top-5% hybrids (according to phenotypic rank) that is identified by pre-screening based on (cross-validation) genomic prediction using the additive + dominance model at a different intensity of selection (x-axis). Each panel corresponds to an evaluated trait, lines within a plot represent different environments. AN: Anhembi; PI: Piracicaba; LN: Low nitrogen; IN: Ideal nitrogen
Fig. 8
Fig. 8
Boxplots of the posterior distribution of expected hybrid performance for the top- and lowest-20 ranked hybrids (left and right, respectively) for grain yield at Anhembi under an optimum nitrogen regime. The colors of the boxes indicate whether the hybrid was phenotyped or not (see legend), the label in the axis indicates the parental lines

References

    1. Longin CFH, Mühleisen J, Maurer HP, Zhang H, Gowda M, Reif JC. Hybrid breeding in autogamous cereals. Theor Appl Genet. 2012;125:1087–1096. doi: 10.1007/s00122-012-1967-7. - DOI - PubMed
    1. Schrag TA, Möhring J, Melchinger AE, Kusterer B, Dhillon BS, Piepho H-P, et al. Prediction of hybrid performance in maize using molecular markers and joint analyses of hybrids and parental inbreds. Theor Appl Genet. 2010;120:451–461. doi: 10.1007/s00122-009-1208-x. - DOI - PubMed
    1. Meuwissen TH, Hayes BJ, Goddard ME. Prediction of total genetic value using genome-wide dense marker maps. Genetics. 2001;157:1819–1829. - PMC - PubMed
    1. Meuwissen T, Hayes B, Goddard M. Accelerating Improvement of Livestock with genomic selection. Annu Rev Anim Biosci. 2013;1:221–237. doi: 10.1146/annurev-animal-031412-103705. - DOI - PubMed
    1. Hayes BJ, Bowman PJ, Chamberlain AJ, Goddard ME. Invited review: genomic selection in dairy cattle: progress and challenges. J Dairy Sci. 2009;92:433–443. doi: 10.3168/jds.2008-1646. - DOI - PubMed