. 2018 Dec 5;10(1):66-82.
doi: 10.1364/BOE.10.000066. eCollection 2019 Jan 1.

Cellular-scale evaluation of induced photoreceptor degeneration in the living primate eye

Affiliations

Cellular-scale evaluation of induced photoreceptor degeneration in the living primate eye

Sarah Walters et al. Biomed Opt Express. .

Abstract

Progress is needed in developing animal models of photoreceptor degeneration and evaluating such models with longitudinal, noninvasive techniques. We employ confocal scanning laser ophthalmoscopy, optical coherence tomography (OCT) and high-resolution retinal imaging to noninvasively observe the retina of non-human primates with induced photoreceptor degeneration. Photoreceptors were imaged at the single-cell scale in three modalities of adaptive optics scanning light ophthalmoscopy: traditional confocal reflectance, indicative of waveguiding; a non-confocal offset aperture technique visualizing scattered light; and two-photon excited fluorescence, the time-varying signal of which, at 730 nm excitation, is representative of visual cycle function. Assessment of photoreceptor structure and function using these imaging modalities revealed a reduction in retinoid production in cone photoreceptor outer segments while inner segments appeared to remain present. Histology of one retina confirmed loss of outer segments and the presence of intact inner segments. This unique combination of imaging modalities can provide essential, clinically-relevant information on both the structural integrity and function of photoreceptors to not only validate models of photoreceptor degeneration but potentially evaluate the efficacy of future cell and gene-based therapies for vision restoration.


Conflict of interest statement

DRW: University of Rochester (P).

Figures

Fig. 1
Fig. 1
AOSLO detection channel configurations for (a) confocal reflectance and (b) multioffset, where the pinhole and PMT are displaced from the confocal position.
Fig. 2
Fig. 2
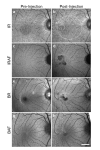
cSLO images of M1 prior to (a,c,e,g) and 28 weeks after (b,d,f,h) subretinal injection of virus in four modalities: IR (a,b); IRAF (c,d); BR (e,f); BAF (g,h). In (b), white arrow denotes injection site, and white dashed circle the extent of the bleb. Scale bar: 1 mm.
Fig. 3
Fig. 3
cSLO (a,c) and corresponding OCT (b,d) of affected regions within the bleb for monkey M1 (a,b) and M2 (c,d). The dotted white line in cSLO images is indicative of the position of the OCT B-scans. White arrows mark positions of disruption in both the cSLO images and corresponding OCT B-scans. Scale bar: horizontal, 200 μm; vertical, 100 μm.
Fig. 4
Fig. 4
AOSLO imaging of affected regions within the bleb of three monkeys. Images of the same location in three modalities are presented: 730 nm confocal reflectance (a,d,g), TPEF (b,e,h), and multioffset (c,f,i). Scale bar: 50 μm.
Fig. 5
Fig. 5
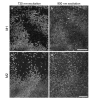
TPEF imaging of affected regions in two monkeys at different excitation wavelengths. Images of the same location in each monkey are presented at 730 nm excitation (a, c) and 900 nm excitation (b, d). Scale bars: 50 μm.
Fig. 6
Fig. 6
AOSLO imaging of an affected region on the inferotemporal edge of the bleb in monkey M4, in three modalities: 730 nm confocal reflectance (a), TPEF (b), and multioffset (c). The orange arrow denotes a cone photoreceptor that appears to be waveguiding (a), is bright in TPEF (b), and has low contrast in multioffset (c). The blue arrow denotes a cone photoreceptor that appears dark in reflectance (a) and TPEF (b), but has high contrast in multioffset (c). The white arrow denotes a rod that is bright in reflectance (a) and TPEF (b), but could not be visualized in multioffset (c). Scale bar: 50 μm.
Fig. 7
Fig. 7
The time course of TPEF for M2 in the same location as Fig. 4(d)-(f). Image segmentation is shown in (a), with the blue rectangle encompassing a normal region and the orange rectangle encompassing an affected region. Areas outlined in yellow are excluded from the affected region, and are plotted separately in their corresponding color in (b). Data points in (b) represent approximately 0.8 seconds of binned data of each of the regions in (a), with error bars representing standard error of the mean. Plotted lines in (b) are exponential fits to the data. Scale bar, 50 μm.
Fig. 8
Fig. 8
Two histological sections (b and c) through an affected region in monkey M1, horizontally aligned to TPEF imaging at 730 nm excitation (a). Here, lines A and B denote angle of each histological section with respect to the en face imaging. ONL, outer nuclear layer; Ch, choroid. Scale bar, 50 μm.

References

    1. von Helmholtz H., Beschreibung eines Augen-Spiegels zur Untersuchung der Netzhaut im lebenden Auge (A Förstner'sche Verlagsbuchhandlung, Berlin, Germany, 1851).
    1. Liang J., Williams D. R., Miller D. T., “Supernormal vision and high-resolution retinal imaging through adaptive optics,” J. Opt. Soc. Am. A 14(11), 2884–2892 (1997).10.1364/JOSAA.14.002884 - DOI - PubMed
    1. Roorda A., Romero-Borja F., Donnelly Iii W., Queener H., Hebert T., Campbell M., “Adaptive optics scanning laser ophthalmoscopy,” Opt. Express 10(9), 405–412 (2002).10.1364/OE.10.000405 - DOI - PubMed
    1. Huang D., Swanson E. A., Lin C. P., Schuman J. S., Stinson W. G., Chang W., Hee M. R., Flotte T., Gregory K., Puliafito C. A., et, “Optical coherence tomography,” Science 254(5035), 1178–1181 (1991).10.1126/science.1957169 - DOI - PMC - PubMed
    1. Swanson E. A., Izatt J. A., Hee M. R., Huang D., Lin C. P., Schuman J. S., Puliafito C. A., Fujimoto J. G., “In vivo retinal imaging by optical coherence tomography,” Opt. Lett. 18(21), 1864–1866 (1993).10.1364/OL.18.001864 - DOI - PubMed

LinkOut - more resources