. 2018 Dec 11;10(1):137-150.
doi: 10.1364/BOE.10.000137. eCollection 2019 Jan 1.

Integrated multimodal photoacoustic microscopy with OCT- guided dynamic focusing

Affiliations

Integrated multimodal photoacoustic microscopy with OCT- guided dynamic focusing

Arash Dadkhah et al. Biomed Opt Express. .

Abstract

Combining different contrast mechanisms to achieve simultaneous multimodal imaging is always desirable but is challenging due to the various optical and hardware requirements for different imaging systems. We developed a multimodal microscopic optical imaging system with the capability of providing comprehensive structural, functional and molecular information of living tissues. This imaging system integrated photoacoustic microscopy (PAM), optical coherence tomography (OCT), optical Doppler tomography (ODT) and confocal fluorescence microscopy in one platform. By taking advantage of the depth resolving capability of OCT, we developed a novel OCT-guided surface contour scanning methodology for dynamic focusing adjustment. We have conducted phantom, in vivo, and ex vivo tests to demonstrate the capability of the multimodal imaging system for providing comprehensive microscopic information of biological tissues. Integrating all the aforementioned imaging modalities with OCT-guided dynamic focusing for simultaneous multimodal imaging has promising potential for preclinical research and clinical practice in the future.


Conflict of interest statement

The authors declare that there are no conflicts of interest related to this article.

Figures

Fig. 1
Fig. 1
Schematic of the integrated PAM/OCT/ODT/CFM experimental system. SLD: Superluminescent diode; FC: 2 × 2 Fiber coupler; PC: Polarization controller; L1, L2, L3, L4: Lens; M1, M2, M3: Mirror; DM1, DM2: Dichroic mirror; C1, C2, C3: Collimator; ND: Neutral density filter; F1, F2, F3: Optical filter; PBS: Pellicle beam splitter; PD: Photodiode.
Fig. 2
Fig. 2
Measured optical spectrum of the pulsed laser before and after the single-mode optical fibers. (a) laser spectrum before the optical fiber; (b) laser spectrum exiting a 4.5 m long single-mode optical fiber; (c) laser spectrum exiting a 0.5 m long single-mode optical fiber. The intensity readings are normalized.
Fig. 3
Fig. 3
Phantom test of OCT-guided dynamic focusing using surface contour scanning. (a) OCT B-scan at the location marked in panel (e) as a yellow line; (b) OCT B-scan of the angled plate; (c) and (d) Simultaneously acquired PAM and CFM images without dynamic focusing; (e) and (f) Simultaneously acquired PAM and CFM images with dynamic focusing; (g) PA signal intensity along the line at the location marked in panel (c) and (e) as a red and blue line without and with dynamic focusing, respectively; (h) FL (fluorescence) signal intensity along the line at the location marked in panel (d) and (f) as a red and blue line without and with dynamic focusing, respectively; bar: 100μm.
Fig. 4
Fig. 4
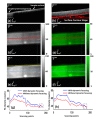
Multimodal imaging of a human eye ex vivo using OCT-guided dynamic focusing. (a) and (b) Simultaneously acquired PAM and CFM images without dynamic focusing; (c) and (d) Simultaneously acquired PAM and CFM images with dynamic focusing; (e) OCT B-scan at the location marked in panel (a) by the yellow solid line (displayed dynamic range, 55 dB); (f) PA signal intensity along the line at the location marked in panel (a) and (c) as a red and blue line without and with dynamic focusing, respectively; (g) FL (fluorescence) signal intensity along the line at the location marked in panel (b) and (d) as a red and blue line without and with dynamic focusing, respectively; RPE: Retinal Pigment Epithelium; SL: Sclera; bar, 500 μm.
Fig. 5
Fig. 5
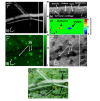
Simultaneously acquired PAM, CFM, OCT and ODT images of a mouse ear with dynamic focusing. (a) PA image (average contrast-to-noise ratio 50 dB); (b) OCT B-scan at the location marked in panel (e) by the solid line (displayed dynamic range, 45 dB); (c) ODT B-scan at the location marked in panel (e) by the solid line; (d) CFM image (average contrast-to-noise ratio 30 dB); (e) OCT 2D projection images generated from the acquired 3D OCT data sets; (f) Fused 2D image of simultaneously acquired PAM, CFM and OCT images; SG: Sebaceous glands; bar, 100μm.

Similar articles

Cited by

References

    1. Huang D., Swanson E. A., Lin C. P., Schuman J. S., Stinson W. G., Chang W., Hee M. R., Flotte T., Gregory K., Puliafito C. A., et al. ., “Optical coherence tomography,” Science 254(5035), 1178–1181 (1991).10.1126/science.1957169 - DOI - PMC - PubMed
    1. Wojtkowski M., Srinivasan V., Ko T., Fujimoto J., Kowalczyk A., Duker J., “Ultrahigh-resolution, high-speed, Fourier domain optical coherence tomography and methods for dispersion compensation,” Opt. Express 12(11), 2404–2422 (2004).10.1364/OPEX.12.002404 - DOI - PubMed
    1. De Venecia G., Davis M., Engerman R., “Clinicopathologic correlations in diabetic retinopathy. I. Histology and fluorescein angiography of microaneurysms,” Arch. Ophthalmol. 94(10), 1766–1773 (1976).10.1001/archopht.1976.03910040540013 - DOI - PubMed
    1. Földes-Papp Z., Demel U., Tilz G. P., “Laser scanning confocal fluorescence microscopy: an overview,” Int. Immunopharmacol. 3(13-14), 1715–1729 (2003).10.1016/S1567-5769(03)00140-1 - DOI - PubMed
    1. Holz F. G., Bellmann C., Rohrschneider K., Burk R. O., Völcker H. E., “Simultaneous confocal scanning laser fluorescein and indocyanine green angiography,” Am. J. Ophthalmol. 125(2), 227–236 (1998).10.1016/S0002-9394(99)80095-6 - DOI - PubMed

LinkOut - more resources