Multicenter Study
. 2019 Feb 6;5(2):eaat7603.
doi: 10.1126/sciadv.aat7603. eCollection 2019 Feb.

Human consciousness is supported by dynamic complex patterns of brain signal coordination

Affiliations
Multicenter Study

Human consciousness is supported by dynamic complex patterns of brain signal coordination

A Demertzi et al. Sci Adv. .

Abstract

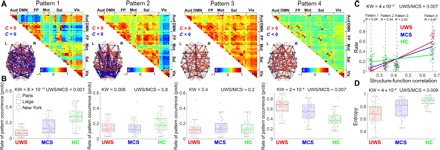
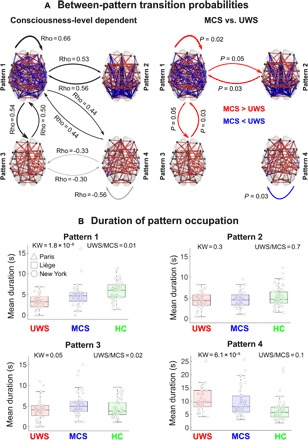
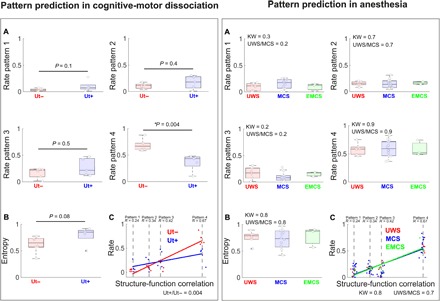
Adopting the framework of brain dynamics as a cornerstone of human consciousness, we determined whether dynamic signal coordination provides specific and generalizable patterns pertaining to conscious and unconscious states after brain damage. A dynamic pattern of coordinated and anticoordinated functional magnetic resonance imaging signals characterized healthy individuals and minimally conscious patients. The brains of unresponsive patients showed primarily a pattern of low interareal phase coherence mainly mediated by structural connectivity, and had smaller chances to transition between patterns. The complex pattern was further corroborated in patients with covert cognition, who could perform neuroimaging mental imagery tasks, validating this pattern's implication in consciousness. Anesthesia increased the probability of the less complex pattern to equal levels, validating its implication in unconsciousness. Our results establish that consciousness rests on the brain's ability to sustain rich brain dynamics and pave the way for determining specific and generalizable fingerprints of conscious and unconscious states.


Figures

Fig. 1
Fig. 1. The interareal coordination of ongoing brain dynamics is differentially orchestrated as a function of the state of consciousness.
(A) Four patterns recurrently emerged from the data-driven analysis of phase-based coherence matrices. The patterns revealed diverse interareal coordination, from positive/negative long-range coherence (pattern 1), to predominantly occipital coherence (pattern 2), to overall high coherence (pattern 3), and overall low coherence (pattern 4). (B) Patient groups differed with respect to the likelihood of each coordination pattern occurrence. The complex interareal coordination pattern 1 presented a higher probability rate in healthy control participants (HC) and patients in MCS compared to patients in UWS, who predominantly resided in the overall low coordination pattern 4. Patterns 2 and 3 were equally probable across groups, potentially serving a transitional role. For the sake of visualization clarity, the scale in the last panel is different than in the other three. (C) Probability of each pattern’s occurrence as a function of their similarity to the anatomical connectivity matrix. Complex pattern 1 showed low similarity to the anatomical connectivity, while pattern 4 was the most similar to the anatomical connectivity, suggesting that spontaneous neuronal activity during pattern 4 traces fixed structural connections. The slope of occurrence probability versus similarity relationship decreases with the state of consciousness. (D) Patients in UWS presented lower entropy values associated with the patterns’ occurrence probability distribution, suggestive of a less uniform distribution compared to patients in MCS and healthy controls. Notes: (A) The patterns are ordered on the basis of their similarity to the anatomical connectivity, from the least (left) to the most (right) similar. The networks are rendered on the anatomical space (transverse view) and show the top 10% links between ROIs, within the absolute value of phase coherence > 0.2; red/blue edges indicate positive/negative coherence. Aud, auditory; DMN, default mode network; FP, frontoparietal; Mot, motor; Sal, salience; Vis, visual; KW, Kruskal-Wallis test P value; UWS/MCS, Wilcoxon test P value for the comparisons between patients in UWS and patients in MCS. (B) Boxplots represent the medians of the occurrence probabilities with interquartile range and maximum-minimum values (whiskers). (C) Lines are based on the best linear fit for each group; R, Spearman correlation.
Fig. 2
Fig. 2. The exploration of the identified coordination patterns differs with respect to the state of consciousness.
(A) Left: The transition probabilities show an ordinal relationship with the level of consciousness. Black arrows indicate a higher probability to transit between the coordination patterns in healthy controls (HC) as opposed to patients in MCS and patients in UWS (HC > MCS > UWS). Gray arrows indicate the opposite trend (HC < MCS < UWS). Right: Patients in MCS were more likely to stay in the complex pattern 1 and to transition from this pattern to patterns 2 and 3. On the other hand, unresponsive patients were more likely to stay in the pattern most similar to anatomical constraints (pattern 4). Red arrows indicate higher transitional probabilities for patients in MCS, and blue arrows indicate higher transitional probabilities for unresponsive patients. (B) The clinical groups differ with respect to the contiguous amount of time spent in each pattern (after normalizing using randomly shuffled surrogate time series). The complex pattern 1 was explored during longer consecutive periods by healthy controls and patients in MCS, while patients in UWS spent higher periods of time in the overall low positive coordination pattern 4. Patterns 2 and 3 were explored similarly by all groups, further suggesting a transitional role. Notes: (A) Left: Groups are ranked ordinally from UWS, MCS, and HC (Rho: Spearman rank correlation). Right: P, Wilcoxon rank-sum test, false discovery rate corrected. (B) Boxplots represent the medians of mean pattern duration (in seconds) with interquartile range and maximum-minimum values (whiskers); Rho, Spearman rank correlation; UWS/MCS, Wilcoxon test P value for the comparisons between patients in UWS and patients in MCS.
Fig. 3
Fig. 3. The coordination patterns generalize to other states of preserved and diminished consciousness.
(A) Left: Typical unresponsive patients who did not show command following in mental imagery tasks (Ut−) presented a higher probability of residing in the overall low coordination pattern 4. Conversely, behaviorally unresponsive patients who nevertheless successfully followed commands in mental imagery tasks (Ut+) showed significantly lower probabilities for the same pattern. (B) The sequence of pattern occurrences was more uniformly distributed in the Ut+ group as determined by higher entropy values. (C) The probability of each pattern’s occurrence in Ut+ patients was less dependent on the similarity with the anatomical connectivity, supporting the idea that the dynamic coordination could not be entirely accounted for in terms of structural connections, but rather represented emergent functional processes. (A) Right: Under anesthesia, the complex coordination pattern 1 uniformly became less prevalent across unresponsive patients (UWS), patients in MCS, and conscious patients who have emerged from the MCS (EMCS); in other words, it was reduced independently of the clinical diagnosis. Conversely, the overall low-coordination pattern 4 became uniformly the most prevalent in all anesthetized patients, irrespective of clinical diagnosis, supporting the specificity of this dynamic configuration to unconsciousness. (B) Similar entropy values across all patients validated the hypothesis that propofol homogeneously abolished conscious awareness. (C) Under anesthesia, all clinical groups presented a stronger relationship (i.e., higher slope) between the patterns’ probabilities and the structure-function correlation in comparison to conscious individuals (fig. S10), indicating that brain dynamics largely reflected activity constrained by fixed anatomical pathways. Notes: (C) The patterns are ordered on the basis of their similarity to anatomical connectivity, from the least (left) to the most (right) similar. Boxplots represent medians with interquartile range and maximum-minimum values (whiskers); Rho: Spearman rank correlation between rate and group; UWS/MCS, Wilcoxon test P value for the comparisons between patients in UWS and patients in MCS. Ut+, nonbehavioral MCS/cognitive-motor dissociation; Ut−, unresponsive patients who do not show command following on mental imagery tasks.

References

    1. Storm J. F., Boly M., Casali A. G., Massimini M., Olcese U., Pennartz C. M. A., Wilke M., Consciousness regained: Disentangling mechanisms, brain systems, and behavioral responses. J. Neurosci. 37, 10882–10893 (2017). - PMC - PubMed
    1. Stern P., Neuroscience: In search of new concepts. Science 358, 464–465 (2017). - PubMed
    1. Tononi G., Consciousness as integrated information: A provisional manifesto. Biol. Bull. 215, 216–242 (2008). - PubMed
    1. Northoff G., Huang Z., How do the brain’s time and space mediate consciousness and its different dimensions? Temporo-spatial theory of consciousness (TTC). Neurosci. Biobehav. Rev. 80, 630–645 (2017). - PubMed
    1. Dehaene S., Changeux J.-P., Experimental and theoretical approaches to conscious processing. Neuron 70, 200–227 (2011). - PubMed

Publication types