. 2019 Feb 6;5(2):eaav5590.
doi: 10.1126/sciadv.aav5590. eCollection 2019 Feb.

Inhibition of histone methyltransferase DOT1L silences ERα gene and blocks proliferation of antiestrogen-resistant breast cancer cells

Affiliations

Inhibition of histone methyltransferase DOT1L silences ERα gene and blocks proliferation of antiestrogen-resistant breast cancer cells

Giovanni Nassa et al. Sci Adv. .

Abstract

Breast cancer (BC) resistance to endocrine therapy results from constitutively active or aberrant estrogen receptor α (ERα) signaling, and ways to block ERα pathway in these tumors are sought after. We identified the H3K79 methyltransferase DOT1L as a novel cofactor of ERα in BC cell chromatin, where the two proteins colocalize to regulate estrogen target gene transcription. DOT1L blockade reduces proliferation of hormone-responsive BC cells in vivo and in vitro, consequent to cell cycle arrest and apoptotic cell death, with widespread effects on ER-dependent gene transcription, including ERα and FOXA1 gene silencing. Antiestrogen-resistant BC cells respond to DOT1L inhibition also in mouse xenografts, with reduction in ERα levels, H3K79 methylation, and tumor growth. These results indicate that DOT1L is an exploitable epigenetic target for treatment of endocrine therapy-resistant ERα-positive BCs.


Figures
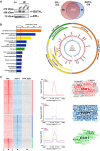
Fig. 1
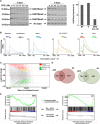
Fig. 1. Functional analysis and physical mapping of DOT1L association with ERα in MCF-7 cell chromatin.
(A) Left: ChIP–Western blot showing DOT1L/ERα corecruitment on chromatin. Right: Venn diagram summarizing results relative to identification of a set of proteins co-associated with ERα and/or DOT1L on chromatin. (B) Functional enrichment analysis (left) by IPA of the protein set co-associated to both ERα and DOT1L on chromatin. In orange, yellow, and green are shown those functions where both ERα and DOT1L participate. MS-ARC (right) showing chromatin proteins co-associated with both ERα and DOT1L, clustered according to molecular functions. The ARC length is inversely proportional to Benjamini-Hochberg (B-H) corrected P value. Inner arches represent functional subcategories, and their overlap reveals proteins involved in different functional subcategories. Protein bar lengths indicate signal intensity within the ERα (red) and DOT1L (blue) datasets. (C) Left: Heat map showing read density around the 10-kb regions centered on each ERα (left) or DOT1L (center) binding sites in MCF-7 cells, with respect to control [CTRL; immunoglobulin G (IgG)]. Binding sites are clustered in the following three regions: ERα-only (red bar), DOT1L-only (blue bar), and ERα + DOT1L binding sites (green bar). Middle: Mean read densities within and around ERα-only (top), DOT1L-only (middle), and ERα-DOT1L colocalized binding sites (bottom). Right: Word cloud showing overrepresented transcription factor binding motifs within ERα-only (red, top), DOT1L-only (blue, middle), and ERα + DOT1L (green, bottom) binding sites, respectively.
Fig. 2
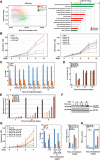
Fig. 2. DOT1L inhibition affects ERα-dependent gene transcription in MCF-7 cells.
(A) Left: Immunoblot analysis of global H3K79me1, H3K79me2, and H3K79me3 levels in MCF-7 cells following 3 or 6 days of treatment with EPZ at the indicated concentrations. V indicates vehicle alone [dimethyl sulfoxide (DMSO), control]. Total H3 was also detected as loading control. Right: In vivo detection of H3K79me2 levels in MCF-7 cells before and after DOT1L pharmacological inhibition with EPZ (4 days). Not treated (NT) and vehicle (V) were used as controls. (B) ChIP-seq signal graphs tracking H3K79me2 occupancy on transcription units (TUs) without (DMSO, V) and with treatment with EPZ (6.4 μM) for 6 days. From left to right, H3K79me2 profiles in all expressed versus all not expressed TUs known, TUs harboring DOT1L alone (DOT1L+) or ERα + DOT1L (ERα+ and DOT1L+), and activated (Up) or silenced (Down) by ERα blockade with ICI, corresponding to estrogen-repressed and estrogen-activated genes, respectively. (C) MA plot showing transcription rate changes [fold change (FC)], measured by nascent-seq, following 6 days of treatment with EPZ (6.4 μM). (D) Venn diagram showing the number of RNAs whose transcription rate is affected following 3 and 6 days of treatment with either 100 nM ICI or 6.4 μM EPZ. (E) Gene set enrichment analysis (GSEA) analysis of EPZ- and ICI-induced transcription rate changes in transcripts harboring ERα + DOT1L binding sites. A pronounced co-occupancy was observed in both cases proximity of down-regulated transcripts.
Fig. 3
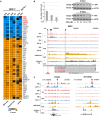
Fig. 3. Pharmacological inhibition of DOT1L affects gene expression and key cellular functions, including proliferation and survival, in MCF-7 cells.
(A) Left: MA plot showing transcriptome changes, measured by RNA sequencing (RNA-seq), following 6 days of treatment with 6.4 μM EPZ. Right: Bar chart, obtained from KEGG functional enrichment analysis, showing statistically significant deregulated pathways. Green, red, and gray colors represent inhibited, activated, and unaffected signaling pathways, respectively. (B) MCF-7 cell proliferation rate in the presence of estrogen (17β-estradiol, E2), the indicated antiestrogens, or increasing concentrations of EPZ, assessed by MTT assays in exponentially growing conditions. Vehicles (EtOH or DMSO) were used as controls. (C and D) Cell cycle phase distribution in exponentially growing MCF-7 cell cultures before (−) and after treatment with the indicated concentrations of ICI or EPZ for 3 to 9 days. Percentages of G1, S, and G2/M (C), and sub-G1 (D) phase cells were determined by flow cytometry after propidium iodide (PI) staining. (E) Bar chart showing accumulation of annexin V–fluorescein isothiocyanate (FITC)/PI–positive cells following treatment with the indicated concentrations of either ICI or EPZ for 3, 6, and 9 days. For (B) to (E), the results shown represent the means ± SD of multiple determinations from a representative experiment performed in octuplicate (B) or triplicate (C to E). (F) Western blot showing the extent of activated caspase-3 (CASP3) accumulation after 3, 6, or 9 days of treatment with EPZ (+, 6.4 μM) or vehicle (V, DMSO) in MCF-7 cells. β-Actin (ACTB) was used as loading control. (G) Left: MCF-7 cell proliferation rate in the presence of estrogen only (17β-estradiol, E2), the indicated antiestrogens, or increasing concentrations of EPZ with E2 coadministration, assessed by MTT assays in hormone-starved cells. Vehicle (EtOH) was used as control. Middle and right: Cell cycle phase distribution in hormone-deprived MCF-7 cell cultures before (−), after E2 only, or treatment with the indicated concentrations of ICI or EPZ for 6 days together with E2. Percentages of G1, S, and G2/M (middle), and sub-G1 (right) phase cells were determined by flow cytometry after PI staining. Results shown represent the means ± SD of multiple determinations from a representative experiment performed at least in triplicate. (H) ERα transactivating activity in MCF-7 cells stably expressing the ERE-Luc reporter gene (MELN), before and after E2 stimulation, in the presence of either vehicle only (V) or the indicated concentrations of ICI or EPZ. Results shown represent the means ± SD of multiple determinations from a representative experiment performed in triplicate. OD, optical density.
Fig. 4
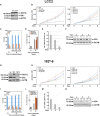
Fig. 4. ER-DOT1L interaction is required for ERα expression and signaling.
(A) Heat map showing results of Upstream Regulator analysis by IPA (activation Z score values) in MCF-7 or ZR-75.1 cells, performed on RNA-seq, nascent-seq, or microarray gene expression profiling data from cells treated with EPZ (6.4 μM), TAM (100 nM), or ICI (100 nM). The effects (down-regulation) on ERα (ESR1) and three ERα functional partners, key regulators of estrogen-mediated transcriptional regulation, are highlighted in red. (B) Top: Reverse transcription quantitative real-time polymerase chain reaction (RT-qPCR) (left) and immunoblot analysis (right) showing ERα mRNA and protein levels following cell treatment with the indicated concentrations of EPZ. Treatment with vehicle alone (V, DMSO) was used as control. RT-qPCR results are shown as means ± SD of multiple determinations from a representative experiment. β-Actin (ACTB) was used as loading control for immunoblots. Bottom: Screenshot of ESR1 locus, depicting ERα (red) and DOT1L (blue) ChIP-seq signals before and after EPZ (6.4 μM) for 6 days or ICI (100 nM) for 3 days, together with H3K79me2 ChIP-seq (yellow) and nascent-seq (gray) data before and after EPZ. Arrows indicate ERα + DOT1L binding sites, and the red/blue strips highlight relevant enhancer and the promoter regions. The ESR1 isoform reported in red resulted in the most abundant one from RNA-seq experiments. (C) Screenshots of FOXA1 and TFF1/PS2 loci showing ERα, DOT1L, and H3K79me2 ChIP-seq data following the same scheme described above.
Fig. 5
Fig. 5. DOT1L blockade inhibits SERM- and SERD-resistant BC cell proliferation.
(A and G) Western blots showing ERα and DOT1L protein levels in SERM (TAM)–resistant LCC2 and SERD (ICI 182,780)–resistant MCF-7/182R-6 cells, compared with the same in antiestrogen-sensitive (wt and S05) MCF-7 cells. (B and H) Cell proliferation rate in the presence of estrogen (17β-estradiol, E2) and the indicated antiestrogens (left) or increasing concentrations of EPZ (right) in exponentially growing cells, assessed by MTT assay. Vehicles (EtOH or DMSO) were used as controls. Results shown are the means ± SD of octuplicate determinations from a representative experiment. (C and D and I to L) Cell cycle phase distribution in cell cultures before (−) and after treatment with the indicated concentrations of ICI, TAM, or EPZ for 9 days. Percentages of G1, S, and G2/M (C and I), and sub-G1 (D and L) phase cells were determined by flow cytometry after PI staining. (E, F, M, and N) RT-qPCR (left) and immunoblot analysis (right) showing ERα mRNA and protein levels following cell treatment with EPZ for the indicated times. Treatment with vehicle alone (V, DMSO) was used as control. RT-qPCR results are shown as means ± SD of multiple determinations from a representative experiment. β-Actin (ACTB) was used as loading control for immunoblots.
Fig. 6
Fig. 6. DOT1L pharmacological targeting affects antiestrogen-sensitive and antiestrogen-resistant BC cell tumor progression in vivo.
Top: Mice carrying tumors obtained by orthotopical injections of MCF-7–luciferase (A) or MCF-7/LCC2–luciferase (B) cells in the mammary fat pad were implanted with pumps containing either a solution of EPZ (50 mg/ml) or vehicle (DMSO). Tumor progression was assessed by bioluminescence before (0) and after 2 (W2) and 3 (W3) weeks of treatment. Representative images at 0 and W3 are shown in each case to the left, the average bioluminescence for all mice in the upper-right panels, and the final tumor volumes in the lower-right panels. The P values were calculated using unpaired two-sample t test (*P < 0.05). Bottom: Immunoblot analysis of H3K79me2 and ERα protein levels in tumors derived from animals treated with vehicle alone (DMSO, vehicle) or EPZ for 3 weeks. Total H3 and β-actin were used as loading controls.

References

    1. Tryfonidis K., Zardavas D., Katzenellenbogen B. S., Piccart M., Endocrine treatment in breast cancer: Cure, resistance and beyond. Cancer Treat. Rev. 50, 68–81 (2016). - PubMed
    1. Osborne C. K., Schiff R., Mechanisms of endocrine resistance in breast cancer. Annu. Rev. Med. 62, 233–247 (2011). - PMC - PubMed
    1. Katzenellenbogen J. A., Mayne C. G., Katzenellenbogen B. S., Greene G. L., Chandarlapaty S., Structural underpinnings of oestrogen receptor mutations in endocrine therapy resistance. Nat. Rev. Cancer 18, 377–388 (2018). - PMC - PubMed
    1. Bailey S. D., Desai K., Kron K. J., Mazrooei P., Sinnott-Armstrong N. A., Treloar A. E., Dowar M., Thu K. L., Cescon D. W., Silvester J., Yang S. Y., Wu X., Pezo R. C., Haibe-Kains B., Mak T. W., Bedard P. L., Pugh T. J., Sallari R. C., Lupien M., Noncoding somatic and inherited single-nucleotide variants converge to promote ESR1 expression in breast cancer. Nat. Genet. 48, 1260–1266 (2016). - PMC - PubMed
    1. Razavi P., Chang M. T., Xu G., Bandlamudi C., Ross D. S., Vasan N., Cai Y., Bielski C. M., Donoghue M. T. A., Jonsson P., Penson A., Shen R., Pareja F., Kundra R., Middha S., Cheng M. L., Zehir A., Kandoth C., Patel R., Huberman K., Smyth L. M., Jhaveri K., Modi S., Traina T. A., Dang C., Zhang W., Weigelt B., Li B. T., Ladanyi M., Hyman D. M., Schultz N., Robson M. E., Hudis C., Brogi E., Viale A., Norton L., Dickler M. N., Berger M. F., Iacobuzio-Donahue C. A., Chandarlapaty S., Scaltriti M., Reis-Filho J. S., Solit D. B., Taylor B. S., Baselga J., The genomic landscape of endocrine-resistant advanced breast cancers. Cancer Cell 34, 427–438.e6 (2018). - PMC - PubMed

Publication types

MeSH terms