

Nuclear genetic regulation of the human mitochondrial transcriptome
- PMID: 30775970
- PMCID: PMC6420317
- DOI: 10.7554/eLife.41927
Nuclear genetic regulation of the human mitochondrial transcriptome
Abstract
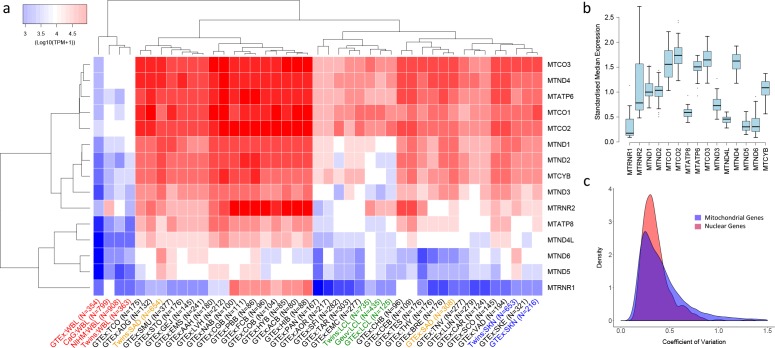
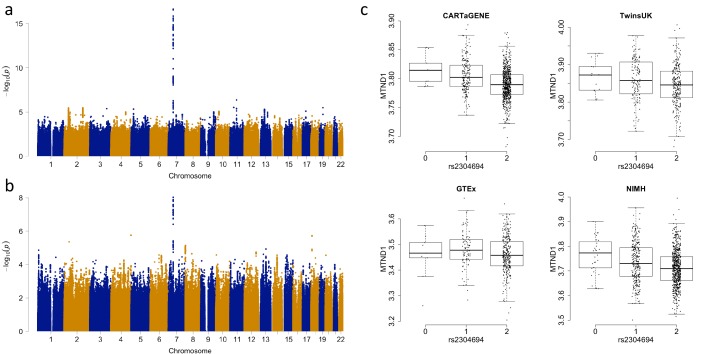
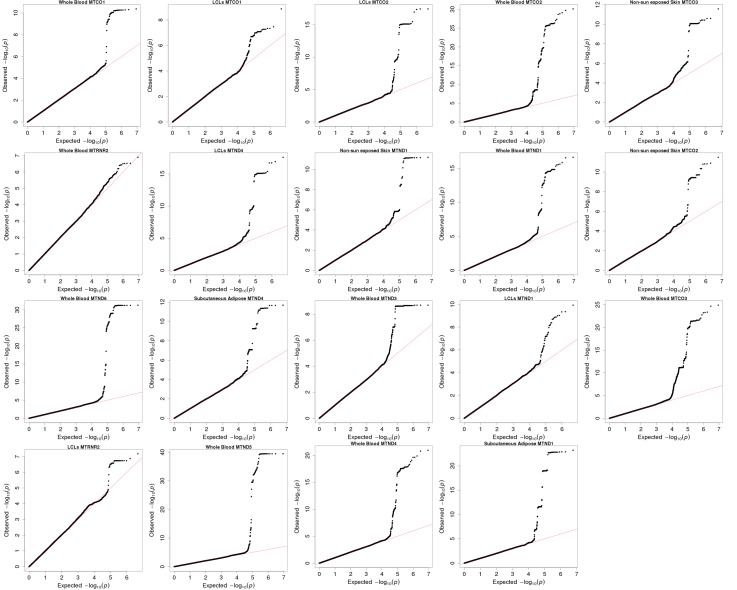
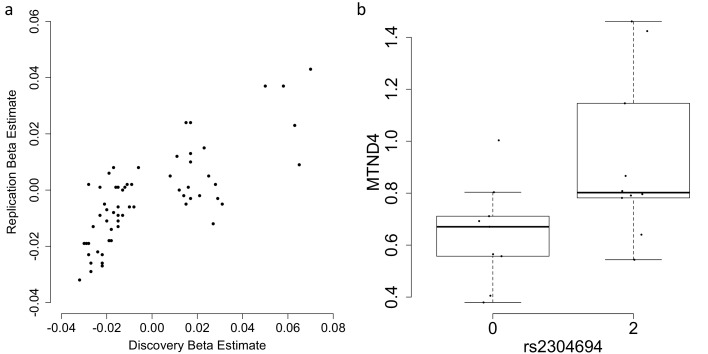
Mitochondria play important roles in cellular processes and disease, yet little is known about how the transcriptional regime of the mitochondrial genome varies across individuals and tissues. By analyzing >11,000 RNA-sequencing libraries across 36 tissue/cell types, we find considerable variation in mitochondrial-encoded gene expression along the mitochondrial transcriptome, across tissues and between individuals, highlighting the importance of cell-type specific and post-transcriptional processes in shaping mitochondrial-encoded RNA levels. Using whole-genome genetic data we identify 64 nuclear loci associated with expression levels of 14 genes encoded in the mitochondrial genome, including missense variants within genes involved in mitochondrial function (TBRG4, MTPAP and LONP1), implicating genetic mechanisms that act in trans across the two genomes. We replicate ~21% of associations with independent tissue-matched datasets and find genetic variants linked to these nuclear loci that are associated with cardio-metabolic phenotypes and Vitiligo, supporting a potential role for variable mitochondrial-encoded gene expression in complex disease.
Keywords: RNA sequencing; chromosomes; eQTL; expression; gene expression; genetics; genomics; human; mitochondria; mtRNA; transcriptome.
© 2019, Ali et al.
Conflict of interest statement
AA, LB, GC, VS, KS, AH No competing interests declared
Figures
References
-
- Awadalla P, Boileau C, Payette Y, Idaghdour Y, Goulet JP, Knoppers B, Hamet P, Laberge C, Project CA, CARTaGENE Project Cohort profile of the CARTaGENE study: Quebec's population-based biobank for public health and personalized genomics. International Journal of Epidemiology. 2013;42:1285–1299. doi: 10.1093/ije/dys160. - DOI - PubMed
Publication types
MeSH terms
Associated data
- Actions
Grants and funding
- BB/R006075/1/BB_/Biotechnology and Biological Sciences Research Council/United Kingdom
- R01 DA006227/DA/NIDA NIH HHS/United States
- RC2 MH089916/MH/NIMH NIH HHS/United States
- R01 MH101782/MH/NIMH NIH HHS/United States
- R01 MH101810/MH/NIMH NIH HHS/United States
- R01 MH101819/MH/NIMH NIH HHS/United States
- R01 MH090936/MH/NIMH NIH HHS/United States
- MR/L016311/1/MRC_/Medical Research Council/United Kingdom
- MR/M009343/1/MRC_/Medical Research Council/United Kingdom
- MR/L01999X/1/MRC_/Medical Research Council/United Kingdom
- R01 MH101820/MH/NIMH NIH HHS/United States
- WT_/Wellcome Trust/United Kingdom
- R01 MH101822/MH/NIMH NIH HHS/United States
- R01 MH090951/MH/NIMH NIH HHS/United States
- MR/M004422/1/MRC_/Medical Research Council/United Kingdom
- R01 MH101825/MH/NIMH NIH HHS/United States
- R01 MH090948/MH/NIMH NIH HHS/United States
- R01 MH090941/MH/NIMH NIH HHS/United States
- HHSN261200800001C/RC/CCR NIH HHS/United States
- R01 MH090937/MH/NIMH NIH HHS/United States
- HHSN268201000029C/HL/NHLBI NIH HHS/United States
- HHSN261200800001E/CA/NCI NIH HHS/United States
- R01 MH101814/MH/NIMH NIH HHS/United States
LinkOut - more resources
Full Text Sources
Molecular Biology Databases
Research Materials
