Review
. 2019;67(3):795-819.
doi: 10.3233/JAD181028.

Is Alzheimer's Disease Risk Modifiable?

Affiliations
Review

Is Alzheimer's Disease Risk Modifiable?

Alberto Serrano-Pozo et al. J Alzheimers Dis. 2019.

Abstract

Population-based clinic-pathological studies have established that the most common pathological substrate of dementia in community-dwelling elderly people is mixed, especially Alzheimer's disease (AD) and cerebrovascular ischemic disease (CVID), rather than pure AD. While these could be just two frequent unrelated comorbidities in the elderly, epidemiological research has reinforced the idea that mid-life (age <65 years) vascular risk factors increase the risk of late-onset (age ≥ 65 years) dementia, and specifically AD. By contrast, healthy lifestyle choices such as leisure activities, physical exercise, and Mediterranean diet are considered protective against AD. Remarkably, several large population-based longitudinal epidemiological studies have recently indicated that the incidence and prevalence of dementia might be decreasing in Western countries. Although it remains unclear whether these positive trends are attributable to neuropathologically definite AD versus CVID, based on these epidemiological data it has been estimated that a sizable proportion of AD cases could be preventable. In this review, we discuss the current evidence about modifiable risk factors for AD derived from epidemiological, preclinical, and interventional studies, and analyze the opportunities for therapeutic and preventative interventions.

Keywords: Alcohol drinking; Alzheimer’s disease; dementia; diabetes mellitus; diet; education; exercise; hyperlipidemia; hypertension; smoking.


Figures
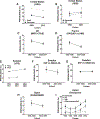
Fig. 1.
Fig. 1.. Trends in dementia prevalence.
Dementia prevalence appears to be decreasing in the United States and Western Europe, but not in Japan or Sweden. Graphs depicting the changing prevalence of cognitive impairment not dementia (CIND, light grey diamonds), all-cause dementia (black circles), Alzheimer’s disease (AD, steel grey squares), vascular dementia (VaD, aluminum grey triangles), and other/unclassified dementias (inverted silver-grey triangles). Error bars represent 95% confidence intervals (95%CI). A) Prevalence results for all-cause dementia and CIND from the 2000 and 2012 waves of the Health and Retirement Study (HRS) [34], conducted among people ≥ 65 years across the United States. B) Prevalence results for all-cause dementia and AD from the 1992 and 2001 waves of the Indianapolis-Ibadan Dementia Project (IIDB) [25], conducted among ≥ 70 years old African-Americans in Indianapolis, Indiana (USA). C) Prevalence results for all-cause dementia from the waves I (1989–1994) and II ( 2008–2011) of the Medical Research Council Cognitive and Function Aging Study (MRC-CFAS) [27], conducted among people ≥ 65 years old in three geographically defined areas of England (UK). D) Prevalence rates for the algorithmic diagnosis of dementia (“cognitive impairment with disability” or CIWD) from the Persones Agées Quid (PAQUID, 1988–1989) and the Aging Multidisciplinary Investigation (AMI, 2007–2009) studies [31], conducted among farmers aged 65 and older in the area of Bourdeaux, France. E) Crude prevalence rates for all-cause dementia in the 1976–1977, 2000–2001, and 2005–2006 waves of the H70 study [22], conducted among 70- and 75-year-old residents of Gothenburg, Sweden (95%CI not available). F) Crude prevalence rates for all-cause dementia from the Nordanstig Project (NP, 1995–1998) and the Swedish National study on Aging and Care in Nordanstig (SNAC-N, 2001–2003), derived from residents aged 78 and older in the municipality of Nordanstig, Sweden [33]. G) Prevalence rates for all-cause dementia from the Kungsholmen Project (KP, 1987–1989) and the Swedish National study on Aging and Care in Kungsholmen (SNAC-K, 2001–2004) [23], conducted among people ≥ 75 years old in central Stockholm, Sweden. H) Prevalence rates for all-cause dementia from the waves 0 (1988–89) and I (1994–1996) of the Zaragoza Dementia Depression Project (ZARADEMP) [21], conducted among people ≥ 65 years old in the city of Zaragoza, Spain. I) Prevalence rates for all-cause dementia, AD, VaD, and other/unclassified dementia from the 1985, 1992, 1998, 2005, and 2012 waves of the Hisayama Study [32], conducted among people ≥ 65 years old in Hisayama, Japan.
Fig. 2.
Fig. 2.. Trends in dementia incidence.
Dementia incidence appears to be decreasing in the United States and Western Europe, but not in Japan. Graphs depicting the changing incidence of all-cause dementia (black circles), Alzheimer’s disease (AD, steel-grey squares), vascular dementia (VaD, aluminum-grey triangles), and other/unclassified dementias (inverted silver-grey triangles). Error bars represent 95 confidence intervals (95%CI). A) Age- and sex-adjusted 5-year cumulative hazard rate (cumulative incidence per 100 persons over a period of 5 years) for all-cause dementia, AD, and VaD from the Framingham Heart Study (FHS) [29], conducted among people ≥ 65 years old in Framingham, Massachusetts (USA). B) Age-standardized annual incidence rate (%) for all cause dementia and AD from the 1992 and 2001 waves of the Indianapolis-Ibadan Dementia Project (IIDB) [26], conducted among ≥ 70 years old African-Americans in Indianapolis, Indiana (USA). C) Crude dementia incidence (expressed as rate per 100 person-years) of the serial birth cohorts from the Einstein Aging Study [35], conducted among people ≥ 70 years old in the Bronx County, New York (USA) (95%CI not available). D) Incidence rates per 1000 person-years from the Medical Research Council Cognitive and Function Aging Study (MRC-CFAS) I and II [28], conducted among people ≥ 65 years in three geographically defined areas from England (UK). E) Age-adjusted incidence per 1000 person-years from the 1990 and 2000 waves of the Rotterdam Study [20], conducted among people aged 60 to 90 in Rotterdam, Netherlands. The 95%CI are not available, but the incidence rate ratio of the 2000 cohort relative to the 1990 cohort was 0.75 (0.56–1.02). F) Crude dementia incidence per 1000 person-years based on the algorithmic diagnosis from the Three-City Study (3C, 2000s cohort) compared with the Personnes Agées Quid study (PAQUID, 1990s cohort) [30], both conducted among people ≥ 65 years old in the Bourdeaux area of France. The 95%CI are not available, but the fully adjusted (for age, education, vascular risk factors and depression) hazard ratio of the 3C versus the PAQUID cohorts was 0.77 (0.61–0.97). G) Age-standardized annual incidence rate (%) for all cause dementia and AD in the 1992 and 2001 waves of the Indianapolis-Ibadan Dementia Project (IIDB) [26], conducted among ≥ 70 years old Yoruba in Indaba, Nigeria. H) Age- and sex-adjusted incidence per 1000 person-years for all-cause dementia, AD, VaD, and other/unclassified dementia from the 1988 and 2002 cohorts of the Hisayama Study [32], conducted among people ≥ 65 years old in Hisayama, Japan.
Fig. 3.
Fig. 3.
Schematic representing the risk of dementia and Alzheimer’s disease as a balance between modifiable and unmodifiable protective and risk factors.

References

    1. Hirtz D, Thurman DJ, Gwinn-Hardy K, Mohamed M, Chaudhuri AR, Zalutsky R (2007) How common are the “common” neurologic disorders?. Neurology 68, 326–337. - PubMed
    1. GBD 2015 Neurological Disorders Collaborator Group (2017) Global, regional, and national burden of neurological disorders during 1990–2015: a systematic analysis for the Global Burden of Disease Study 2015. Lancet Neurol 16, 877–897. - PMC - PubMed
    1. Alzheimer’s, Association (2016) 2016 Alzheimer’s disease facts and figures. Alzheimers Dement 12, 459–509. - PubMed
    1. Serrano-Pozo A, Aldridge GM, Zhang Q (2017) Four decades of research in Alzheimer’s Disease (1975–2014): a bibliometric and scientometric analysis. J Alzheimers Dis 59, 763–783. - PMC - PubMed
    1. Serrano-Pozo A, Frosch MP, Masliah E, Hyman BT (2011) Neuropathological alterations in Alzheimer disease. Cold Spring Harb Perspect Med 1, a006189. - PMC - PubMed

Publication types