. 2019 Apr 15:665:1-11.
doi: 10.1016/j.abb.2019.01.038. Epub 2019 Feb 15.

Simvastatin promotes restoration of chondrocyte morphology and phenotype

Affiliations

Simvastatin promotes restoration of chondrocyte morphology and phenotype

Kenya Terabe et al. Arch Biochem Biophys. .

Abstract

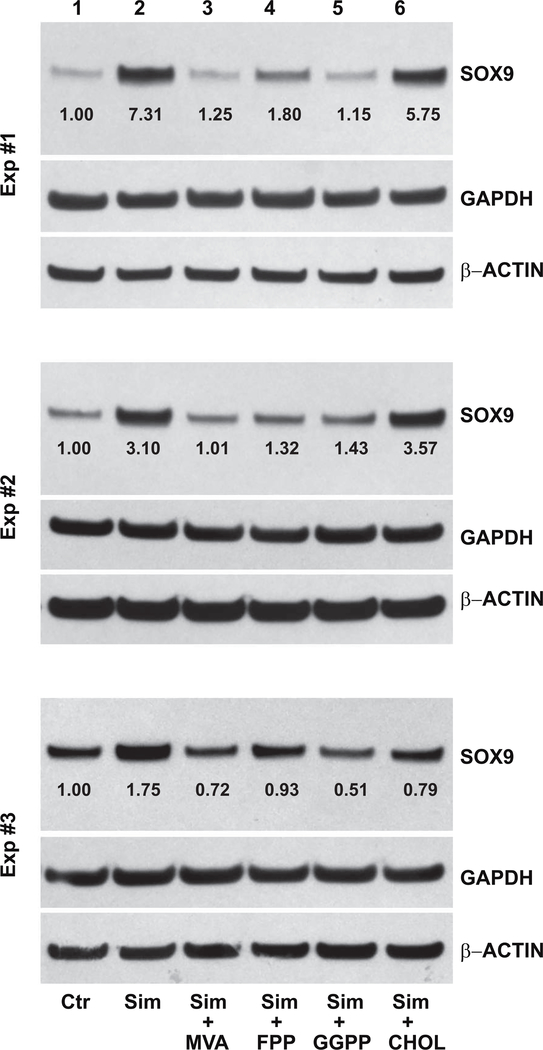
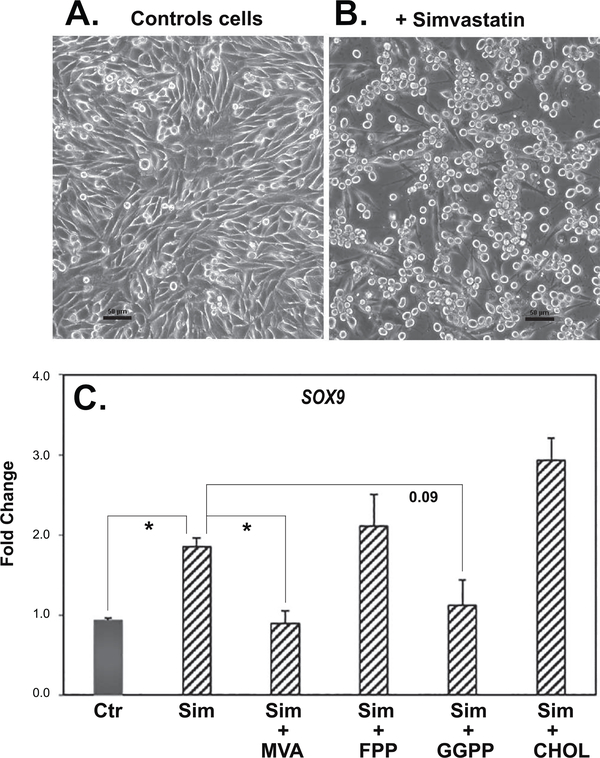
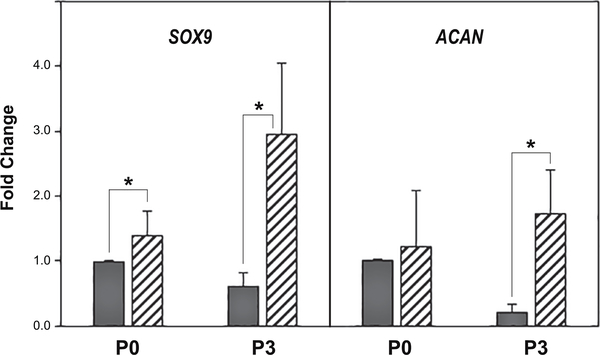
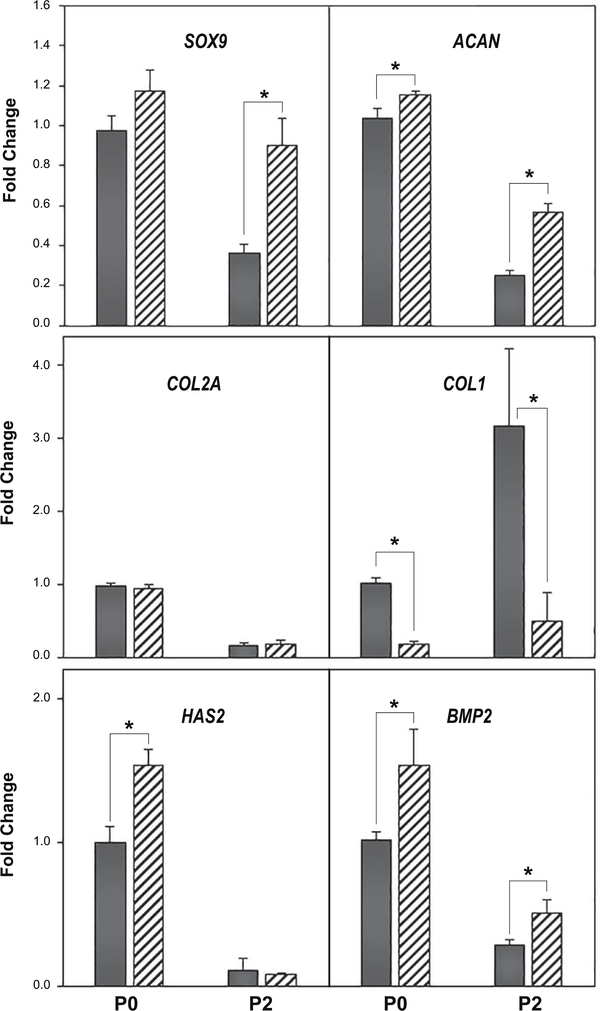
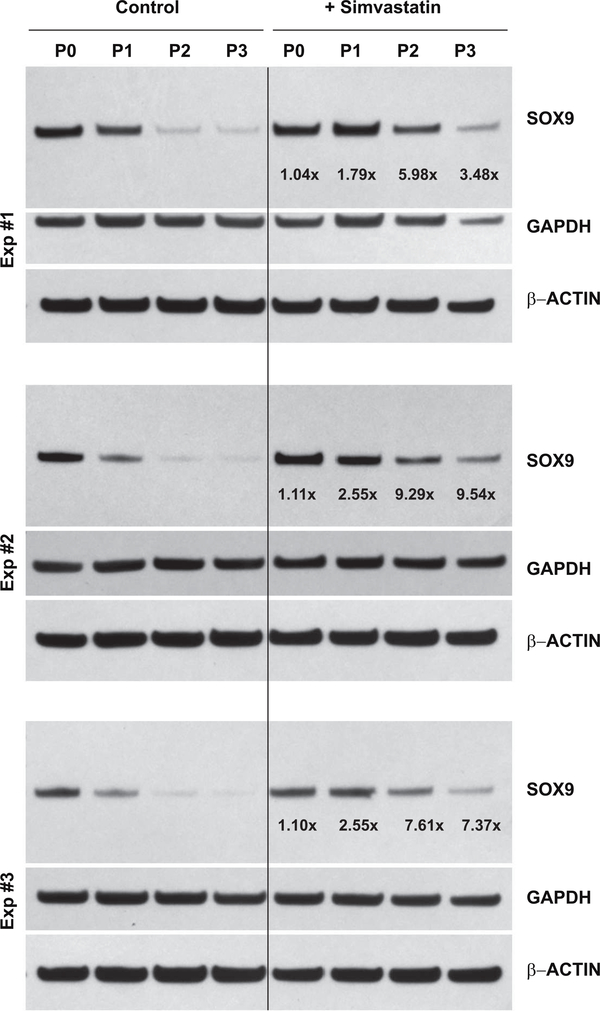
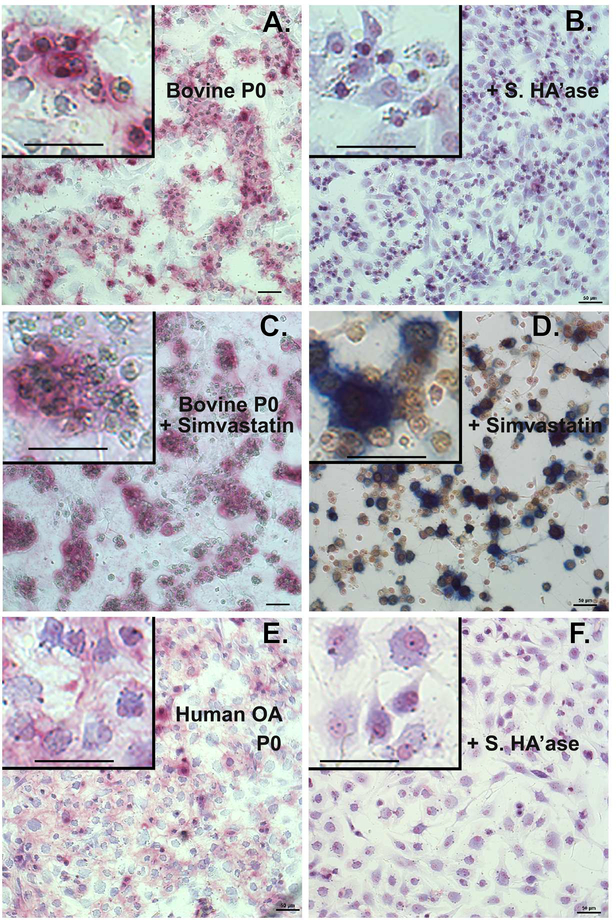
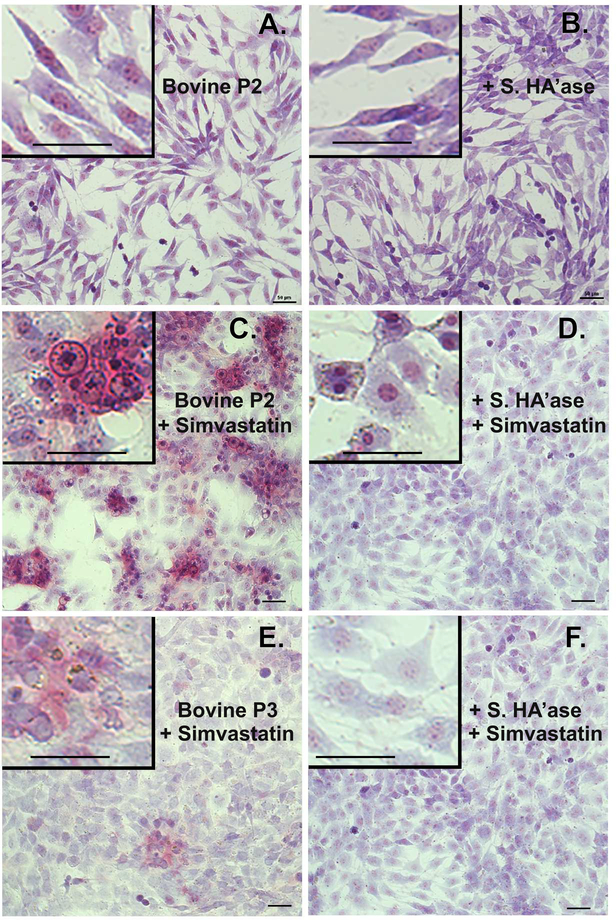
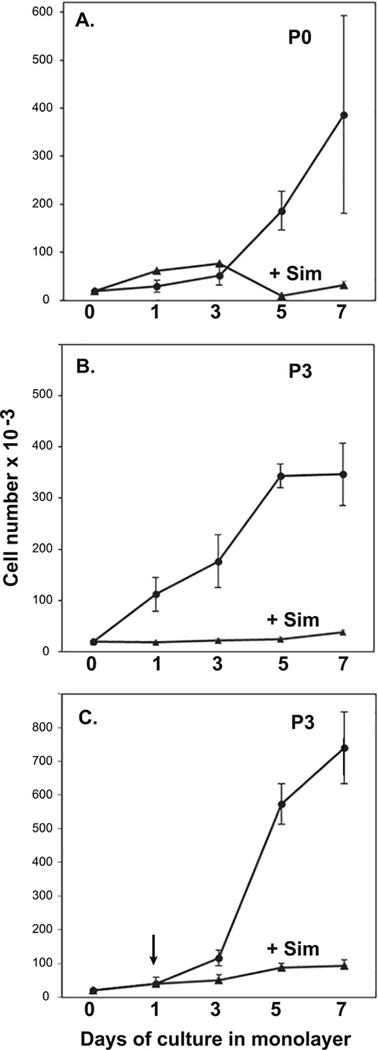
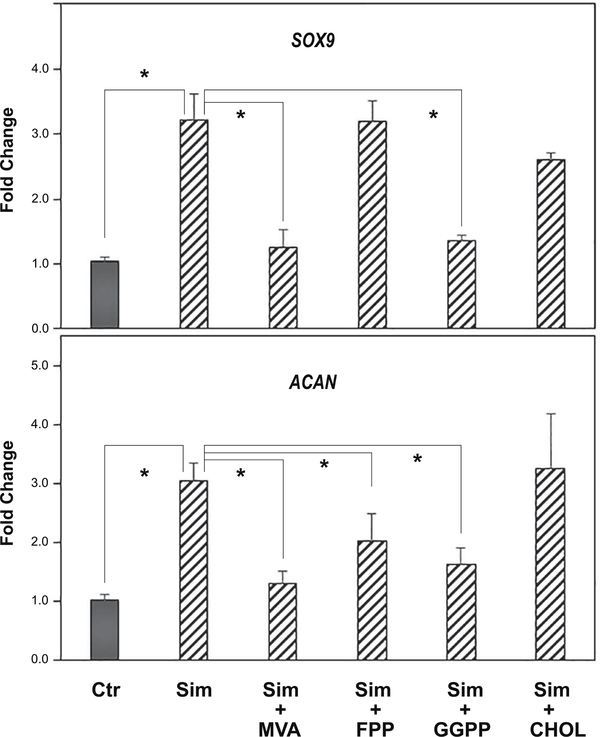
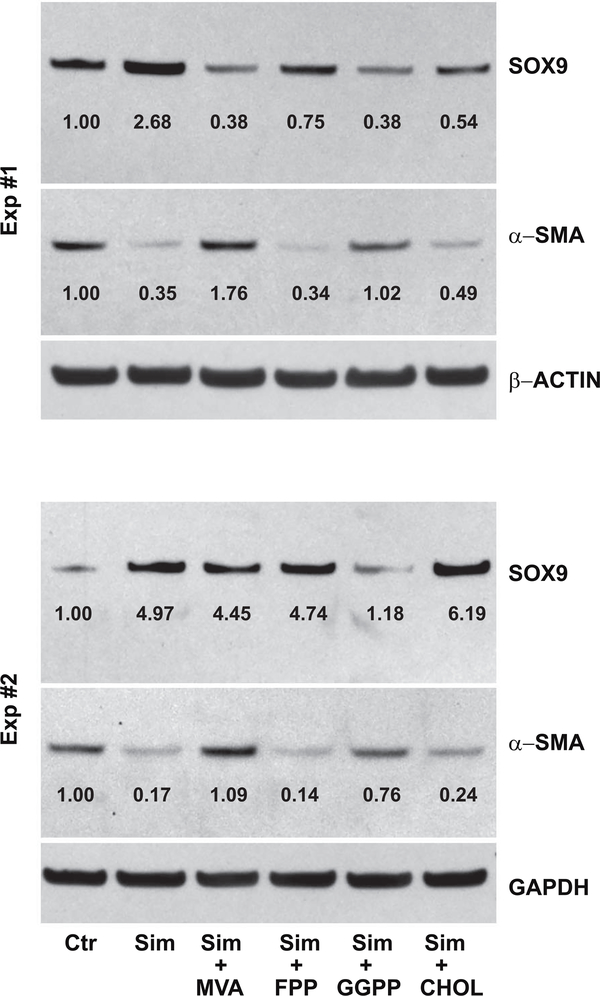
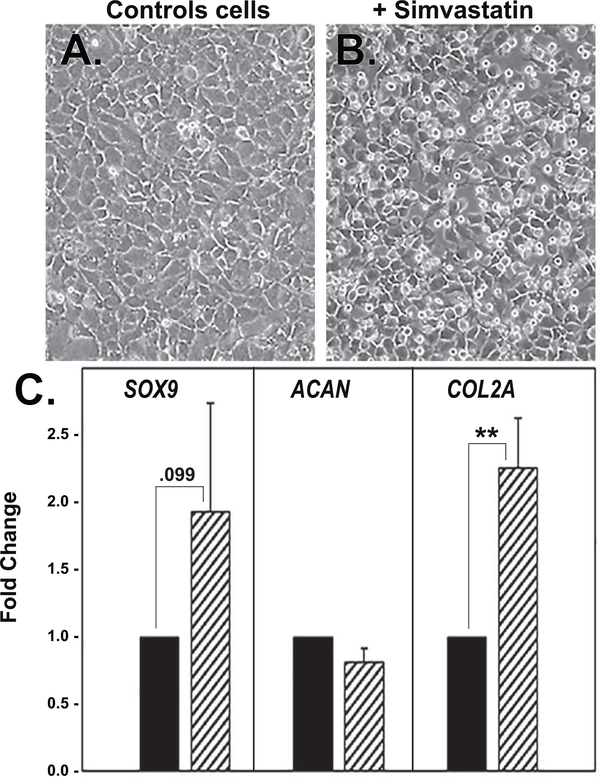
In this study we examined whether the action of simvastatin affects re-differentiation of passaged chondrocytes and if so, whether this was mediated via changes in cholesterol or cholesterol intermediates. Bovine articular chondrocytes, of varying passage number, human knee chondrocytes and rat chondrosarcoma chondrocytes were treated with simvastatin and examined for changes in mRNA and protein expression of markers of the chondrocyte phenotype as well as changes in cell shape, proliferation and proteoglycan production. In all three models, while still in monolayer culture, simvastatin treatment alone promoted changes in phenotype and morphology indicative of re-differentiation most prominent being an increase in SOX9 mRNA and protein expression. In passaged bovine chondrocytes, simvastatin stimulated the expression of SOX9, ACAN, BMP2 and inhibited the expression of COL1 and α-smooth muscle actin. Co-treatment of chondrocytes with simvastatin plus exogenous cholesterol-conditions that had previously reversed the inhibition on CD44 shedding, did not alter the effects of simvastatin on re-differentiation. However, the co-treatment of chondrocytes with simvastatin together with other pathway intermediates, mevalonate, geranylgeranylpyrophosphate and to a lesser extent, farnesylpyrophosphate, blocked the pro-differentiation effects of simvastatin. Treatment with simvastatin stimulated expression of SOX9 and COL2a and enhanced SOX9 protein in human OA chondrocytes. The co-treatment of OA chondrocytes with mevalonate or geranylgeranylpyrophosphate, but not cholesterol, blocked the simvastatin effects. These results lead us to conclude that the blocking of critical protein prenylation events is required for the positive effects of simvastatin on the re-differentiation of chondrocytes.

Keywords: Aggrecan; Chondrocyte; Osteoarthritis; Prenylation; SOX9; Simvastatin.


Figures

Figure 1.
Figure 1.. Effect of simvastatin on SOX9 and aggrecan mRNA expression by primary bovine articular chondrocytes and passage 3 derived cells.
SOX9 and aggrecan (ACAN) mRNA expression in primary (P0) bovine articular chondrocytes or third passage (P3) cells was determined by qRT-PCR analysis. Dark bars depict P0 or P3 vehicle control cells as labeled; hatched bars, the same cells following 4 days of treatment with 5 μM simvastatin. Panels show the relative mRNA expression data average ± SD (control P0 chondrocytes set to 1.0), of 3 independent experiments (performed at different times) each assayed in duplicate. * P <0.05.
Figure 2.
Figure 2.. Effect of simvastatin on marker genes indicative of changes in the chondrocyte phenotype.
qRT-PCR analysis was used to determine SOX9, ACAN, COL2A, COL1, HAS2 and BMP2 mRNA expression in P0 and P2 bovine chondrocytes with the vehicle control (dark bars) or the same cells following 4 days of treatment with 5 μM simvastatin (hatched bars). Panels show the relative mRNA expression data, average ± SD (control P0 chondrocytes set to 1.0), of 3 independent experiments (performed at different times) each assayed in duplicate. * P <0.05.
Figure 3.
Figure 3.. Effect of simvastatin on SOX9 protein accumulation in primary bovine chondrocytes and passaged cells.
Western blot analysis was used to determine changes in SOX9 protein in P0 bovine articular chondrocytes, P1, P2 and P3 cells without (left lanes labeled Control) or following 4 days of treatment with 5 μM simvastatin (right lanes, labeled +Simvastatin). Following detection of the ~70 kD SOX9 protein (70 kD), the same blots were stripped and reprobed for GAPDH and then a second time for β-actin. Values determined by densitometry show the fold-change in SOX9 band intensity after simvastatin treatment compared to untreated P0, P1, P2 or P3 cells, with values normalized to β-ACTIN in the same lysate. Data from 3 independent experiments (Exp #1, Exp #2 and Exp #3), performed at different times are shown.
Figure 4.
Figure 4.. Proteoglycan accumulation in primary (P0) chondrocyte cultures.
Primary (P0) cultures of bovine articular chondrocytes (panels A-D) or human OA chondrocytes (panels E, F) were treated 4 days without (panels A, B, E and F) or with 5 μM simvastatin (panel C) as labeled, fixed and stained with DMMB (panels A-C, E, F). Parallel cultures of cells shown in panels A and E were post-treated with 10 U/ml Streptomyces hyaluronidase for 3 hours (panels B and F) before fixation and DMMB staining. In panel D, bovine chondrocytes treated with simvastatin were stained with Stains-All. All images are depicted at similar magnification (50 μm bar) and taken under identical condition; minor linear adjustments (Brightness / Contrast) were made to the image [42]. Insets represent digitally enlarged (~3.3x higher) images to better display cellular detail and include 50 μm bar for comparison. Images shown are representative fields of cells grown at 3 different densities per experiment and, except for human OA chondrocytes, are representative of 3–8 independent experiments.
Figure 5.
Figure 5.. Proteoglycan accumulation in cultures of passaged chondrocytes.
Passaged P2 or P3 cells derived from P0 bovine articular chondrocytes were treated 4 days without (panels A, B) or with 5 μM simvastatin (panels C, D, E and F) as labeled. Parallel cultures of cells shown in panels A, C and E were post-treated with 10 U/ml Streptomyces hyaluronidase for 3 hours (panels B, D and F) before fixation and staining overnight with DMMB. All images are depicted at similar magnification (20x objective, 50 μm bar) and taken under identical conditions; minor linear adjustments (Brightness / Contrast) were made to the image [42]. Insets represent digitally enlarged (~3.3x higher) images to better display cellular detail and include 50 μm bar for comparison. Images shown are representative fields of cells grown at 3 different densities per experiment and representative of 4–14 independent experiments.
Figure 6.
Figure 6.. Effect of simvastatin on chondrocyte proliferation.
Primary (P0) bovine articular chondrocytes or P3 cells were plated at 20,000 cells/well into 12 well plates. Total cell numbers were determined on day 1 and every 2 days over the course of 7 days from duplicate wells for each condition. In panels A and B (P0 chondrocytes and P3 cells, respectively), 5 μM simvastatin (closed triangles) or vehicle (closed circles) was added at the time of plating. In panel C, 5 μM simvastatin (closed triangles) or vehicle (closed circles) was added during a media change on day 1. Data represent the average ± S.D. of 3 separate experiments.
Figure 7.
Figure 7.. The capacity of cholesterol biosynthesis intermediates to reverse the effects of simvastatin on SOX9 and ACAN mRNA expression in passaged bovine chondrocytes.
SOX9 (top panel) and ACAN (bottom panel) mRNA expression was determined by qRT-PCR analysis. SOX9 and ACAN expression in untreated control P3 cells (Ctr; dark bars) or P3 cells treated for 4 days with 5 μM simvastatin (hatched bars, labeled sim) in the absence or presence of 500 μM mevalonic acid (MVA), 10 μM farnesyl pyrophosphate (FPP), 10 μM geranylgeranyl pyrophosphate (GGPP) or 500 μM cholesterol (CHOL) are shown. Panels show the relative mRNA expression data, average ± SD (control P3 cells set to 1.0), of 3 independent experiments (performed at different times) each assayed in duplicate. * P <0.05.
Figure 8.
Figure 8.. The capacity of cholesterol biosynthesis intermediates to reverse the effects of simvastatin on SOX9 and α-smooth muscle actin protein accumulation in passaged bovine chondrocytes.
Western blot analysis was used to determine changes in SOX9 and α-smooth muscle actin (α-SMA) protein in P3 cells without (left lanes labeled Control, Ctr) or following 4 days of treatment with 5 μM simvastatin (right lanes, Sim) in the absence or presence of 500 μM mevalonic acid (MVA), 10 μM farnesyl pyrophosphate (FPP), 10 μM geranylgeranyl pyrophosphate (GGPP) or 500 μM cholesterol (CHOL) as labeled. Following detection of the ~70 kD SOX9 protein or 42 kD αSMA, the same blots were stripped and reprobed for the reference protein, either β-ACTIN or GAPDH. Values determined by densitometry show the fold-change in SOX9 and α-SMA band intensities after treatments compared to untreated P3 cells (Ctr; set to 1.00) with values normalized to the reference gene protein in the same lysate. Data from 2 independent experiments (Exp #1, Exp #2), performed at different times are shown.
Figure 9.
Figure 9.. Effect of simvastatin on marker genes indicative of changes in the phenotype of primary human OA chondrocytes.
Primary (P0) high density monolayer cultures of human OA chondrocytes exhibit a polygonal and flattened morphology (panel A) that becomes more rounded and cobblestone-like following treatment with simvastatin (panel B). Panel C depicts qRT-PCR analysis used to determine SOX9, ACAN and COL2A mRNA expression in primary human OA chondrocytes (vehicle control; dark bars) and changes in expression in cultures of the same OA chondrocytes following 4 days of treatment with 5 μM simvastatin (hatched bars). Panels show the relative mRNA expression data, average ± SD (control P0 OA chondrocytes set to 1.0), of 3 independent experiments (performed at different times, using chondrocytes isolated from cartilage from three patients) each assayed in duplicate. ** P <0.01 and otherwise noted.
Figure 10.
Figure 10.. The capacity of cholesterol biosynthesis intermediates to reverse the effects of simvastatin on SOX9 protein accumulation in primary human OA chondrocytes.
Western blot analysis was used to determine changes in SOX9 protein in primary human OA articular chondrocytes without (left lanes labeled Control, Ctr; set to 1.00) or following 4 days of treatment with 5 μM simvastatin (right lanes, Sim) in the absence or presence of 500 μM mevalonic acid (MVA), 10 μM farnesyl pyrophosphate (FPP), 10 μM geranylgeranyl pyrophosphate (GGPP) or 500 μM cholesterol (CHOL) as labeled. Following detection of the ~70 kD SOX9 protein (70 kD), the same blots were stripped and re-probed for GAPDH and then a second time for β-actin. Values determined by densitometry show the fold-change in SOX9 band intensity after these treatments compared to untreated controls, with values normalized to β-ACTIN in the same lysate. Data from 3 independent experiments derived using chondrocytes isolated from 3 different patient cartilage samples (Exp #1, Exp #2, Exp #3) and performed at different times, are shown.
Figure 11.
Figure 11.. The capacity of cholesterol biosynthesis intermediates to reverse the effects of simvastatin on Sox9 mRNA expression in rat chondrosarcoma chondrocytes.
High density monolayer cultures of RCS-o chondrocytes exhibit an extended fusiform morphology (panel A) that becomes more rounded following treatment with simvastatin (panel B). Bars: 50 μm. Panel C depicts Sox9 mRNA expression determined by qRT-PCR analysis in vehicle control RCS chondrocytes (Ctr; dark bar) or RCS chondrocytes treated for 2 days with 5 μM simvastatin (hatched bars) in the absence or presence of 500 μM mevalonic acid (MVA), 10 μM farnesyl pyrophosphate (FPP), 10 μM geranylgeranyl pyrophosphate (GGPP) or 500 μM cholesterol (CHOL) as labeled. Panels show the relative mRNA expression data, average ± SD (control RCS cells set to 1.0), of 2 independent experiments (performed at different times) each assayed in duplicate. * P <0.05 or otherwise noted.

Similar articles

Cited by

References

    1. Ono Y, Sakai T, Hiraiwa H, Hamada T, Omachi T, Nakashima M, et al., Chondrogenic capacity and alterations in hyaluronan synthesis of cultured human osteoarthritic chondrocytes, Biochem. Biophys. Res. Commun 435 (2013) 733–739. - PMC - PubMed
    1. Takahashi N, Knudson CB, Thankamony S, Ariyoshi W, Mellor L, Im HJ, et al., Induction of CD44 cleavage in articular chondrocytes, Arthritis Rheum 62 (2010) 1338–1348. - PMC - PubMed
    1. Stokes DG, Liu G, Coimbra IB, Piera-Velazquez S, Crowl RM, Jimenez SA, Assessment of the gene expression profile of differentiated and dedifferentiated human fetal chondrocytes by microarray analysis, Arthritis Rheum 46 (2002) 404–419. - PubMed
    1. Cha BH, Kim JH, Kang SW, Do HJ, Jang JW, Choi YR, et al., Cartilage tissue formation from dedifferentiated chondrocytes by codelivery of BMP-2 and SOX-9 genes encoding bicistronic vector, Cell Transplant. 22 (2013) 1519–1528. - PubMed
    1. Parreno J, Bianchi VJ, Sermer C, Regmi SC, Backstein D, Schmidt TA, et al., Adherent agarose mold cultures: An in vitro platform for multi-factorial assessment of passaged chondrocyte redifferentiation, J. Orthop. Res 36 (2018) 2392–2405. - PubMed

Publication types