

A unique insight into the MiRNA profile during genital chlamydial infection
- PMID: 30777008
- PMCID: PMC6379932
- DOI: 10.1186/s12864-019-5495-6
A unique insight into the MiRNA profile during genital chlamydial infection
Abstract
Background: Genital C. trachomatis infection may cause pelvic inflammatory disease (PID) that can lead to tubal factor infertility (TFI). Understanding the pathogenesis of chlamydial complications including the pathophysiological processes within the female host genital tract is important in preventing adverse pathology. MicroRNAs regulate several pathophysiological processes of infectious and non-infectious etiologies. In this study, we tested the hypothesis that the miRNA profile of single and repeat genital chlamydial infections will be different and that these differences will be time dependent. Thus, we analyzed and compared differentially expressed mice genital tract miRNAs after single and repeat chlamydia infections using a C. muridarum mouse model. Mice were sacrificed and their genital tract tissues were collected at 1, 2, 4, and 8 weeks after a single and repeat chlamydia infections. Histopathology, and miRNA sequencing were performed.
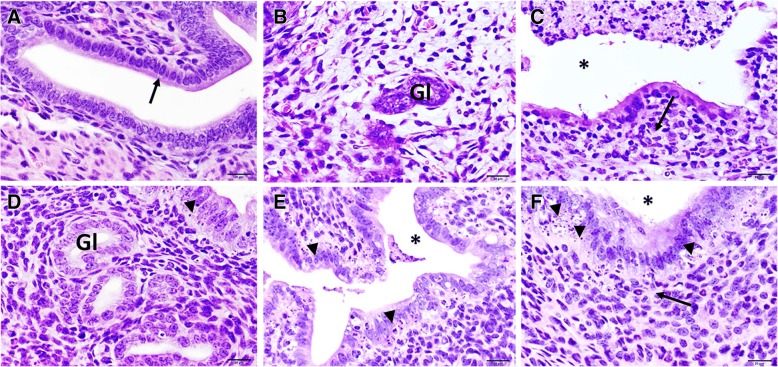
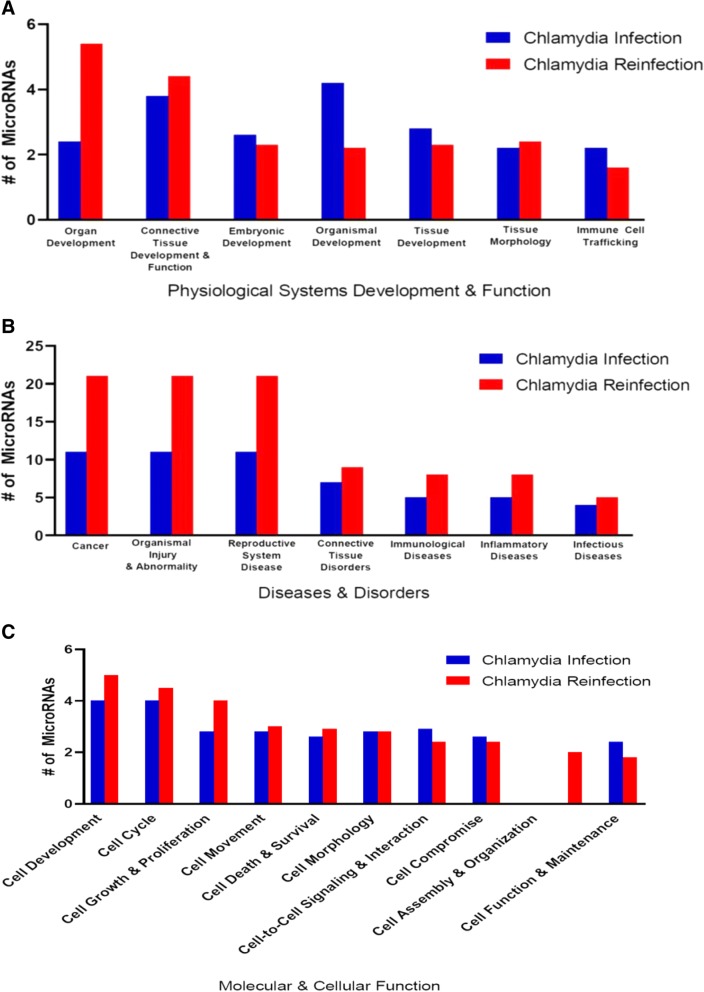
Results: Histopathology presentation showed that the oviduct and uterus of reinfected mice were more inflamed, distended and dilated compared to mice infected once. The miRNAs expression profile was different in the reproductive tissues after a reinfection, with a greater number of miRNAs expressed after reinfection. Also, the number of miRNAs expressed each week after chlamydia infection and reinfection varied, with weeks eight and one having the highest number of differentially expressed miRNAs for chlamydia infection and reinfection respectively. Ten miRNAs; mmu-miR-378b, mmu-miR-204-5p, mmu-miR-151-5p, mmu-miR-142-3p, mmu-miR-128-3p, mmu-miR-335-3p, mmu-miR-195a-3p, mmu-miR-142-5p, mmu-miR-106a-5p and mmu-miR-92a-3p were common in both primary chlamydia infection and reinfection. Pathway analysis showed that, amongst other functions, the differentially regulated miRNAs control pathways involved in cellular and tissue development, disease conditions and toxicity.
Conclusions: This study provides insights into the changes in miRNA expression over time after chlamydia infection and reinfection, as well as the pathways they regulate to determine pathological outcomes. The miRNAs networks generated in our study shows that there are differences in the focus molecules involved in significant biological functions in chlamydia infection and reinfection, implying that chlamydial pathogenesis occurs differently for each type of infection and that this could be important when determining treatments regime and disease outcome. The study underscores the crucial role of host factors in chlamydia pathogenesis.
Keywords: Chlamydia infection; Chlamydial pathogenesis; Differential expression; TFI; miRNAs.
Conflict of interest statement
Competing interest
The authors declare no competing interest, and that the funders had no role in study design, data collection and analysis, decision to publish, or preparation of the manuscript. The authors have deposited the raw sequences and processed data in the NCBI Geo webpage.
Ethics approval and consent to participate
The Institutional Animal Care and Use Committee of Morehouse School of Medicine (MSM-IACUC) approved the animal care and use protocol (# 16–24), which we followed in this study.
Consent for publication
Not applicable.
Publisher’s Note
Springer Nature remains neutral with regard to jurisdictional claims in published maps and institutional affiliations.
Figures


Similar articles
-
Early microRNA expression profile as a prognostic biomarker for the development of pelvic inflammatory disease in a mouse model of chlamydial genital infection.mBio. 2014 Jun 24;5(3):e01241-14. doi: 10.1128/mBio.01241-14. mBio. 2014. PMID: 24961692 Free PMC article.
-
MicroRNAs Modulate Pathogenesis Resulting from Chlamydial Infection in Mice.Infect Immun. 2016 Dec 29;85(1):e00768-16. doi: 10.1128/IAI.00768-16. Print 2017 Jan. Infect Immun. 2016. PMID: 27799333 Free PMC article.
-
Identification of the microRNA expression profile in the regenerative neonatal mouse heart by deep sequencing.Cell Biochem Biophys. 2014 Sep;70(1):635-42. doi: 10.1007/s12013-014-9967-7. Cell Biochem Biophys. 2014. PMID: 24756729
-
Chlamydia Spreading from the Genital Tract to the Gastrointestinal Tract - A Two-Hit Hypothesis.Trends Microbiol. 2018 Jul;26(7):611-623. doi: 10.1016/j.tim.2017.12.002. Epub 2017 Dec 27. Trends Microbiol. 2018. PMID: 29289422 Free PMC article. Review.
-
Chlamydia trachomatis: impact on human reproduction.Hum Reprod Update. 1999 Sep-Oct;5(5):433-47. doi: 10.1093/humupd/5.5.433. Hum Reprod Update. 1999. PMID: 10582782 Review.
Cited by
-
Role of microRNAs in immune regulation and pathogenesis of Chlamydia trachomatis and Chlamydia muridarum infections: a rapid review.Microbes Infect. 2024 Nov-Dec;26(8):105397. doi: 10.1016/j.micinf.2024.105397. Epub 2024 Jul 17. Microbes Infect. 2024. PMID: 39025257 Review.
-
Normospermic Patients Infected With Ureaplasma parvum: Role of Dysregulated miR-122-5p, miR-34c-5, and miR-141-3p.Pathog Immun. 2024 Jan 5;8(2):16-36. doi: 10.20411/pai.v8i2.603. eCollection 2023. Pathog Immun. 2024. PMID: 38223489 Free PMC article.
-
Heart Rate as a Non-Invasive Biomarker of Inflammation: Implications for Digital Health.Front Immunol. 2022 Jun 2;13:930445. doi: 10.3389/fimmu.2022.930445. eCollection 2022. Front Immunol. 2022. PMID: 35720409 Free PMC article. No abstract available.
-
Genital tract microbiome dynamics are associated with time of Chlamydia infection in mice.Sci Rep. 2023 Jun 2;13(1):9006. doi: 10.1038/s41598-023-36130-3. Sci Rep. 2023. PMID: 37268696 Free PMC article.
-
Chronic testicular Chlamydia muridarum infection impairs mouse fertility and offspring development†.Biol Reprod. 2020 Apr 15;102(4):888-901. doi: 10.1093/biolre/ioz229. Biol Reprod. 2020. PMID: 31965142 Free PMC article.
References
MeSH terms
Substances
Grants and funding
LinkOut - more resources
Full Text Sources
Medical
Molecular Biology Databases
