Review
. 2019:150:293-330.
doi: 10.1016/bs.mcb.2019.01.002. Epub 2019 Feb 11.

Culture of and experiments with sea urchin embryo primary mesenchyme cells

Affiliations
Review

Culture of and experiments with sea urchin embryo primary mesenchyme cells

Bradley Moreno et al. Methods Cell Biol. 2019.

Abstract

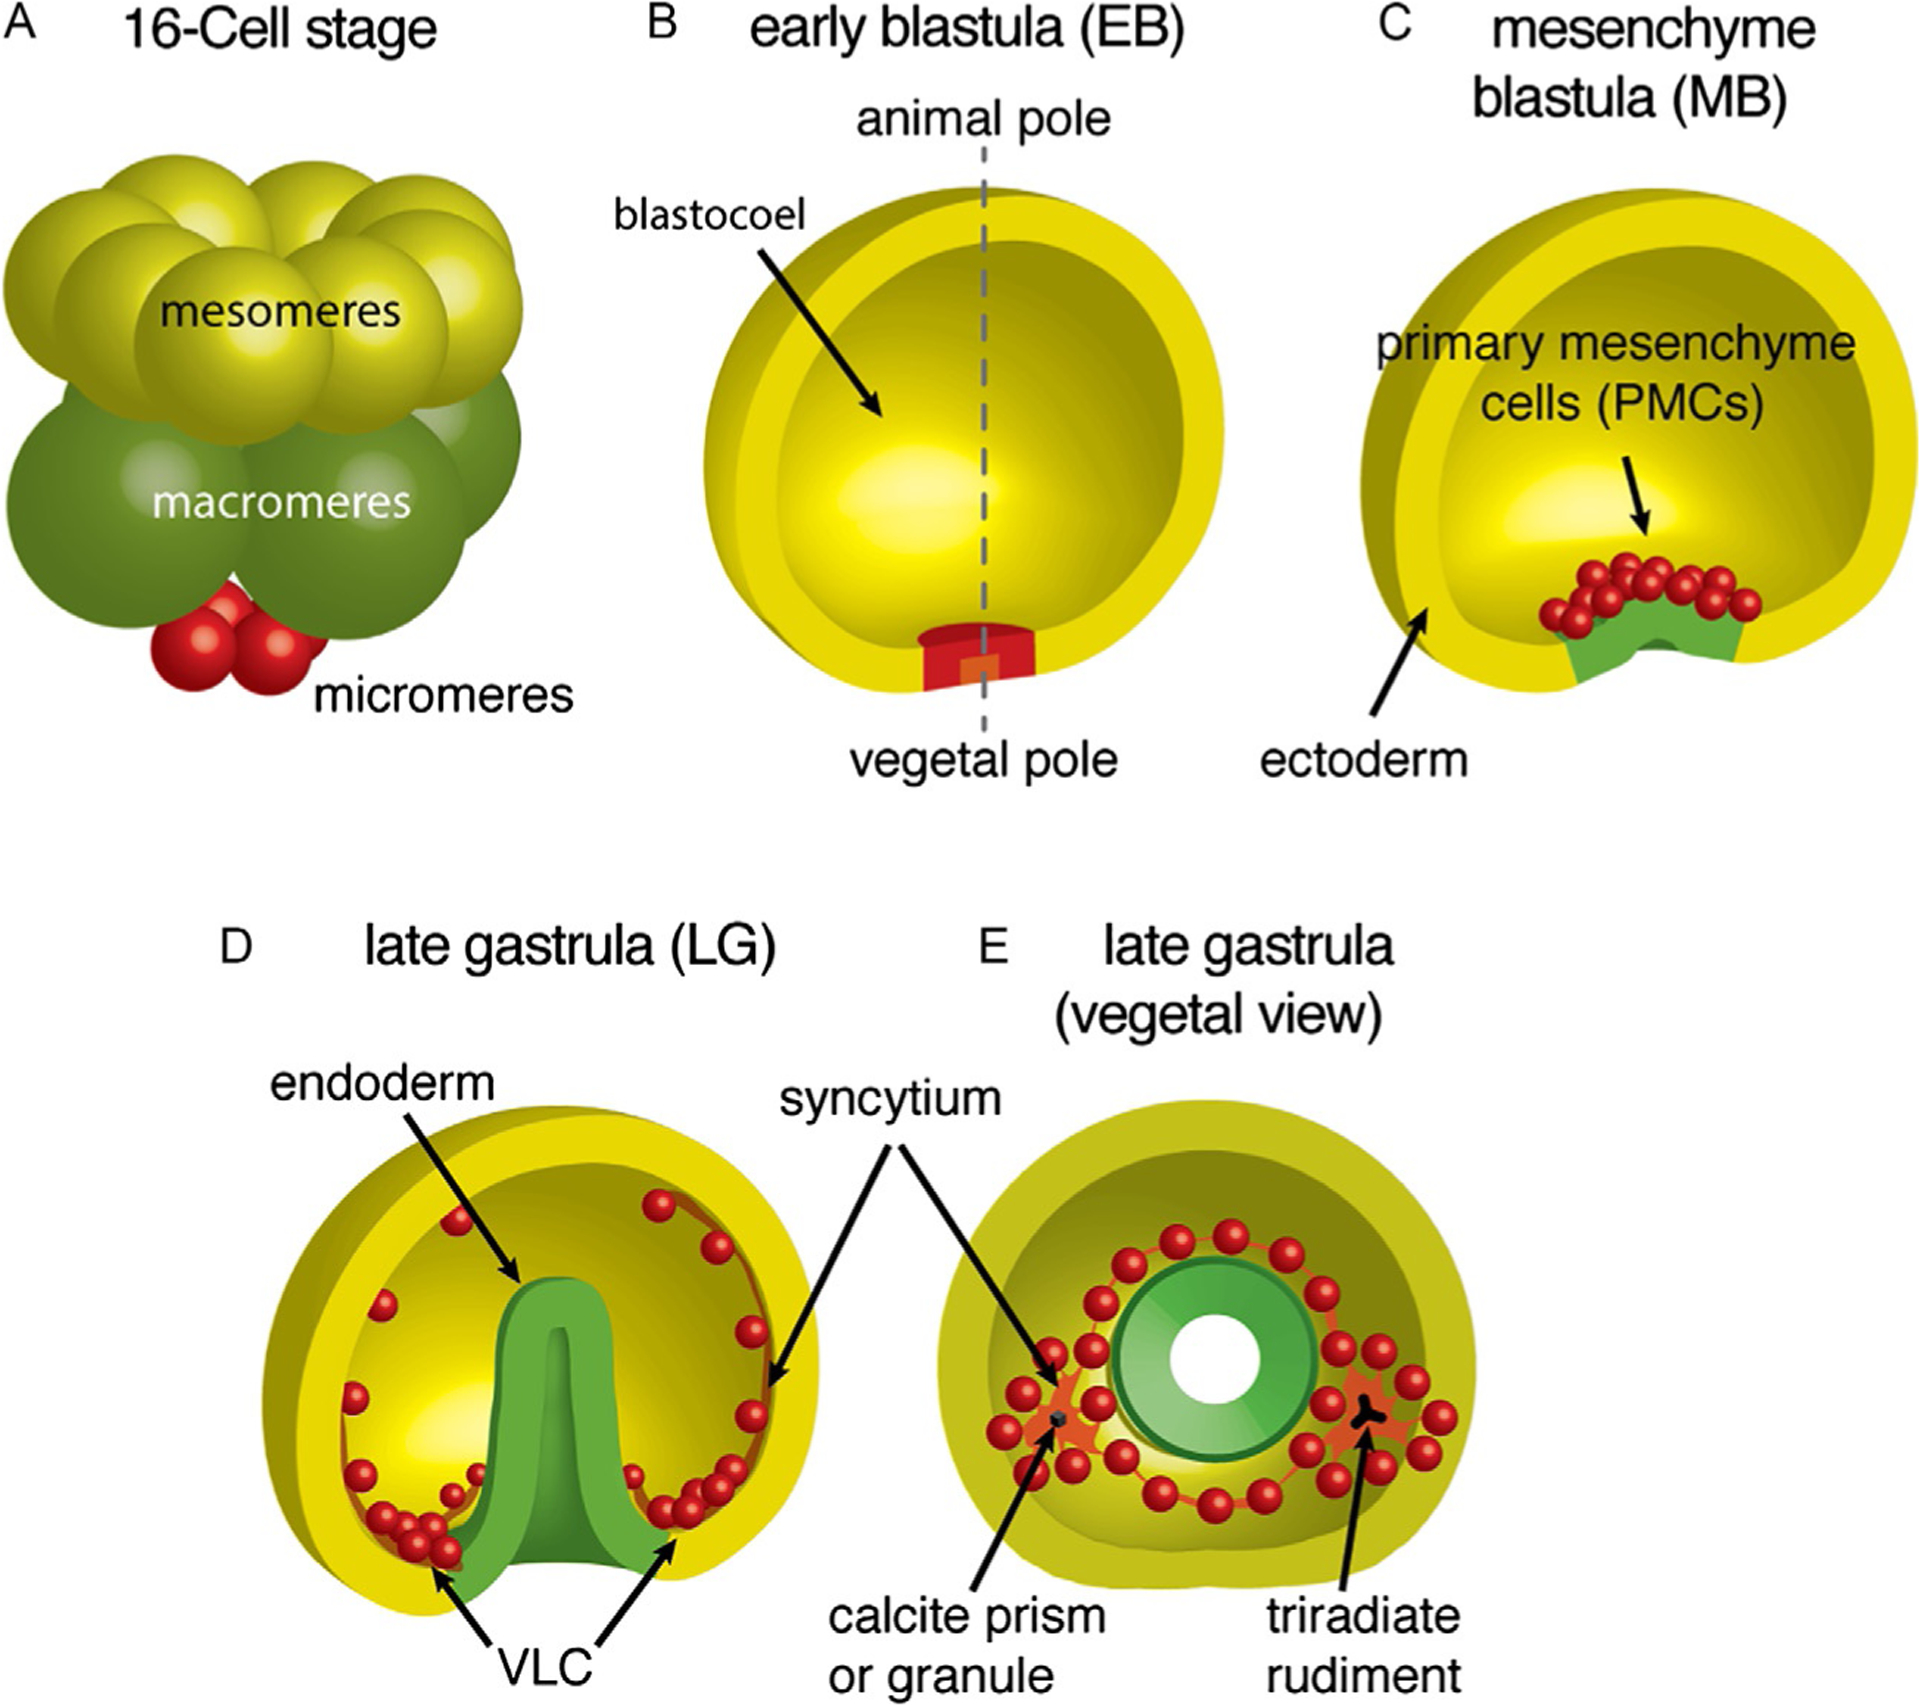
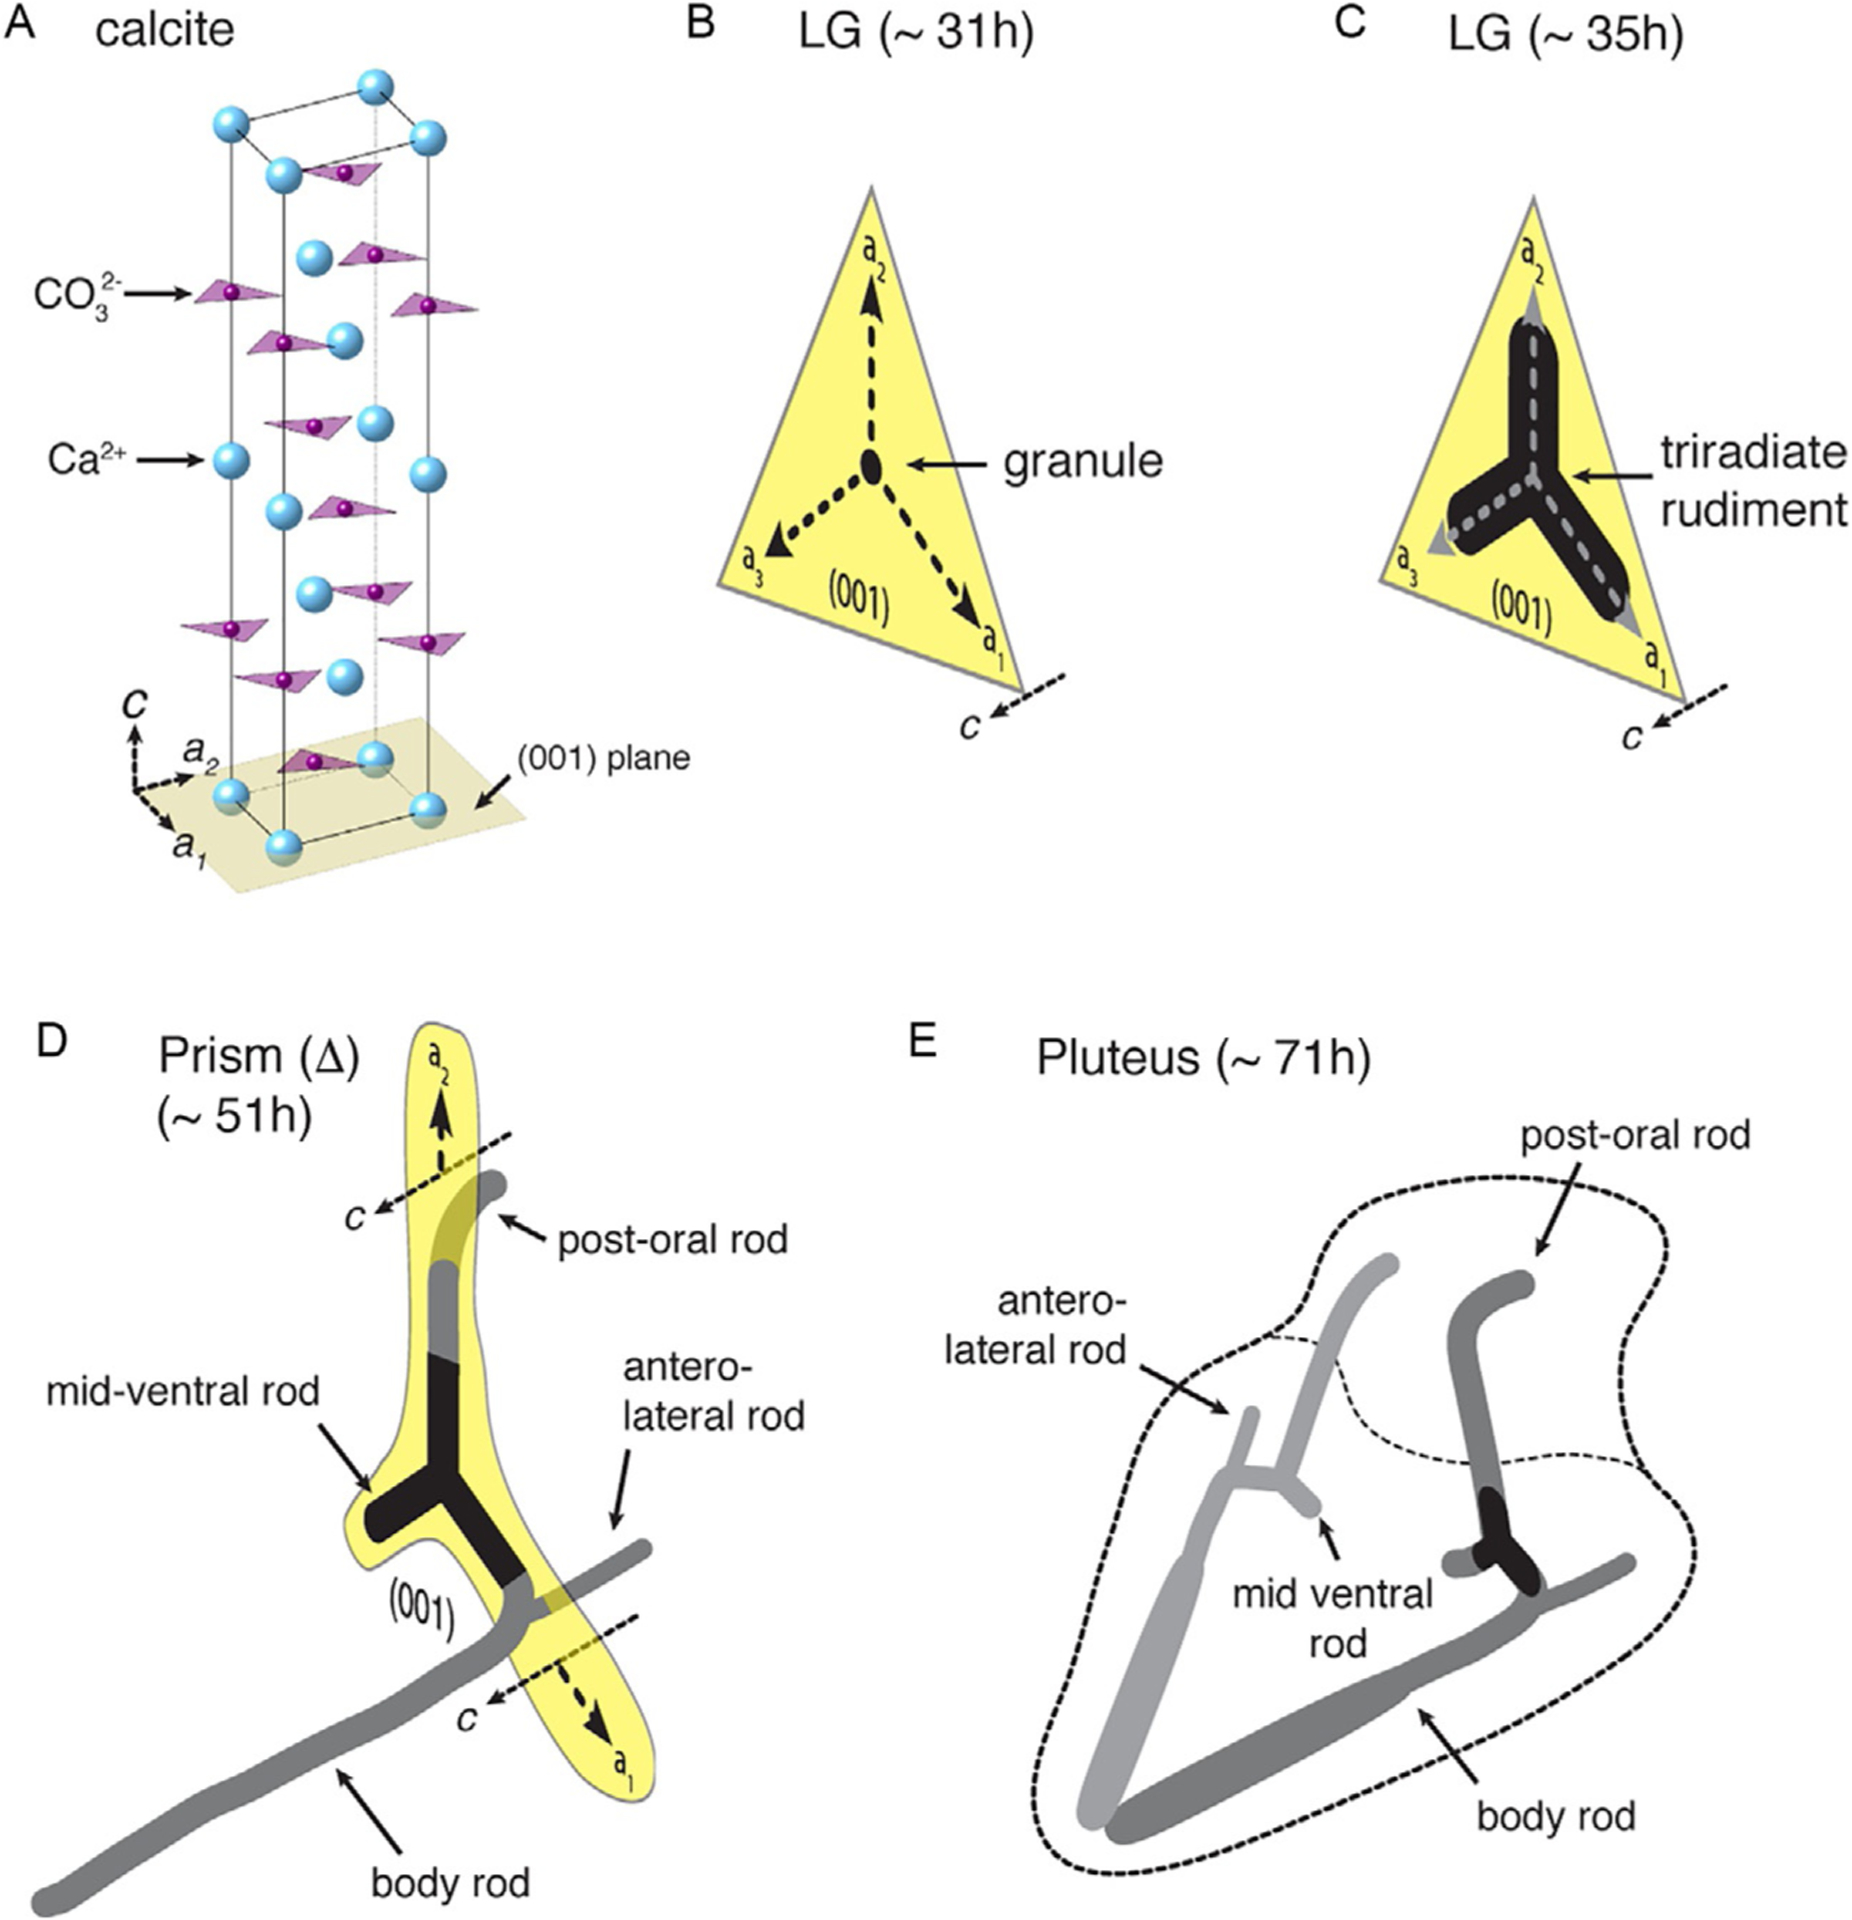
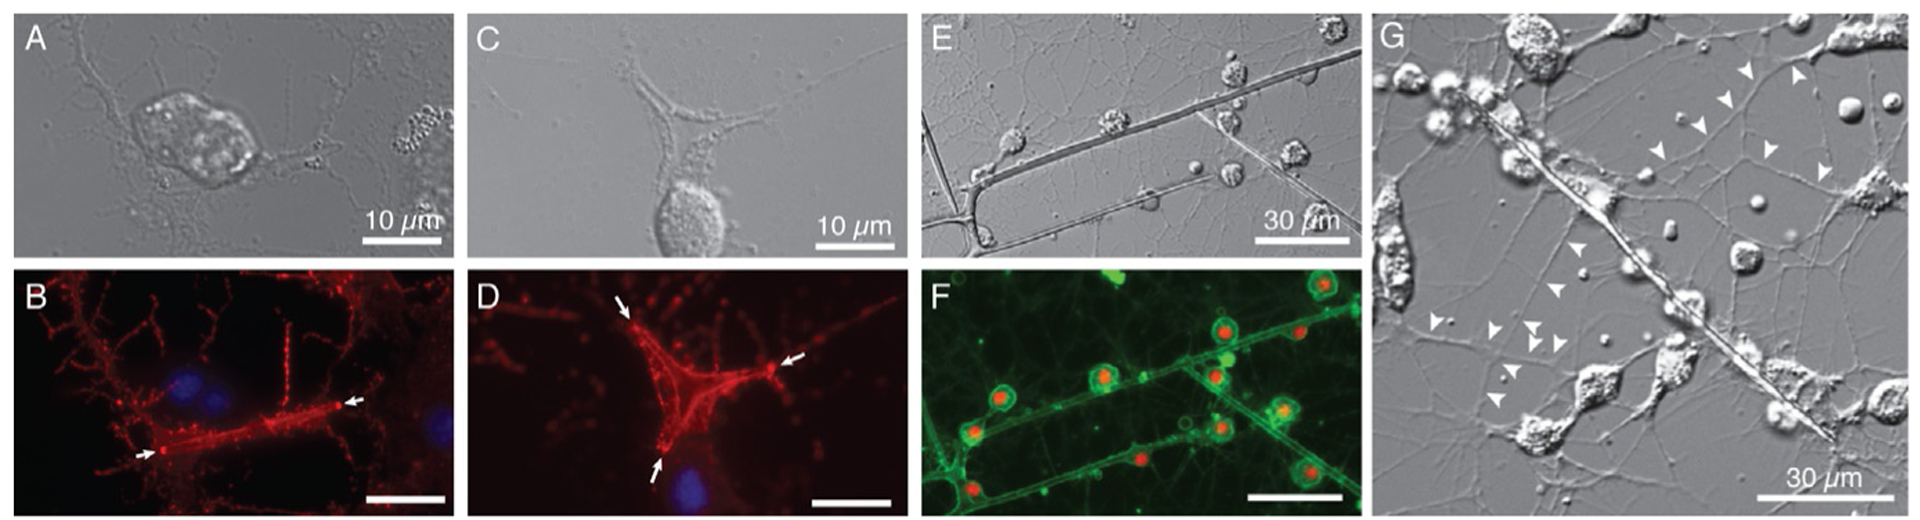
Skeletogenesis in the sea urchin embryo gives rise to a pair of intricate endoskeletal spicules. Deposition of these skeletal elements in the early larva is the outcome of a morphogenetic program that begins with maternal inputs in the early zygote and results in the specification of the large micromere-primary mesenchyme cell (PMC) lineage. PMCs are of considerable interest as a model system, not only to dissect the mechanism of specific developmental processes, but also to investigate their evolution and the unrivaled level of control over the formation of a graded, mechanically robust, yet single crystalline biomineral. The ability to study gene regulatory circuits, cellular behavior, signaling pathways, and molecular players involved in biomineralization is significantly boosted by the high level of autonomy of PMCs. In fact, in the presence of horse serum, micromeres differentiate into PMCs and produce spicules in vitro, separated from the embryonic milieu. PMC culture eliminates indirect effects that can complicate the interpretation of experiments in vivo, offers superior spatiotemporal control, enables PMC-specific readouts, and is compatible with most imaging and characterization techniques. In this chapter, we provide an updated protocol, based on the pioneering work by Okazaki and Wilt, for the isolation of micromeres and subsequent culture of PMCs, as well as protocols for fixation and staining for fluorescent microscopy, preparation of cell cultures for electron microscopy, and the isolation of RNA.

Keywords: Cell culture; Development; Electron microscopy; Fluorescence microscopy; Primary mesenchyme cells; Sea urchin embryo; Skeletogenesis; Spiculogenesis; Transcriptomics.


Figures

FIG. 1
FIG. 1
Morphogenetic behavior of the micromere-PMC lineage during early sea urchin embryo development (Schoenwolf, 2001). (A) Micromeres (red) are formed in the fourth, unequal cleavage. (B) Subsequent divisions result in 32 PMCs at the vegetal pole of the hollow blastula. (C) PMCs then ingress into the mesenchyme blastula (MB) in an epithelial-mesenchymal transition. (D and E) PMCs show directional migration, forming two ventrolateral clusters (VLCs) and a stereotypical pattern of strands in the late gastrula (LG). Cell-cell fusion leads to the formation of two syncytial masses. Synthesis of the endoskeleton inside each syncytium commences with the formation of a calcareous granule that grows into the triradiate spicule rudiments.
FIG. 2
FIG. 2
(A) Rendering of the crystal structure of calcite (CaCO3), the biomineral that constitutes >99% of the mass of sea urchin embryo spicules. In the c-axis direction, calcium and carbonate ions are arranged in alternating planes. During the development of S. purpuratus, a roughly spherical granule is deposited in the late gastrula (LG) stage, around 31 hpf (B). Over the next 4h, the granule grows along the crystallographic a-directions into the triradiate rudiment (C). By the prism stage (~51 hpf), one of the triradiate arms has branched and changed growth direction to the c-axis, and another has continued growth in the a-axis direction for longer and is only now in the process of changing direction (D). Further growth in the linear and radial directions result in the pluteus skeleton (E).
FIG. 3
FIG. 3
Spicules formed by S. purpuratus PMCs on (A) a nonpatterned surface and (B–D) Concanavalin A (ConA) linear array patterns. Under crossed polarizers, entire spicules brighten/extinguish (yellow arrow) as a whole, i.e., are single crystals; branching is occasionally observed (red arrow). (B) Polarized light microscope image showing parallel spicules on ConA pattern. (C) Fluorescent image of fluorescein-labeled ConA pattern (green) on FBS background. (D) Overlay of (B) and (C), showing the spicule-pattern alignment. Bridging can occur along (*) or at an angle (**) to the pattern direction, indicating that cells are able to communicate and/or migrate across the nonstick part of the pattern. Reprinted with permission from Wu, C.-H., Park, A., & Joester, D. (2011). Bioengineering single crystal growth. Journal of the American Chemical Society, 133, 1658–1661.
FIG. 4
FIG. 4
Dose-dependent effect of rVEGF on spicule morphology (Knapp et al., 2012; Wu, 2013). (A–H) S. purpuratus PMCs treated with increasing concentrations of recombinant VEGF (in ASW containing 4% FBS) show characteristic spicule shapes at 96 hpf in bright field (A), DIC (B–D), and corresponding polarized light microscopy images (E–H): linear rods (A, E: 5 μg mL−1); “h” and “H” shapes (B, F: 15 μg mL−1); large triradiates (C, G: 30 μg mL−1) and small triradiates (D, H: 120 μg mL−1). Note that concentration refers to total protein in raw lysates (BCA) of bacteria expressing rVEGF. Scale bar 100 μm.
FIG. 5
FIG. 5
Comparison of the abundance of selected transcripts in PMCs in vitro (unpublished data) and in whole sea urchin embryos (Tu, Cameron, Worley, Gibbs, & Davidson, 2012). Markers for endoderm (Sp-Endo16), mesoderm (Sp-Gcm), aboral ectoderm (Sp-Spec1), and pigment cells (Sp-Pks1) are depleted by at least 3 orders of magnitude in vitro, while PMC markers (Sp-Alx1, Sp-Tbr, Sp-SM50) are present at comparable abundance. Note that abundance (in FPKM) was normalized to that of Sp-SM50.
FIG. 6
FIG. 6
Gradient mixer custom-built from two 250-mL beakers. The heavy solution is placed in the beaker marked “H,” and the light solution is placed into the beaker marked “L.”
FIG. 7
FIG. 7
Inexpensive stirrers custom-built to stir embryo cultures at 1 Hz.
FIG. 8
FIG. 8
Fertilization membrane stripping tool made from a Nylon mesh tied with a rubber band to a cutoff 50-mL Falcon tube.
FIG. 9
FIG. 9
The “micromere vacuum.” Two holes are drilled into the cap of a 50-mL Falcon tube. Cutoff 1-mL serological pipettes are fitted through these holes and glued in as shown. Tubing is attached to one of the pipettes, and a pipette controller is fitted onto the other pipette.
FIG. 10
FIG. 10
Setup of gradient mixer, peristaltic pump, and receiving beaker for gradient generation. Note that tubing from pump is fixed on the side of the beaker with tape to ensure that liquid runs down the inside wall of the beaker in a continuous, gentle stream. This minimizes mixing at the interface and thus improves gradient quality.
FIG. 11
FIG. 11
Sucrose gradient at 30 min after application of dissociated S. purpuratus embryos. The thin micromere band is visible at the 250 mL mark (arrow). The illumination is ambient, and the background is a black surface.
FIG. 12
FIG. 12
Typical appearance of S. purpuratus PMC cultures grown at 15°C in ASW+HS, at 32 hpf (A), 38 hpf (B), and 48 hpf (C), using bright field contrast.
FIG. 13
FIG. 13
DIC (A, C, E, G) and false color composite of fluorescence images (B, D: f-actin in red (phalloidin-rhodamine) and nuclei in blue (Hoechst); F: membrane in green (FM 1–43), nuclei in red (Hoechst)) of S. purpuratus PMCs grown at low (A/B, G), high (C/D) and intermediate (E/F) rVEGF concentration. Note actin hotspots at growing spicule ends (arrowheads) in B, D; extensive filopodial networks in G (arrowheads).
FIG. 14
FIG. 14
Electron microscope images of S. purpuratus PMCs grown in vitro, sectioned parallel to the cell culture substrate (“en face”). PMCs were treated with 4% (v/v) HS+300 ng/mL rVEGF (A, C) or 4% (v/v) HS (B), and were imaged at 48 hpf, using scanning TEM (STEM) and bright field contrast (A, C) or high angle annular darkfield (HAADF) contrast (B). Scale bar represents 2 μm.

References

    1. Addadi L, Raz S, & Weiner S (2003). Taking advantage of disorder: Amorphous calcium carbonate and its roles in biomineralization. Advanced Materials, 15, 959–970.
    1. Adomako-Ankomah A, & Ettensohn CA (2013). Growth factor-mediated mesodermal cell guidance and skeletogenesis during sea urchin gastrulation. Development, 140, 4214–4225. - PubMed
    1. Amemiya S (1989). Development of the basal lamina and its role in migration and pattern-formation of primary mesenchyme cells in sea-urchin embryos. Development, Growth & Differentiation, 31, 131–145. - PubMed
    1. Ameye L, Compere P, Dille J, & Dubois P (1998). Ultrastructure and cytochemistry of the early calcification site and of its mineralization organic matrix in Paracentrotus lividus (Echinodermata: Echinoidea). Histochemistry and Cell Biology, 110, 285–294. - PubMed
    1. Ameye L, Hermann R, & Dubois P (2000). Ultrastructure of sea urchin calcified tissues after high-pressure freezing and freeze substitution. Journal of Structural Biology, 131, 116–125. - PubMed

Publication types

MeSH terms

LinkOut - more resources