. 2019 May;9(5):646-661.
doi: 10.1158/2159-8290.CD-18-1020. Epub 2019 Feb 18.

Targeting DNA Damage Response Promotes Antitumor Immunity through STING-Mediated T-cell Activation in Small Cell Lung Cancer

Affiliations

Targeting DNA Damage Response Promotes Antitumor Immunity through STING-Mediated T-cell Activation in Small Cell Lung Cancer

Triparna Sen et al. Cancer Discov. 2019 May.

Abstract

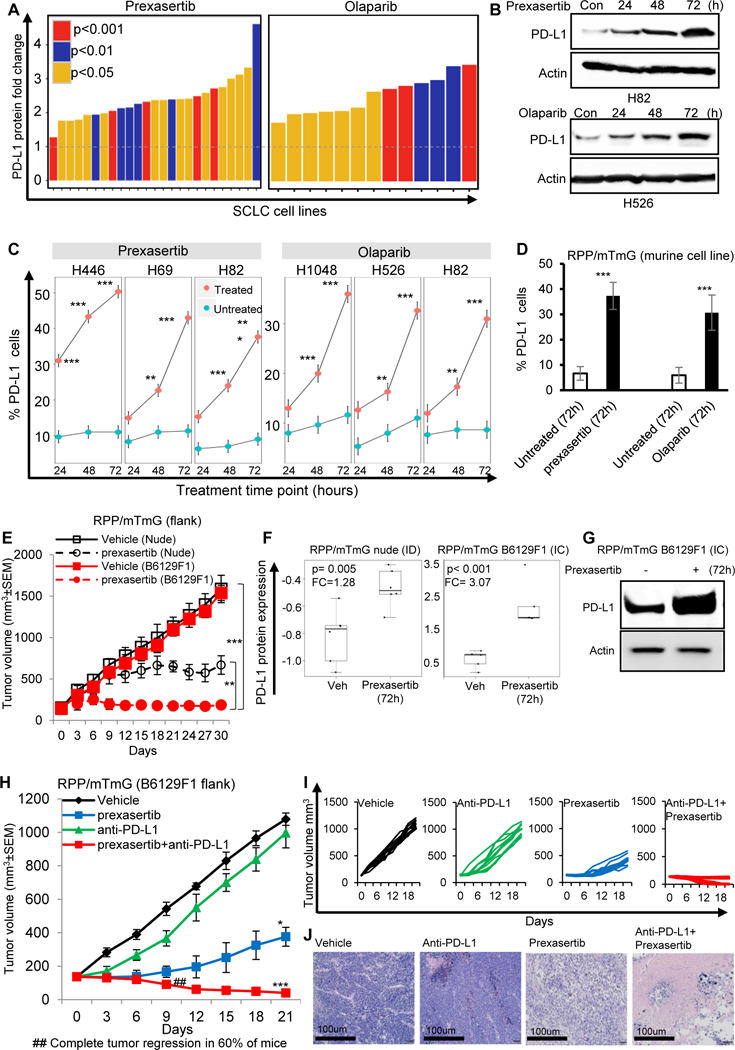
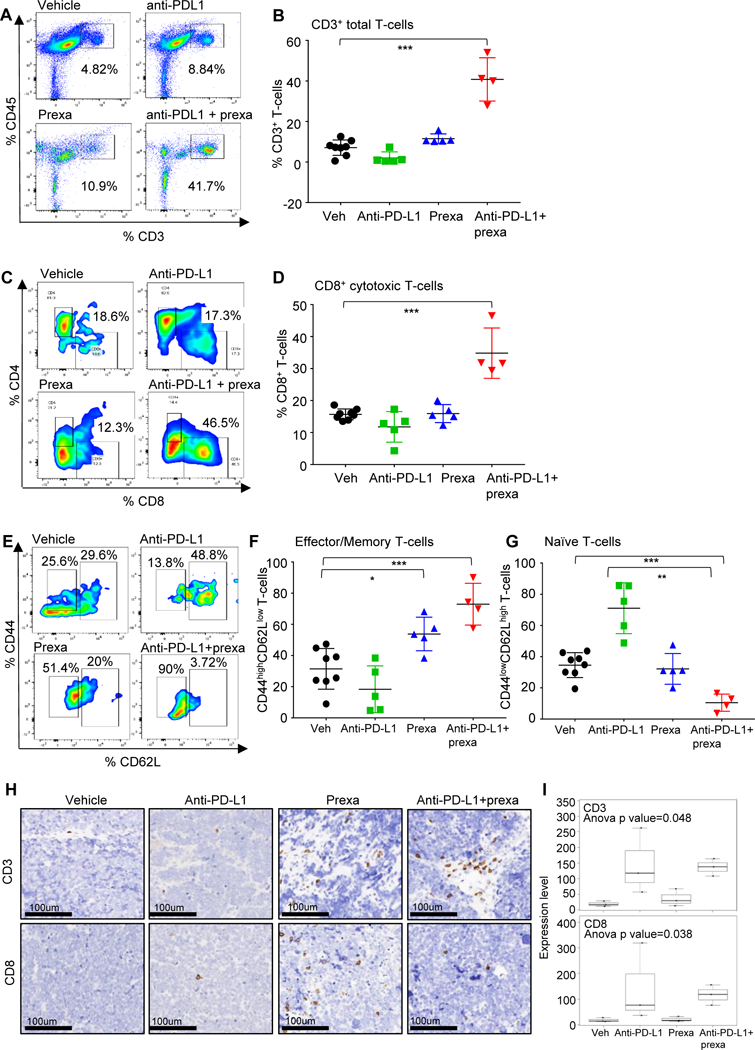
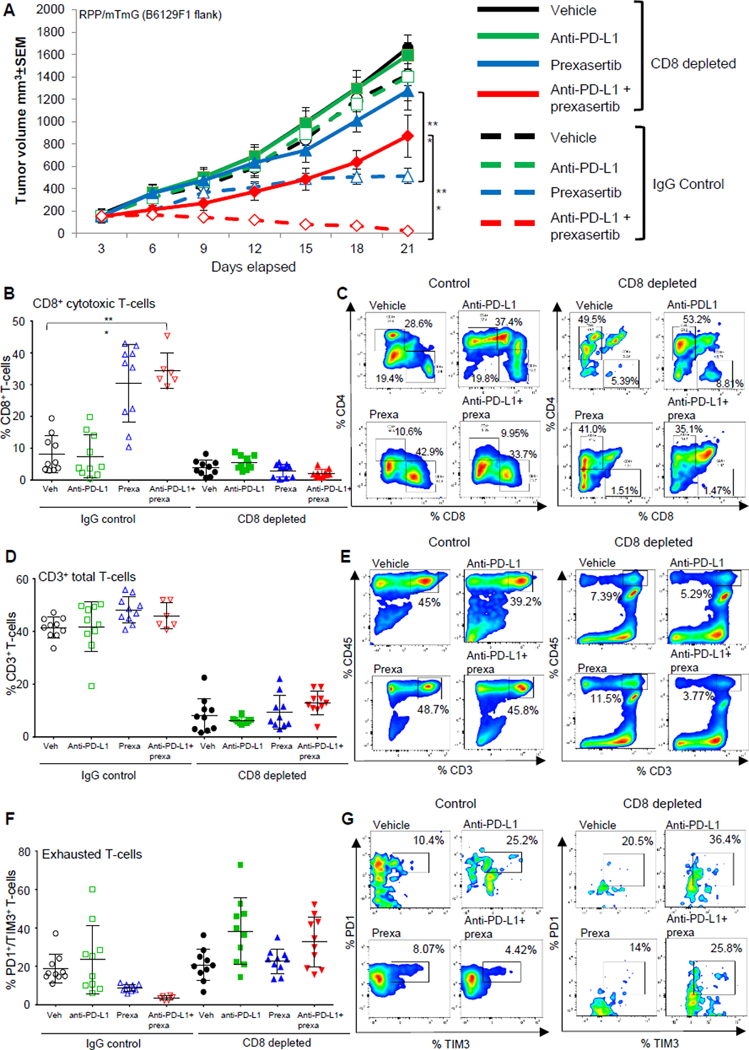
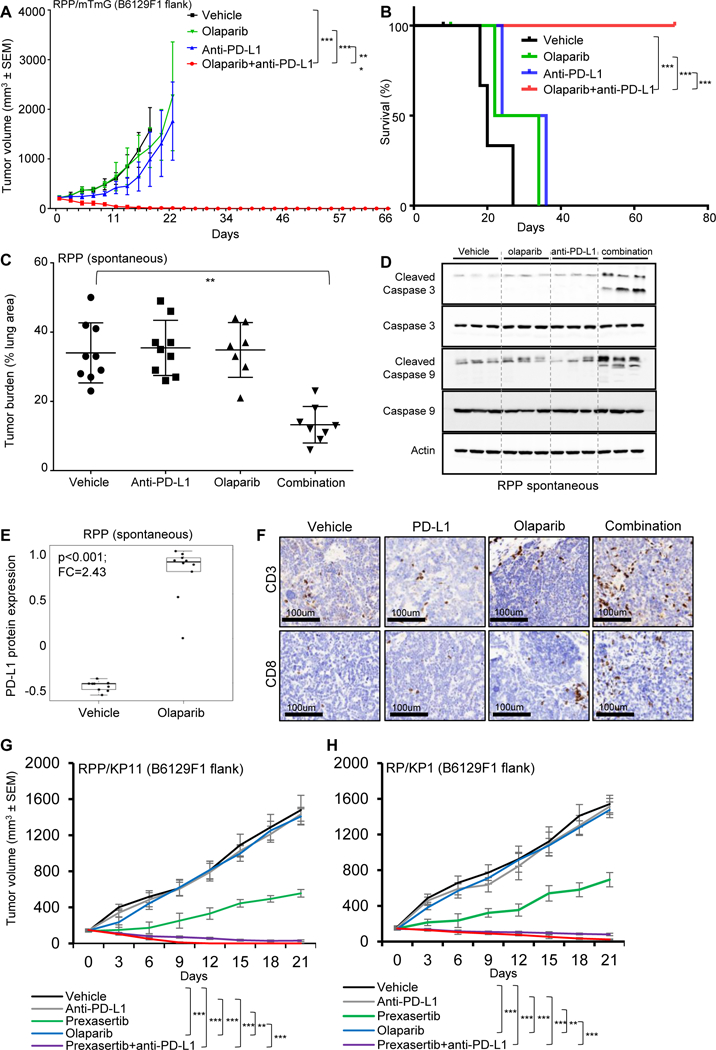
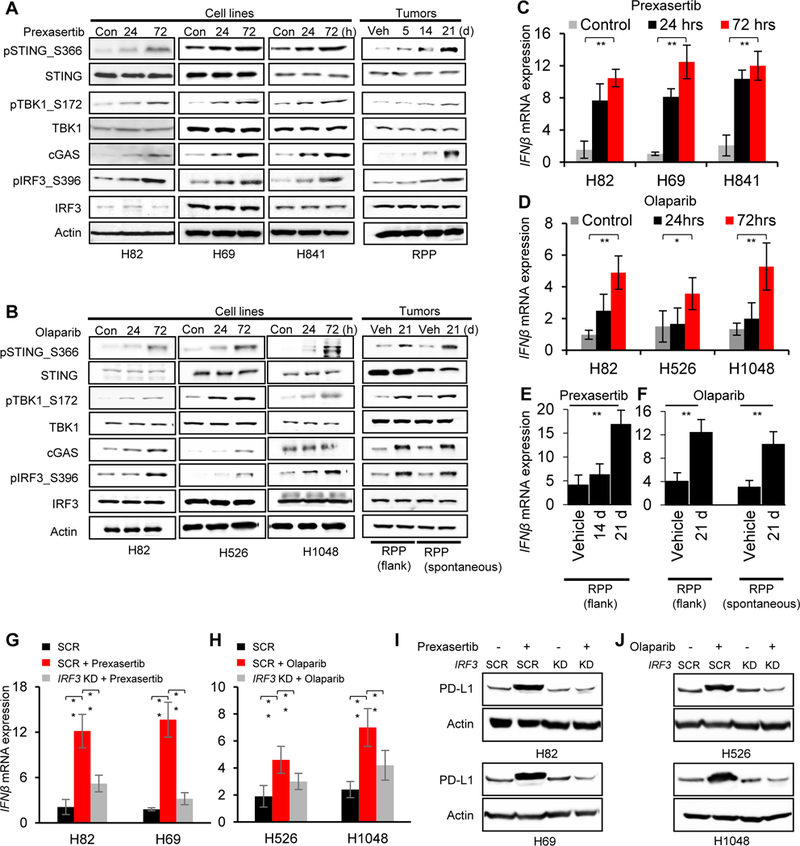
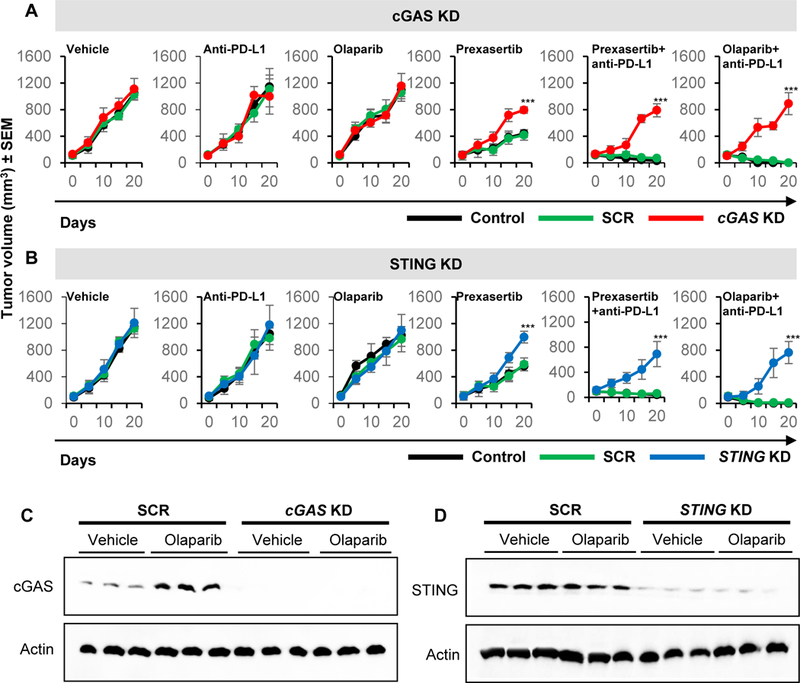
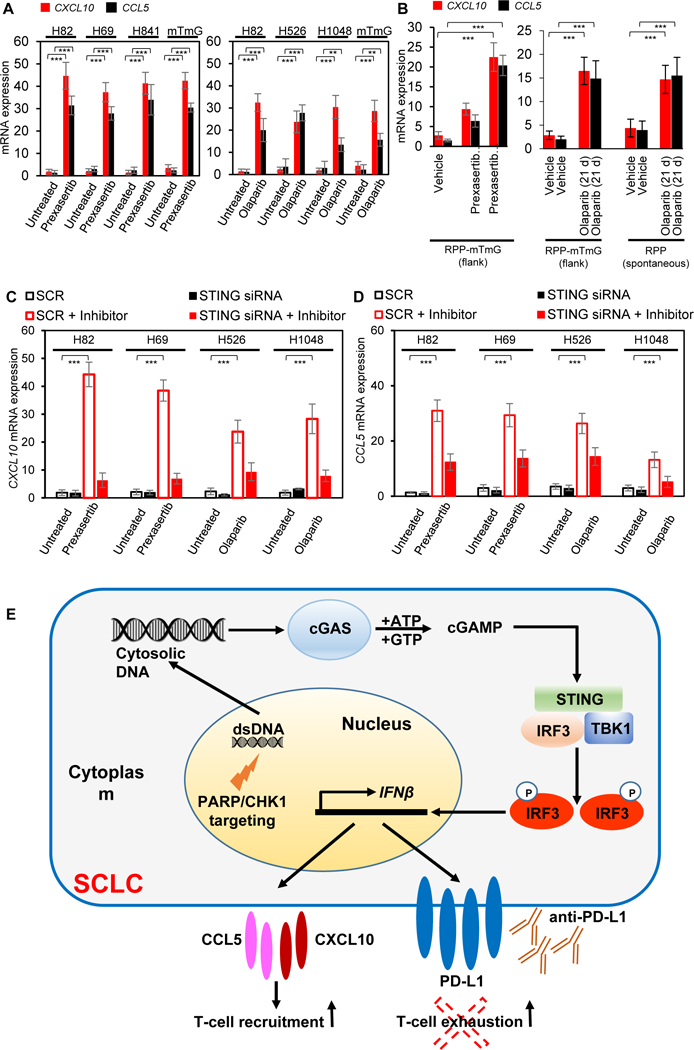
Despite recent advances in the use of immunotherapy, only a minority of patients with small cell lung cancer (SCLC) respond to immune checkpoint blockade (ICB). Here, we show that targeting the DNA damage response (DDR) proteins PARP and checkpoint kinase 1 (CHK1) significantly increased protein and surface expression of PD-L1. PARP or CHK1 inhibition remarkably potentiated the antitumor effect of PD-L1 blockade and augmented cytotoxic T-cell infiltration in multiple immunocompetent SCLC in vivo models. CD8+ T-cell depletion reversed the antitumor effect, demonstrating the role of CD8+ T cells in combined DDR-PD-L1 blockade in SCLC. We further demonstrate that DDR inhibition activated the STING/TBK1/IRF3 innate immune pathway, leading to increased levels of chemokines such as CXCL10 and CCL5 that induced activation and function of cytotoxic T lymphocytes. Knockdown of cGAS and STING successfully reversed the antitumor effect of combined inhibition of DDR and PD-L1. Our results define previously unrecognized innate immune pathway-mediated immunomodulatory functions of DDR proteins and provide a rationale for combining PARP/CHK1 inhibitors and immunotherapies in SCLC. SIGNIFICANCE: Our results define previously unrecognized immunomodulatory functions of DDR inhibitors and suggest that adding PARP or CHK1 inhibitors to ICB may enhance treatment efficacy in patients with SCLC. Furthermore, our study supports a role of innate immune STING pathway in DDR-mediated antitumor immunity in SCLC.See related commentary by Hiatt and MacPherson, p. 584.This article is highlighted in the In This Issue feature, p. 565.


Conflict of interest statement

Conflict of Interest:

Figures

Figure 1:
Figure 1:. DDR inhibition enhances PD-L1 expression in vitro and in vivo and enhances antitumor response of anti-PD-L1 antibody in SCLC.
(A-D) DDR inhibition by targeting with small molecule inhibitors of CHK1 (prexasertib), and PARP (olaparib) enhances the PD-L1 protein expression as measured by RPPA (A) and immunoblot analysis (B); and increases PD-L1 surface expression, as measured by flow cytometry in human (C) and murine (D) SCLC cell lines. (E) Tumor growth curve of immunocompetent B6129F1 (red lines) model and immunocompromised nude (black lines) SCLC RPP/mTmG (flank) models treated with CHK1 inhibitor, prexasertib (12mg/kg, BID, 2 out of 7 days) for 30 days. Prexasertib showed enhanced anti-tumor efficacy in immunocompetent model (TC=0.13; p<0.0001) as compared to immunocompromised model (T/C=0.47; p<0.01). (F) Prexasertib treatment enhanced PD-L1 protein expression in SCLC tumors, with improved enhancement of PD-L1 expression in immunocompetent (IC) RPP/mTmG B6129F1 model (FC=3.07; p<0.001) as compared to immunodeficient (ID) RPP/mTmG nude model (FC=1.28; p=0.005). (G) Immunoblot analysis confirms higher PD-L1 protein expression post-prexasertib treatment in immunocompetent (IC) RPP/mTmG B6129F1 model. (H-I) Tumor growth curves +/− SEM (H) and for each RPP/mTmG B6129F1 mouse (I) from vehicle (black, n=10, median tumor volume=1110mm3), prexasertib alone (10mg/kg, 2 out of 7 days, BID) (blue, n=10, median tumor volume=410mm3), anti-PD-L1 alone (300μg, 1 out of 7 days, ip) (green, n=10, median tumor volume=1020mm3) and prexasertib+anti-PD-L1 (red, n=10, median tumor volume=40mm3). (J) Representative H&E of the tumor sections from vehicle, prexasertib alone, anti-PD-Ll alone and combination treated group. Scale bar 100μm. All data represent at least three independent experiments. Means ± SEM are plotted. In all panels- *p<0.05, **p<0.01, ***p<0.0001, ns-not significant.
Figure 2:
Figure 2:. Analysis of immune infiltrates of tumors after CHK1i.
(A-H) SCLC tumors in Fig 1H were harvested at Day 21 and the immune profiling was analyzed by FACS at the endpoint, the representative plots and cumulative data for all the tumors is shown. FACS analysis of CD3+CD45+ Total T-cells (A-B), CD3+CD45+CD8+ cytotoxic T-cells (C-D), effector memory CD8 T cells: CD45+CD3+CD8+CD44highCD62Llow (E-F) and naïve T-cells CD45+CD3+CD8+CD44low CD62Lhigh (E, G) from the endpoint primary tumors. The statistical summary is shown with ANOVA test. ns, no significance; *, p < 0.05; **, p < 0.001; ***, p < 0.0001. (H-I) The CD3 and CD8 IHC staining were performed in tumors from the resected tumors at Day 21 (from Fig 1H). Representative images of staining intensity are shown (H). The staining intensity and percentage of positive cells were analyzed and used to generate an H-score for each sample that passed quality control. Samples were stratified as CD3/8+ (+1, +2, +3), CD3/8- (0 and lower). The percent of each expression pattern of CD3 and CD8 IHC staining was summarized and shown in the bar chart (I).
Figure 3:
Figure 3:. CD8+ T-cells are required for anti-tumor immunity induced by CHK1i with or without anti-PD-L1 blockade.
(A) Tumor growth curves +/−SEM from vehicle, prexasertib alone (10mg/kg, 2 out of 7 days, BID), anti-PD-L1 alone (300μg, 1 out of 7 days) and prexasertib+anti-PD-L1 treatment groups in RPP B6 mice in IgG control and CD8-depleted (anti-CD8, 200μg, 2 out of 7 days) groups. (B-C) CD8+ T cells measured by flow cytometric analysis in single-cell suspensions prepared from tumors (n=10) in CD8-depleted groups as compared to IgG control groups. The analysis was independently repeated at least three times. t-test, p<0.0001. (D-H) SCLC tumors in Fig 3A were harvested at Day 21 and the immune profiling was analyzed by FACS at the endpoint, the representative plots and cumulative data for all the tumors is shown. FACS analysis of CD3+CD45+ Total T-cells (D-E), exhausted CD8 T cells: CD45+CD3+CD8+PD-1+TIM3+ (F-G) from the endpoint primary tumors. The statistical summary is shown with ANOVA test. ns, no significance; *, p < 0.05; **, p < 0.001; ***, p < 0.0001.
Figure 4:
Figure 4:. PARP inhibition augments anti-PD-L1 antibody-induced antitumor immunity.
(A-B) B6129F1 mice were injected with murine RPP derived from SCLC in a genetically engineered mice with conditional loss of Trp53, p130, and Rb1. Tumor volume changes (means +/− standard error of the mean [SEM; error bars]) (A) and survival of mice (B) treated with IgG (10mg/kg, 3 out of 7 days), anti-PD-L1 (10mg/kg. 3 out of 7 days), olaparib (50mg/kg, 5 out of 7 days) and the combination (n=5 per group) up to 80 days. For the survival curve the p value was established by the Mantel-Cox test. (C) Quantification of tumor burden as a percentage of lung area in Trp53/Rb1/p130-knockout mice treated with vehicle IgG, olaparib (50 mg/kg, 5 out of 7 days), anti-PD-L1 (300μg, 1 out of 7 days) or combination (one random lung section quantified per mouse). (D) Immunoblot analysis of tumors treated with vehicle, olaparib, anti-PD-Ll and combination resected at Day 21. Analysis performed for a panel of apoptosis markers, pro and cleaved caspase 3 and 9. Actin was used a loading control. (E) Olaparib treatment enhanced PD-L1 protein expression in RPP spontaneous tumors as measured by RPPA analysis (FC=2.43; p<0.001). (F) The CD3 and CD8 IHC staining were performed in tumors from the resected tumors from Fig 4C. Representative images of staining intensity are shown. The staining intensity and percentage of positive cells were analyzed and used to generate an H-score for each sample that passed quality control. Samples were stratified as CD3/8+ (+1, +2, +3), CD3/8- (0 and lower). (G-H) B6129F1 mice were injected with an additional cell line derived from RPP model (KP11) and from RP model (derived from SCLC in a genetically engineered mice with conditional loss of Trp53, and Rb1), KP1. Tumor volume changes (means +/− standard error of the mean [SEM; error bars]) of KP11 (G) and KP1 (H) treated with IgG, anti-PD-L1 (300pg, 1/7), olaparib (50mg/kg, 5 out of 7 days), prexasertib (10mg/kg, 2 out of 7 days, BID), combination of olaparib and anti-PD-L1 and combination of prexasertib and anti-PD-L1 (n=6 per group) treated for 21 days.
Figure 5:
Figure 5:. Anti-tumor immune response post-DDR targeting is mediated via STING-TBK1-IRF3 pathway in SCLC.
(A-B) Immunoblots of markers in the STING pathway including total and phospho STING (S366), total and phospho TBK1 (S172), cGAS, total and phospho IRF3 (S396) in lysates collected from SCLC cell lines and tumors treated with prexasertib (A) or olaparib (B). Actin served as a loading control. (C-D) Quantitative PCR (qPCR) measurement of IFNβ mRNA expression in SCLC cell lines 24 and 72 hours after prexasertib (C) and olaparib (D) treatment. (E-F) Quantitative PCR (qPCR) measurement of IFNβ mRNA expression in SCLC tumor models after treatment with prexasertib in RPP flank model (E) and olaparib in RPP flank and spontaneous (F) SCLC in vivo models. (G-H) qPCR measurement of IFNβ mRNA expression 72 hours after treatment with prexasertib (G) and olaparib (H). IRF3 expression was knocked down 24 hours prior to drug treatment using siRNA targeting IRF3. A scrambled siRNA control (SCR) is included. All data representative of mean ± SD and p values represented as * p<0.05, **p<0.001, ***p<0.0001. (I-J) Immunoblot of PD-L1 in SCLC cells treated with prexasertib (I) and olaparib (J) (72 hours). IRF3 expression was knocked down in all cells 24 hours prior to drug treatment using siRNA targeting IRF3. A scrambled siRNA control (SCR) is included.
Figure 6:
Figure 6:. Knockdown of cGAS and STING reverses the anti-tumor effect of combined DDR and PD-L1 blockade in vivo:
(A-B) Tumor growth curves +/−SEM from vehicle, prexasertib alone (10mg/kg, 2 out of 7 days, BID), olaparib alone (50mg/kg, 5 out of 7 days), anti-PD-L1 alone (300μg, 1 out of 7 days), prexasertib+anti-PD-L1 and olaparib+anti-PD-L1 treatment groups in B6129 mice with RPP/mTmG parental control (Con), scrambled (SCR), cGAS knockdown (A) and STING knockdown (B) groups. (C-D) Immunoblot analysis for cGAS and STING of tumors resected at the end of treatment (Day 21) from SCR or cGAS and STING knockdown models treated with either vehicle or olaparib. Actin used as loading control.
Figure 7:
Figure 7:. Role of STING pathway in DDR-targeting dependent chemokine expression:
(A-B) RT-qPCR measurement of chemokines CXCL10 (red) and CCL5 (black) mRNA extracted from SCLC cell lines treated with prexasertib (left panel) and olaparib (right panel) for 72 hours (A) and tumors treated with prexasertib (RPP flank-left panel) and olaparib (RPP flank and spontaneous model- right panel) after 1 cycle of treatment (B). (C-D) qPCR measurement of CXCL10 (C) and CCL5 (D) mRNA 72 hours following knockdown of STING using siRNA in SCLC cell lines normalized to a non-targeting scrambled control (SCR) post-prexasertib and olaparib (inhibitor) treatment. (E) Model for STING pathway activation in response to DDR targeting in SCLC. In the proposed model, targeting the DDR proteins PARP and CHK1 with the small molecule inhibitors prexasertib and olaparib leads to cytosolic DNA in SCLC models. The cytosolic DNA is then recognized by cGAS, which leads to activation of the STING/TBK1/IRF3 pathway. IRF activation leads to increased expression of IFNβ and enhanced expression of the chemokines CXCL10 and CCL5. STING pathway activation and increased chemokine expression lead to increased PD-L1 expression and T-cell recruitment in SCLC models. Finally, DDR co-targeting leads to enhanced antitumor immunity in SCLC models.

Comment in

References

    1. Ribas A, Wolchok JD. Cancer immunotherapy using checkpoint blockade. Science (New York, NY) 2018;359(6382):1350–5 doi 10.1126/science.aar4060. - DOI - PMC - PubMed
    1. Sharma P, Allison JP. The future of immune checkpoint therapy. Science (New York, NY) 2015;348(6230):56–61 doi 10.1126/science.aaa8172. - DOI - PubMed
    1. Topalian SL, Drake CG, Pardoll DM. Immune checkpoint blockade: a common denominator approach to cancer therapy. Cancer cell 2015;27(4):450–61 doi 10.1016/j.ccell.2015.03.001. - DOI - PMC - PubMed
    1. Ferris RL, Blumenschein G Jr., Fayette J, Guigay J, Colevas AD, Licitra L, et al. Nivolumab for Recurrent Squamous-Cell Carcinoma of the Head and Neck. The New England journal of medicine 2016;375(19):1856–67 doi 10.1056/NEJMoa1602252. - DOI - PMC - PubMed
    1. Reck M, Rodriguez-Abreu D, Robinson AG, Hui R, Csoszi T, Fulop A, et al. Pembrolizumab versus Chemotherapy for PD-L1-Positive Non-Small-Cell Lung Cancer. The New England journal of medicine 2016;375(19):1823–33 doi 10.1056/NEJMoa1606774. - DOI - PubMed

Publication types

MeSH terms