. 2019 May;9(5):662-679.
doi: 10.1158/2159-8290.CD-17-1444. Epub 2019 Feb 18.

BCL6 Evolved to Enable Stress Tolerance in Vertebrates and Is Broadly Required by Cancer Cells to Adapt to Stress

Affiliations

BCL6 Evolved to Enable Stress Tolerance in Vertebrates and Is Broadly Required by Cancer Cells to Adapt to Stress

Tharu M Fernando et al. Cancer Discov. 2019 May.

Abstract

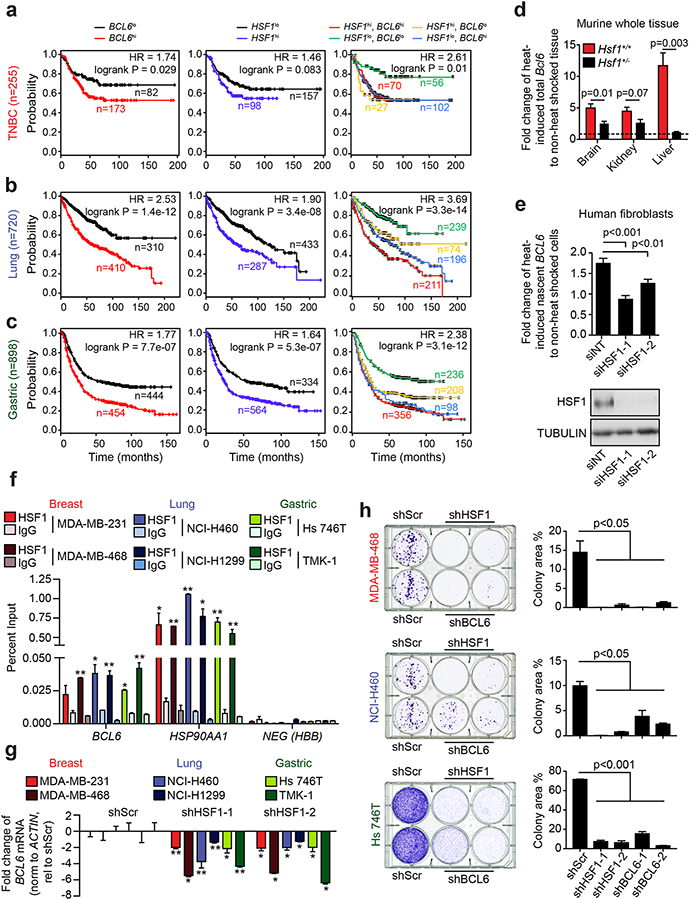
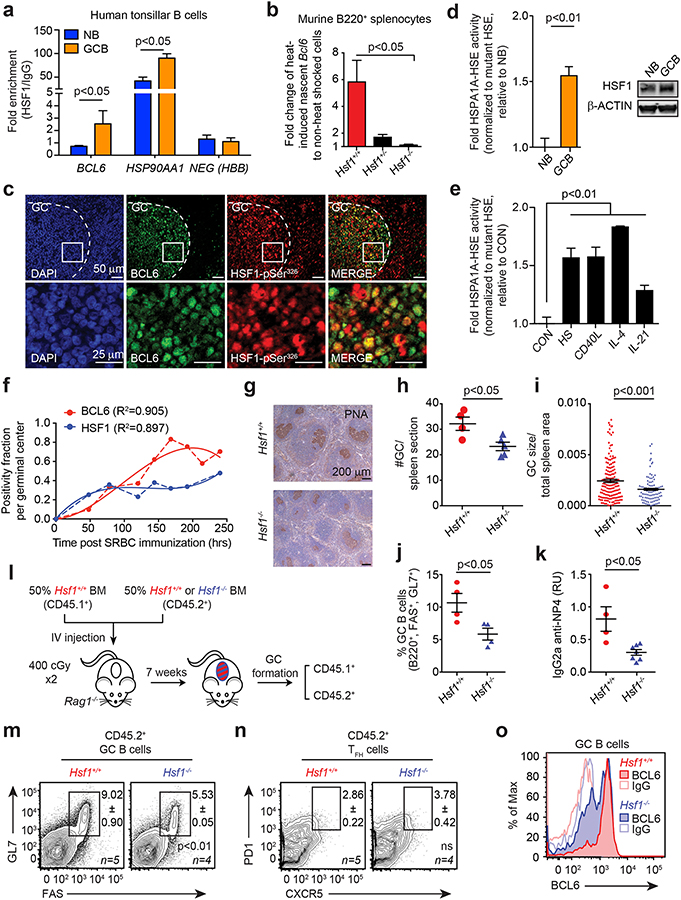
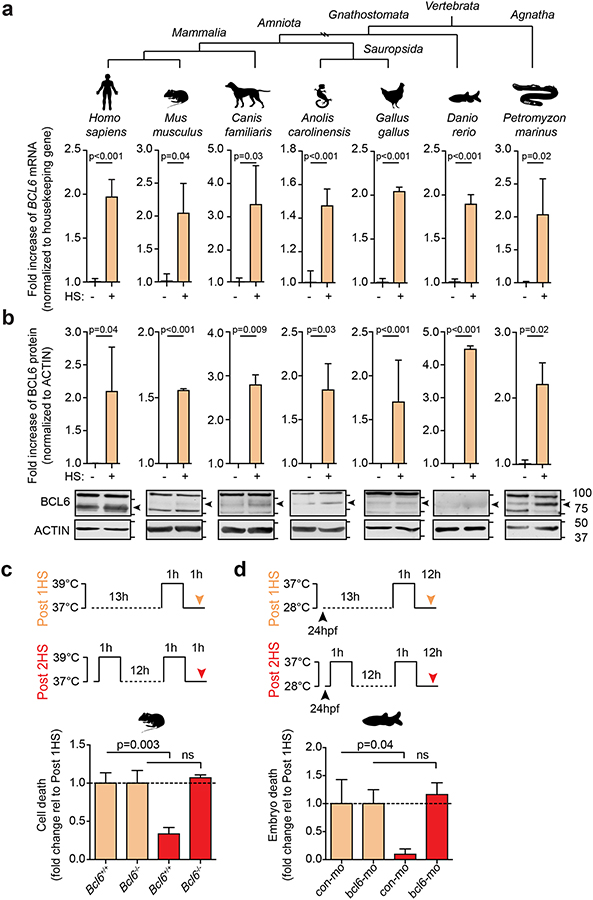
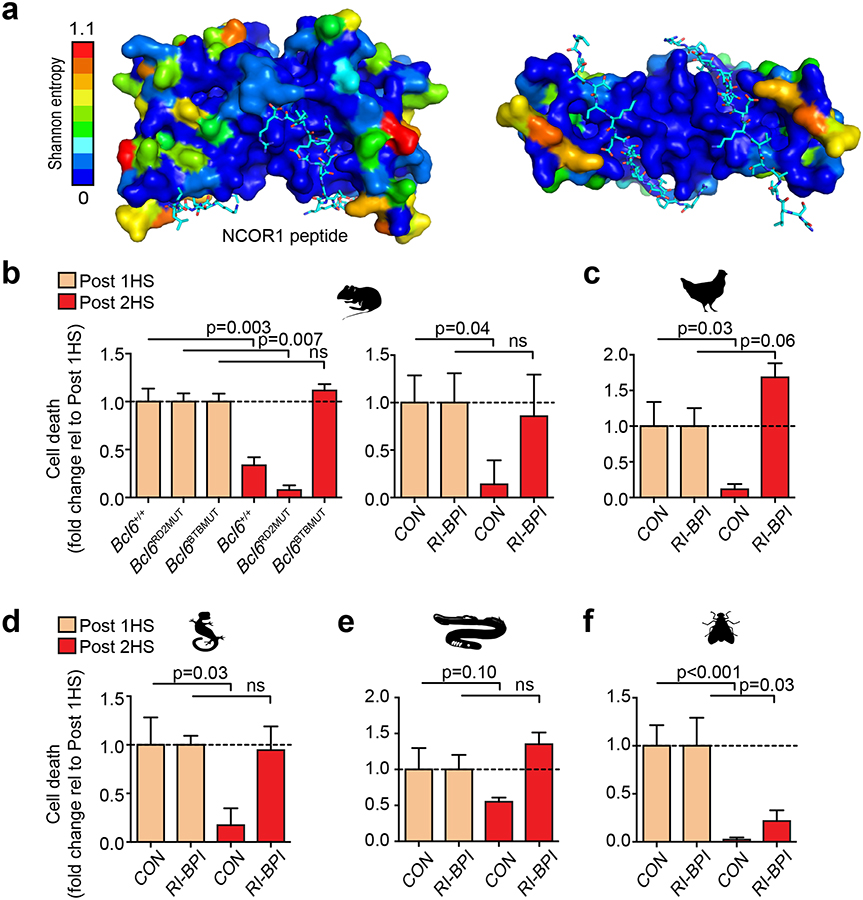
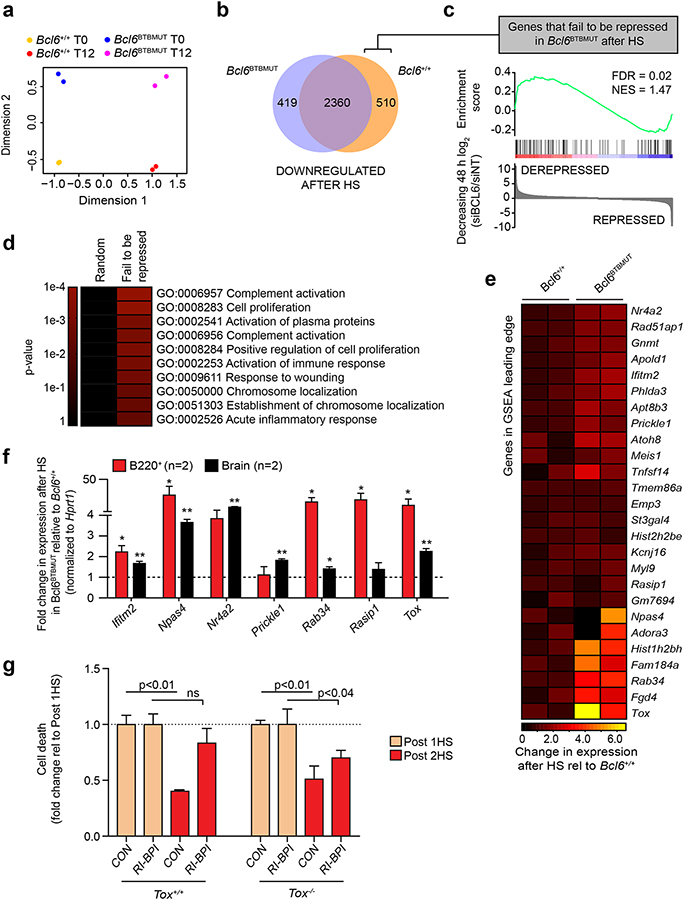
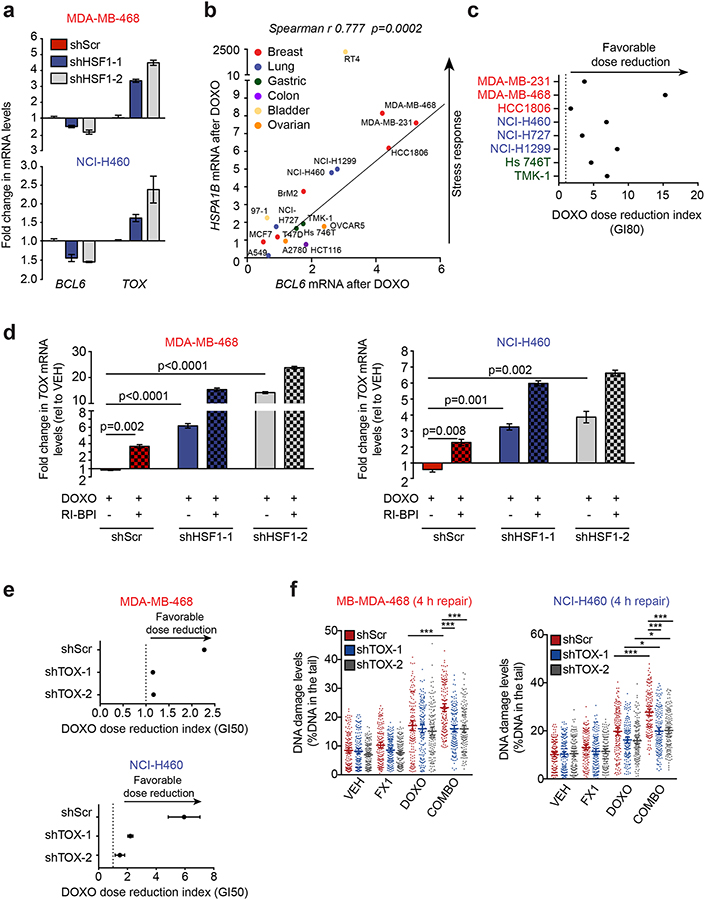
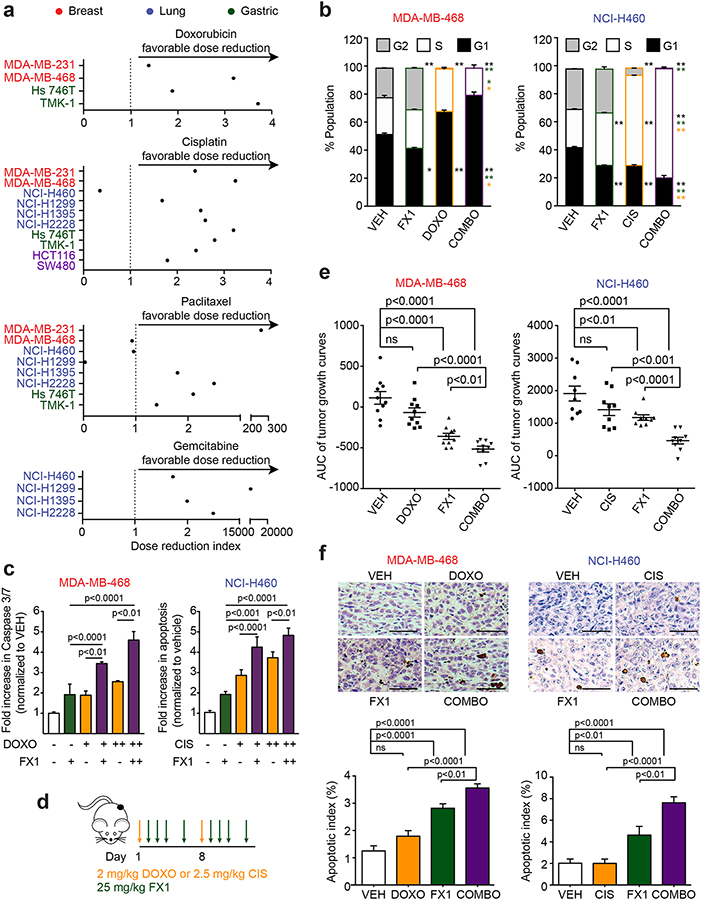
Several lines of evidence link the canonical oncogene BCL6 to stress response. Here we demonstrate that BCL6 evolved in vertebrates as a component of the HSF1-driven stress response, which has been co-opted by the immune system to support germinal center formation and may have been decisive in the convergent evolution of humoral immunity in jawless and jawed vertebrates. We find that the highly conserved BTB corepressor binding site of BCL6 mediates stress adaptation across vertebrates. We demonstrate that pan-cancer cells hijack this stress tolerance mechanism to aberrantly express BCL6. Targeting the BCL6 BTB domain in cancer cells induces apoptosis and increases susceptibility to repeated doses of cytotoxic therapy. The chemosensitization effect upon BCL6 BTB inhibition is dependent on the derepression of TOX, implicating modulation of DNA repair as a downstream mechanism. Collectively, these data suggest a form of adaptive nononcogene addiction rooted in the natural selection of BCL6 during vertebrate evolution. SIGNIFICANCE: We demonstrate that HSF1 drives BCL6 expression to enable stress tolerance in vertebrates. We identify an HSF1-BCL6-TOX stress axis that is required by cancer cells to tolerate exposure to cytotoxic agents and points toward BCL6-targeted therapy as a way to more effectively kill a wide variety of solid tumors.This article is highlighted in the In This Issue feature, p. 565.


Conflict of interest statement

Disclosure of potential conflicts of interest:

A.M. reports receiving commercial research grants from Janssen. L.C. receives research funds from Celgene and Karyopharm. No potential conflicts of interest were disclosed by the other authors.

Figures

Figure 1.
Figure 1.. Tumor cells aberrantly express BCL6 in an HSF1-dependent manner.
a-c, Kaplan-Meier curves of progression free survival of triple-negative breast cancer (a), lung adenocarcinoma (b) and gastric cancer (c) patients stratified by BCL6, HSF1 or BCL6 and HSF1 expression. n, number of patients. d, BCL6 mRNA in heat-shocked tissues of Hsf1+/+ and Hsf1+/− mice (n=3 mice per genotype). e, Nascent BCL6 mRNA in heat-shocked normal human adult fibroblasts transfected with nontargeting (siNT) or HSF1 siRNAs (siHSF1) with accompanying immunoblot for HSF1 (bottom) (representative of 3 biological replicates). f, Enrichment of HSF1 at the BCL6 promoter in cancer cell lines in triplicates. *p<0.05; **p<0.01 (representative of 3 biological replicates). g, BCL6 mRNA after cell lines were transduced with control (shScr) or HSF1-targeting shRNAs in triplicates *p<0.05; **p<0.01 (representative of 3 biological replicates). h, Representative colony forming assays (left) and quantification (right) of cancer cells transduced with control (shScr), HSF1-targeting shRNAs or BCL6-targeting shRNAs (representative of at least two biological replicates). See Supplementary Fig. 2h and 2j for immunoblots. P values were calculated by two-sided T-test. Data presented as mean ± s.e.m.
Figure 2.
Figure 2.. B-cells require HSF1-dependent BCL6 induction for optimal germinal center formation.
a, Enrichment of HSF1 in NB and GC B-cells at the BCL6 promoter, HSP90AA1 promoter and a negative control HBB (representative of 3 biological replicates). b, Nascent Bcl6 mRNA in heat shocked murine B220+ splenocytes of Hsf1+/+, Hsf1+/− and Hsf1−/− mice normalized to Hprt1 (n=3 mice per genotype). c, Immunofluorescence of paraffin-embedded serial human tonsillar sections. d, AlphaLisa activity of HSPA1A HSE from nuclear protein of human tonsillar NB and GC B-cells (n=5 pooled replicates) with accompanying immunoblot for total HSF1 (right). e, AlphaLisa activity of the consensus HSPA1A HSE from nuclear protein from human splenic NBs resting (CON), heat-shocked (HS) or treated with immune stimuli (n=4–7 pooled replicates). f, Fraction of PNA+ HSF1+ (blue) or PNA+ BCL6+ (red) cells per GC post-immunization as a function of time. Polynomial fits (solid line) of real data points (dashed line) are shown. g-j, Representative PNA staining (g), GC size (h), GC number (i) and percentage (j) of Hsf1+/+ and Hsf1−/− mice after immunization (n=4 mice per genotype). k, Titers of high-affinity NP-specific IgG2a from Hsf1+/+ and Hsf1−/− mice after immunization with NP-CGG (mean ± s.e.m., n=4–6 mice per genotype). l-n, Bone marrow chimeras generated with CD45.1+ Hsf1+/+ and CD45.2+ Hsf1+/+ or Hsf1−/− mice (l). Representative flow cytometry plot of CD45.2+ GC B-cells (m) and GC TFH cells (n) from mice after immunization (n=4–5 mice per genotype). See Supplementary Fig. 3c–e for chimerism and CD45.1+ GC B-cells and GC TFH cells. o, BCL6 staining intensity in splenic GC B-cells from Hsf1+/+ and Hsf1−/− mice after immunization. P values were calculated by two-sided T-test. Data presented as mean ± s.e.m.
Figure 3.
Figure 3.. BCL6 is upregulated in response to stress and mediates cell adaptation to repeated stress.
a-b, BCL6 mRNA (a) and protein (b) in heat-shocked human adult fibroblasts, murine BCL1 B-cells, dog Cf2Th thymocytes, iguana IgH-2 epithelial cells, chicken DT40 B-cells, zebrafish embryos and sea lamprey typhlosole tissue (n=3 biological replicates). c-d, Serial stress assays where cells were heat shocked once (tan) or serially heat shocked (red). Fold change of cell death in murine B220+ splenocytes from Bcl6+/+ and Bcl6−/− (n=3–5 mice per group) (c) or zebrafish embryos injected with control or bcl6 morpholino (mo) (n=3 biological replicates, 75–100 embryos per experiment) (d). See Supplementary Fig. 4d for immunoblots and QPCR of BCL6 knockdown. P values were calculated by two-sided T-test. Data presented as mean ± s.e.m.
Figure 4.
Figure 4.. The lateral groove of the BCL6 BTB domain mediates cell adaptation to repeated stress
. a, Shannon entropy values mapped onto the structure of BCL6 BTB domain. NCOR1 peptide shown in cyan. b, Fold change of cell death in murine B220+ splenocytes from Bcl6+/+, Bcl6RD2MUT, Bcl6BTBMUT or Bcl6+/+ treated with vehicle or RI-BPI that were heat shocked either once (tan) or serially heat shocked (red) (n=3–5 mice per group). c-f, Fold change of cell death in chicken DT40 B-cells (c), iguana IgH-2 epithelial cells (d), sea lamprey typhlosole cells (e) and drosophila S2 cells (f) treated with either vehicle (CON) or RI-BPI and heat shocked once (tan) or serially heat shocked (red) (n=3–6 biological replicates). P values were calculated by two-sided T-test. Data presented as mean ± s.e.m.
Figure 5.
Figure 5.. BCL6BTB-mediated repression of TOX is required for cell adaptation to repeated stress. a
, Multi-dimensional scaling plot of the leading biological coefficient of variation between samples using the 500 most variable genes in Bcl6+/+ (n=2) and Bcl6BTBMUT (n=2) B220+ splenocytes before (T0) and 12 h after a single heat shock (T12). b, Venn diagram of genes significantly (FDR < 0.05) downregulated after heat shock that are common and unique to Bcl6+/+ and Bcl6BTBMUT B220+ cells. c, GSEA of genes that fail to be repressed in Bcl6BTBMUT B220+ splenocytes after heat shock with gene expression changes in DLBCL cells after BCL6 knockdown. d, Gene ontology analysis of genes that fail to be repressed in Bcl6BTBMUT B220+ splenocytes after heat shock. Enrichment was measured using hypergeometric p values. e, Heatmap of gene expression changes after heat shock of the GSEA leading edge genes described in (c). f, Gene expression changes after heat shock in B220+ splenocytes and brain tissue of Bcl6BTBMUT relative to Bcl6+/+ (mean ± s.e.m., n=2 mice per group). g, Fold change of cell death in Tox+/+ and Tox−/− B220+ splenocytes treated with RI-BPI and serially heat shocked (mean ± s.e.m., n=2–4 mice per group). P values were calculated by two-sided T-test unless otherwise stated.
Figure 6.
Figure 6.. HSF1-BCL6BTB-TOX stress tolerance axis is active in cancer cells and promotes chemoresistance by enhancing DNA repair.
a, BCL6 and TOX mRNA in MDA-MB-468 and NCI-H460 cells transduced with HSF1-targeting shRNAs (n=3 biological replicates). b, BCL6 and HSPA1B mRNAs after doxorubicin (DOXO) in cancer cells (representative of at least 3 biological replicates). c, Dose reduction index of RI-BPI and DOXO in solid tumor cell lines (representative of 2–3 biological replicates). d, TOX expression in doxorubicin-treated MDA-MB-468 (100 nM) and NCI-H460 (200 nM) transduced with HSF1-targeting shRNAs and/or treated with 10 μM RI-BPI (representative of 3 biological replicates). e, Dose reduction index of RI-BPI and DOXO of breast cancer cell lines transduced with TOX-targeting hairpins (representative of 3 biological replicates). f, Comet assay showing amount of residual DNA damage after 4 h of repair in TOX-silenced MDA-MB-468 and NCI-H460 cells exposed to 200 nM doxorubicin or 25 μM FX1, alone or in combination (representative of 3 biological replicates).
Figure 7.
Figure 7.. BCL6BTB inhibition overcomes chemotherapy tolerance in cancer cells by inducing apoptosis and cell cycle arrest.
a, Dose reduction index of FX1 when combined with doxorubicin, cisplatin, paclitaxel and gemcitabine in relevant tumor models (doxorubicin: breast, gastric; cisplatin: breast, lung, gastric and colon; paclitaxel: breast, lung and gastric; gemcitabine: lung). b, Cell cycle analysis of MDA-MB-468 and NCI-H460 cells exposed to vehicle, 200 nM doxorubicin (MDA-MB-468) or 5.0 μM cisplatin (NCI-H460), 25 μM FX1 or their combination at 24 h. *p<0.05; **p<0.01. Black asterisks represent significance relative to VEH alone; green asterisks represent significance relative to FX1 alone; orange asterisks represent significance relative to DOXO/CIS alone. c, Caspase 3/7 activity in MDA-MB-468 and NCI-H460 cells exposed to vehicle, 100–200 nM doxorubicin (MDA-MB-468) or 2.5–5.0 μM cisplatin (NCI-H460), 25 μM FX1 or their combination (representative of three biological replicates). d, Schematic of dosing schedule for xenograft experiments. e, Area under the curve (AUC) of the tumor growth curves of MDA-MB-468 and NCI-H460 xenografted mice treated with vehicle, doxorubicin (MDA-MB-468) or cisplatin (NCI-H460), FX1 or their combination (n=9–10 mice per group). f, Representative TUNEL staining and quantification of apoptotic index of MDA-MB-468 and NCI-H460 xenografts from (e). P values were calculated by two-sided T-test. Data presented as mean ± s.e.m.

References

    1. Hatzi K, Melnick A. Breaking bad in the germinal center: how deregulation of BCL6 contributes to lymphomagenesis. Trends Mol Med 2014;20(6):343–52 doi 10.1016/j.molmed.2014.03.001. - DOI - PMC - PubMed
    1. Walker SR, Liu S, Xiang M, Nicolais M, Hatzi K, Giannopoulou E, et al. The transcriptional modulator BCL6 as a molecular target for breast cancer therapy. Oncogene 2015;34(9):1073–82 doi 10.1038/onc.2014.61. - DOI - PMC - PubMed
    1. Deb D, Rajaram S, Larsen JE, Dospoy PD, Marullo R, Li LS, et al. Combination Therapy Targeting BCL6 and Phospho-STAT3 Defeats Intratumor Heterogeneity in a Subset of Non-Small Cell Lung Cancers. Cancer Res 2017;77(11):3070–81 doi 10.1158/0008-5472.CAN-15-3052. - DOI - PMC - PubMed
    1. Xu L, Chen Y, Dutra-Clarke M, Mayakonda A, Hazawa M, Savinoff SE, et al. BCL6 promotes glioma and serves as a therapeutic target. Proc Natl Acad Sci U S A 2017;114(15):3981–6 doi 10.1073/pnas.1609758114. - DOI - PMC - PubMed
    1. Dent AL, Shaffer AL, Yu X, Allman D, Staudt LM. Control of Inflammation, Cytokine Expression, and Germinal Center Formation by BCL-6. Science 1997;276(5312):589–92. - PubMed

Publication types

MeSH terms