

A deep proteome and transcriptome abundance atlas of 29 healthy human tissues
- PMID: 30777892
- PMCID: PMC6379049
- DOI: 10.15252/msb.20188503
A deep proteome and transcriptome abundance atlas of 29 healthy human tissues
Abstract
Genome-, transcriptome- and proteome-wide measurements provide insights into how biological systems are regulated. However, fundamental aspects relating to which human proteins exist, where they are expressed and in which quantities are not fully understood. Therefore, we generated a quantitative proteome and transcriptome abundance atlas of 29 paired healthy human tissues from the Human Protein Atlas project representing human genes by 18,072 transcripts and 13,640 proteins including 37 without prior protein-level evidence. The analysis revealed that hundreds of proteins, particularly in testis, could not be detected even for highly expressed mRNAs, that few proteins show tissue-specific expression, that strong differences between mRNA and protein quantities within and across tissues exist and that protein expression is often more stable across tissues than that of transcripts. Only 238 of 9,848 amino acid variants found by exome sequencing could be confidently detected at the protein level showing that proteogenomics remains challenging, needs better computational methods and requires rigorous validation. Many uses of this resource can be envisaged including the study of gene/protein expression regulation and biomarker specificity evaluation.
Keywords: RNA‐Seq; human proteome; human transcriptome; proteogenomics; quantitative mass spectrometry.
© 2019 The Authors. Published under the terms of the CC BY 4.0 license.
Figures
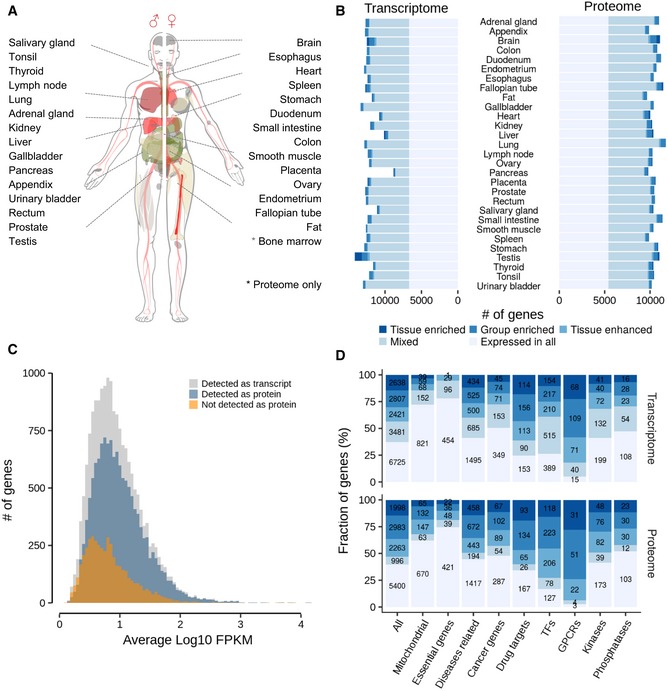
Body map of analysed tissues.
Number of genes detected on protein and mRNA level in each tissue. The colouring of the bars indicates the fractions of transcripts and proteins that are expressed everywhere or enriched in certain tissues. The full classification is provided in the text.
Abundance distribution of all transcripts detected in all tissues (grey); the fraction of detected proteins is shown in blue and the fraction of transcripts for which no protein was detected is shown in orange.
Relative distribution and absolute numbers of transcripts and proteins in selected functional classes across the expression categories shown in panel (B). Colours are the same as in panel (B).
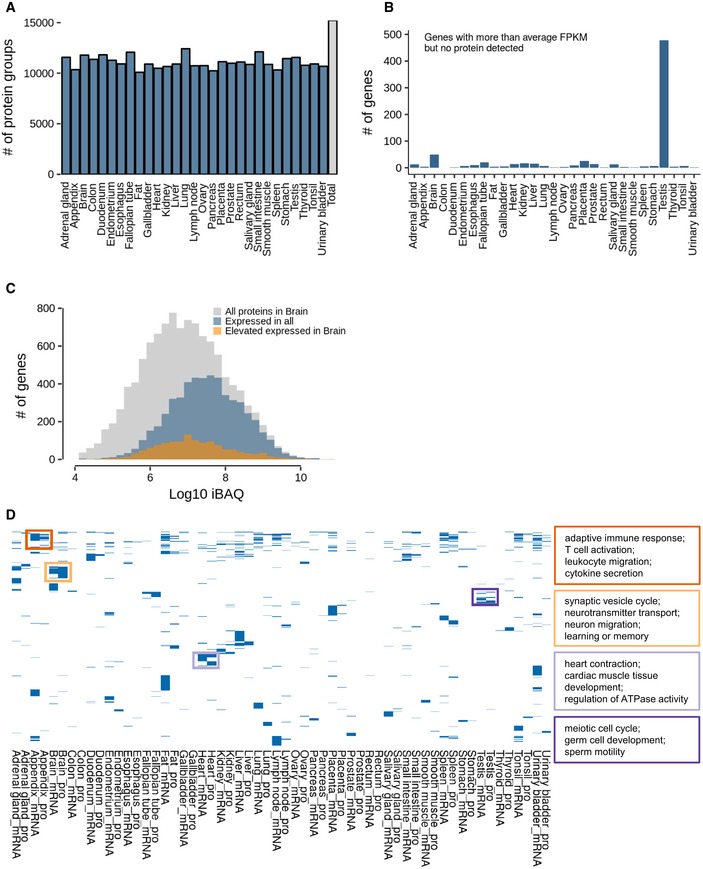
Number of identified protein groups for each of the 29 tissues.
Number of genes in all tissues that were detected at the transcript with higher than average expression but not detected at the protein level. Note the very high number of such cases in testis.
Abundance distribution of all proteins detected in human brain (grey). Proteins in blue are expressed in all 29 tissues, and proteins in orange show elevated expression in brain.
Clustering of gene ontology terms (biological process) for proteins and transcripts that show the most divergent expression across all tissue. Boxes give examples of GO terms for four different tissues (Appendix, brain, heart and testis).
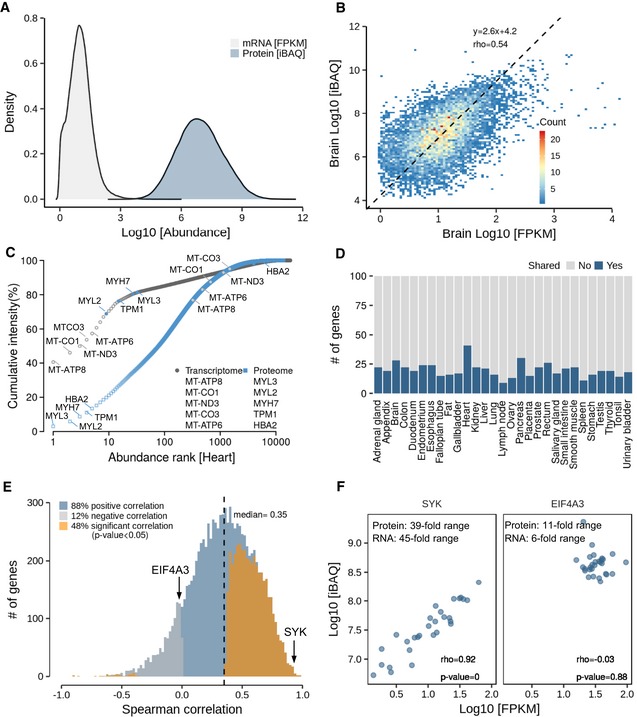
Distribution of global transcript and protein abundance in all tissues. It is apparent that the dynamic range of protein expression (iBAQ scale) exceeds that of mRNA expression (FPKM scale; see Appendix Fig S10 for the corresponding plot for RNA and protein copy numbers).
Protein‐to‐mRNA abundance plot for brain tissue. The slope of the regression line indicates that high‐abundance mRNAs give rise to more protein copies per mRNA than low‐abundance mRNAs.
Ranked abundance plot of proteins and transcripts in human heart. While the 10 most abundant transcripts cover almost 70% of all transcripts in this tissue, the corresponding proteins only represent about 20% of the total protein.
Analysis of the number of genes that are shared among the 100 most abundant transcripts and proteins. Regardless of the tissue, the fraction of shared genes rarely exceeds 20%.
Correlation analysis of protein‐to‐RNA abundance (in log10 scale) across tissues, resulting in almost 90% positive correlations. The proteins highlighted in the next panel are marked.
Examples for proteins that show high (SYK, left panel) or no (EIF4A3, right panel) correlation of protein/RNA ratios across tissues. While the former indicates that different tissues express different quantities of SYK, EIF4A3 expression appears to be similar in all tissues.
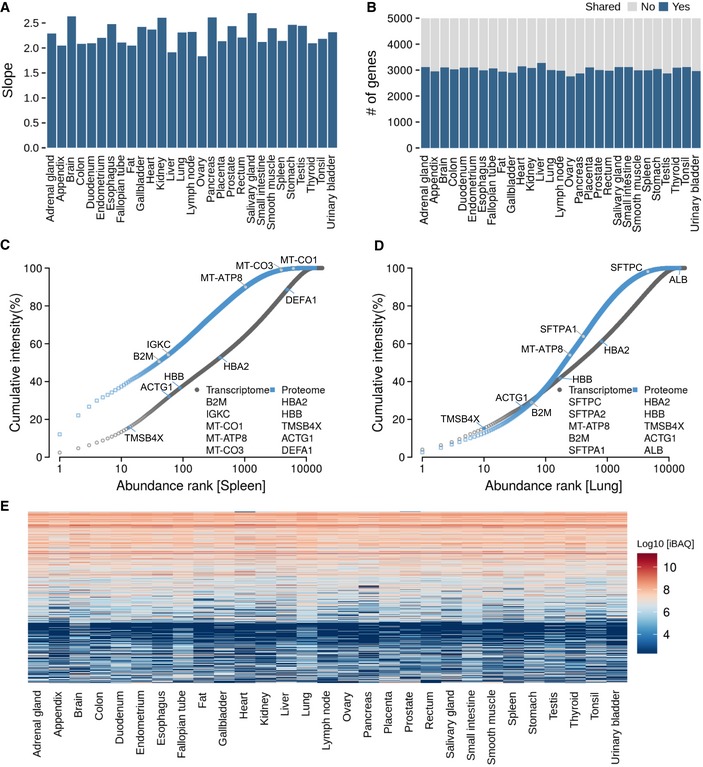
- A
Slopes of the regression line in protein versus mRNA abundance plots (see main Fig 2B) for each tissue.
- B
Number of genes that are shared among the 5,000 most abundant transcripts or proteins in each tissue.
- C, D
Ranked abundance plots for transcripts and proteins in spleen and lung showing different characteristics in the abundance distributions (see also main Fig 2C and Appendix Fig S12 for all tissues).
- E
Clustering of protein abundances across all tissues. It is apparent that many proteins have similar expression levels across several/many tissues.
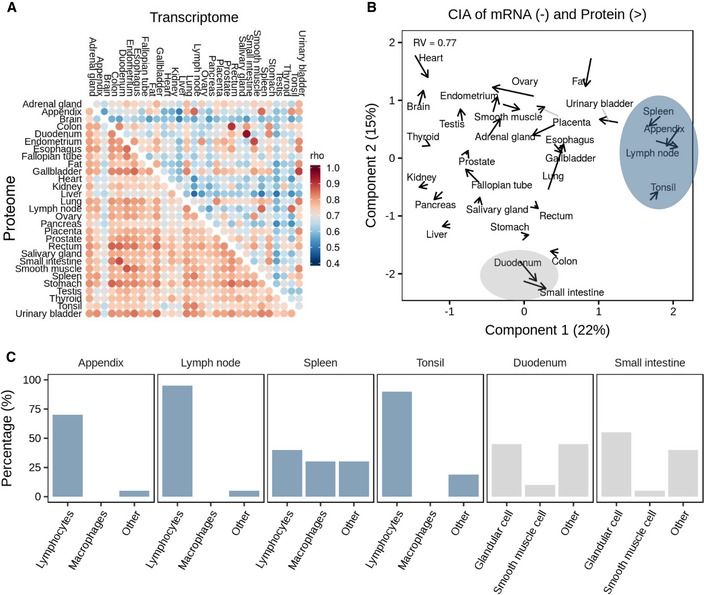
Global correlation analysis of proteomes versus proteomes and transcriptomes versus transcriptomes across human tissues. It is apparent that proteomes correlate stronger across tissues than transcriptomes.
Co‐inertia analysis of transcriptome and proteome levels of all 29 tissues (arrow base: transcriptome; arrow head: proteome) showing that the information carried by transcriptomes and proteomes was closer to each other in the same than across different tissues. Grey lines are used to aid identifying tissue names for the respective arrows. Shaded areas highlight tissues that are related by their molecular profiles.
Average cellular compositions of tissues highlighted in panel (B) showing that the molecular similarities in their transcriptomes and proteomes are driven by similarities in cell types.
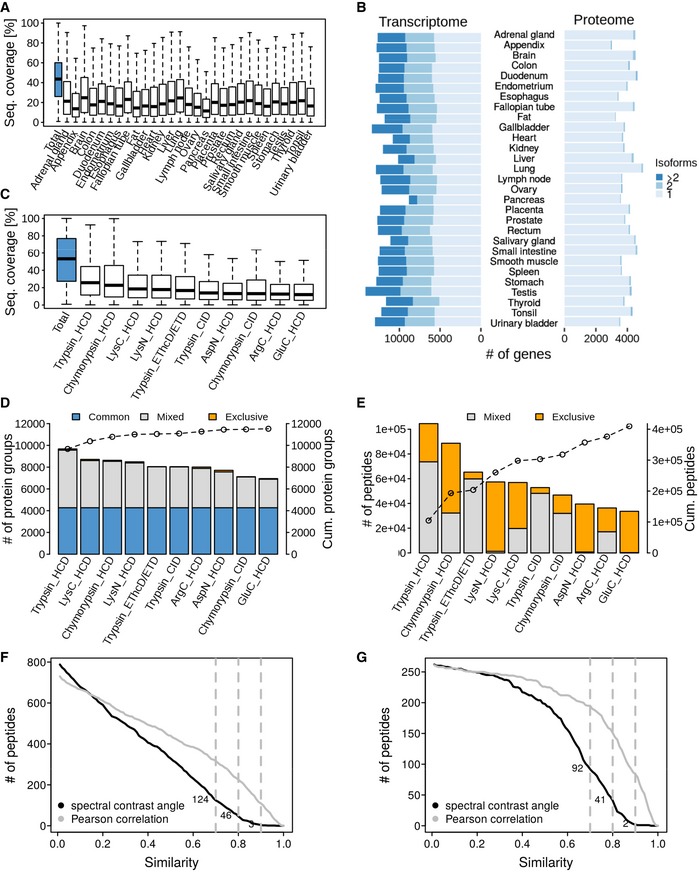
Distribution of peptide sequence coverage values obtained for proteins by mass spectrometry in each tissue. Horizontal lines: median. Box limits: 50% quantiles. Whiskers: all data points outside the box.
Analysis of the number of isoforms detected by transcriptomics or proteomics in each tissue.
Distribution of peptide sequence coverage obtained for proteins by mass spectrometry in tonsil tissue broken down by protease and fragmentation method used. Horizontal lines: median. Box limits: 50% quantiles. Whiskers: all data points outside the box.
Number of identified proteins in tonsil broken down by protease and fragmentation method used. Proteins covered by all workflows are marked in blue. Proteins identified by two or more workflows are indicated in grey and proteins exclusively identified by a single workflow in orange. The line connecting open circles indicates the cumulative number of proteins when adding data from the individual workflows.
Same as panel (D) but for peptides. Peptides covered by more than one workflow are marked in grey, and those exclusive for one workflow are marked in orange.
Number of experimental versus synthetic peptide reference spectra comparisons for candidate aTIS peptides (only the spectra with the highest spectral angle of each peptide were plotted) after database searching using Mascot as a function of the spectral angle or Pearson correlation coefficient. Dotted grey lines mark spectral angles of 0.7, 0.8 and 0.9.
Same as panel (F) but showing only candidate peptides that were identified by both Mascot and Andromeda.
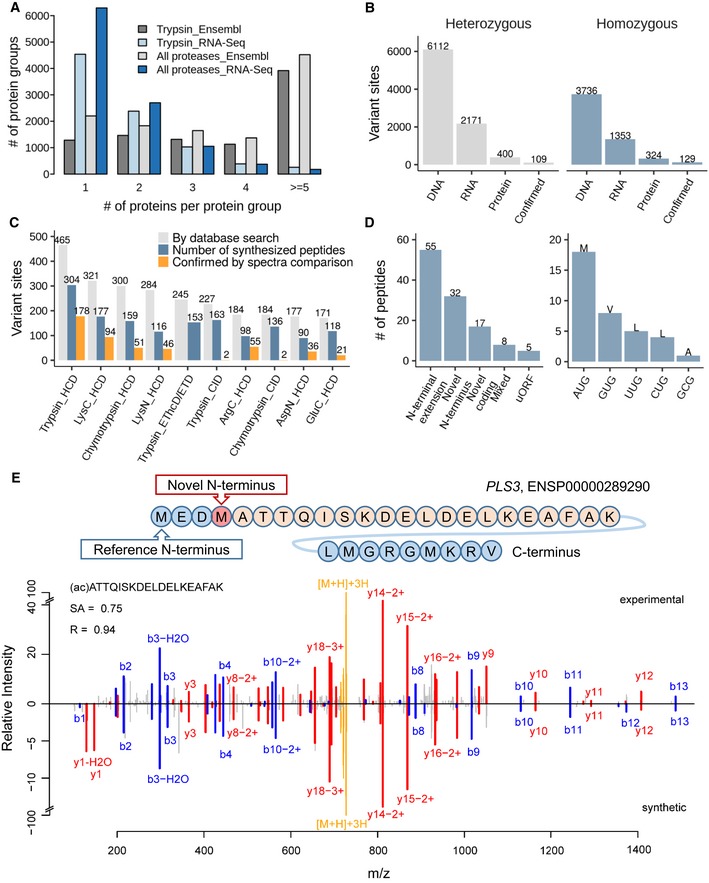
Searching the tonsil proteomic data (trypsin alone or all enzymes) against a tissue‐specific sequence database constructed from RNA‐Seq data drastically reduces the number of individual protein sequences in protein groups compared to searches against Ensembl, allowing for the more efficient detection of protein isoforms.
Number of single amino acid variants detected by whole exome sequencing and DNA, by RNA‐Seq at the mRNA and by mass spectrometry at the protein level as well as confirmed candidates by validation using synthetic peptide spectra comparisons. It is apparent that only a very small fraction of all variants detected at the DNA or RNA level can be detected at the proteome level using current technology.
Analysis of which proteomic workflow contributed to the detection and confirmation of single amino acid variants.
Results of the detection of non‐canonical coding regions using proteomics data (left panel) and different alternative start codons identified by acetylated N‐terminal peptides (right panel). The majority of cases are N‐terminal extensions of annotated genes. All but one of the detected alternative translation start sites correspond to point mutations of the first base of the classical AUG codon.
Validation of a novel translation start site for the protein PLS3. The upper panel shows the novel translation site position within the amino acid sequence context, and the lower panel shows a mirror plot of the tandem mass spectra of the endogenous N‐terminally acetylated peptide (peaks pointing upwards) and the corresponding synthetic peptide spectrum (peaks pointing downwards). Y‐type sequence ions are coloured in red, b‐type ions in blue, and the intact peptide as well as neutral losses thereof are marked in yellow.
References
-
- Becher I, Werner T, Doce C, Zaal EA, Tögel I, Khan CA, Rueger A, Muelbaier M, Salzer E, Berkers CR, Fitzpatrick PF, Bantscheff M, Savitski MM (2016) Thermal profiling reveals phenylalanine hydroxylase as an off‐target of panobinostat. Nat Chem Biol 12: 908–910 - PubMed
-
- Blomen VA, Májek P, Jae LT, Bigenzahn JW, Nieuwenhuis J, Staring J, Sacco R, van Diemen FR, Olk N, Stukalov A, Marceau C, Janssen H, Carette JE, Bennett KL, Colinge J, Superti‐Furga G, Brummelkamp TR (2015) Gene essentiality and synthetic lethality in haploid human cells. Science 350: 1092–1096 - PubMed
-
- Branca RMM, Orre LM, Johansson HJ, Granholm V, Huss M, Pérez‐Bercoff Å, Forshed J, Käll L, Lehtiö J (2014) HiRIEF LC‐MS enables deep proteome coverage and unbiased proteogenomics. Nat Methods 11: 59–62 - PubMed
Publication types
MeSH terms
Substances
LinkOut - more resources
Full Text Sources
Other Literature Sources
Molecular Biology Databases
