. 2019 Feb 18;10(1):821.
doi: 10.1038/s41467-019-08679-z.

Long non-coding RNAs discriminate the stages and gene regulatory states of human humoral immune response

Affiliations

Long non-coding RNAs discriminate the stages and gene regulatory states of human humoral immune response

Xabier Agirre et al. Nat Commun. .

Abstract

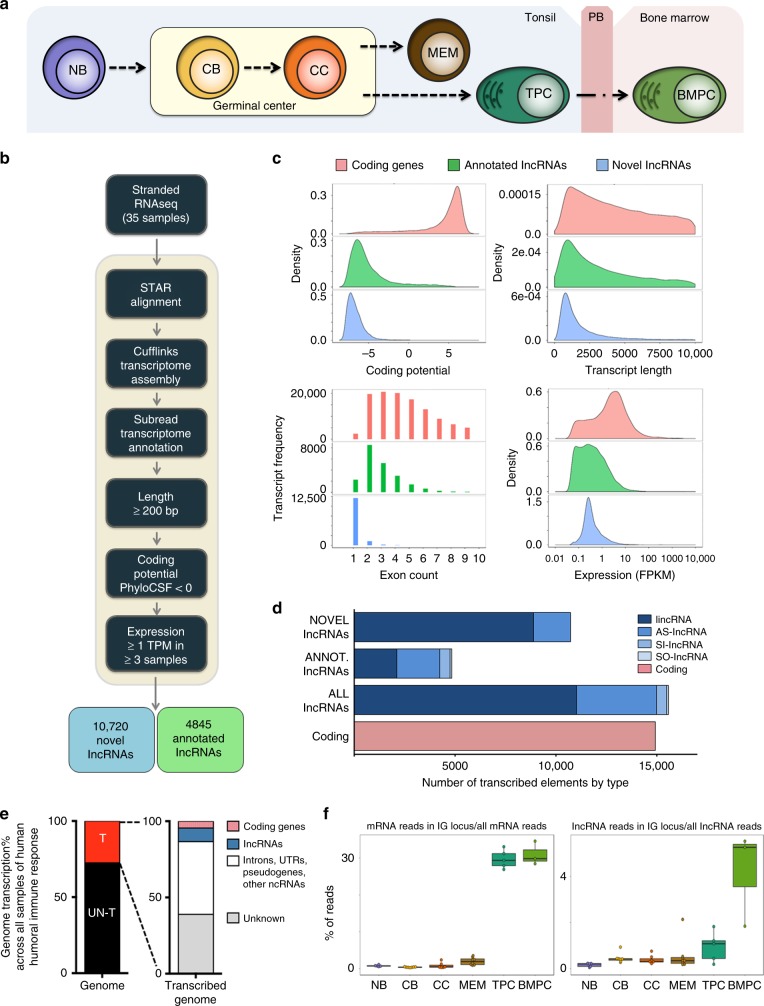
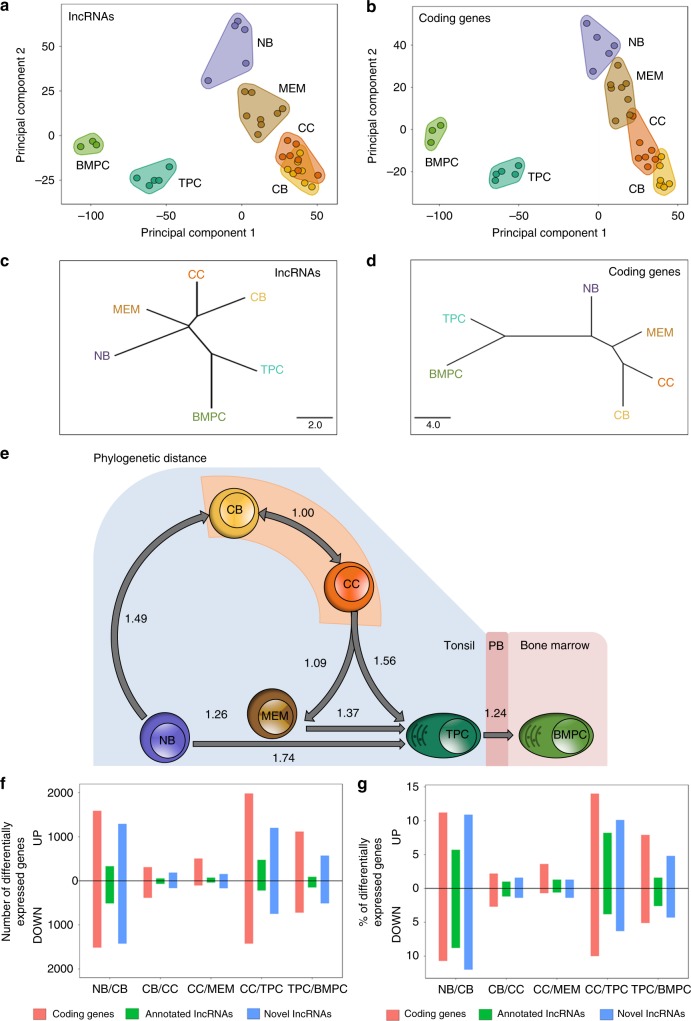
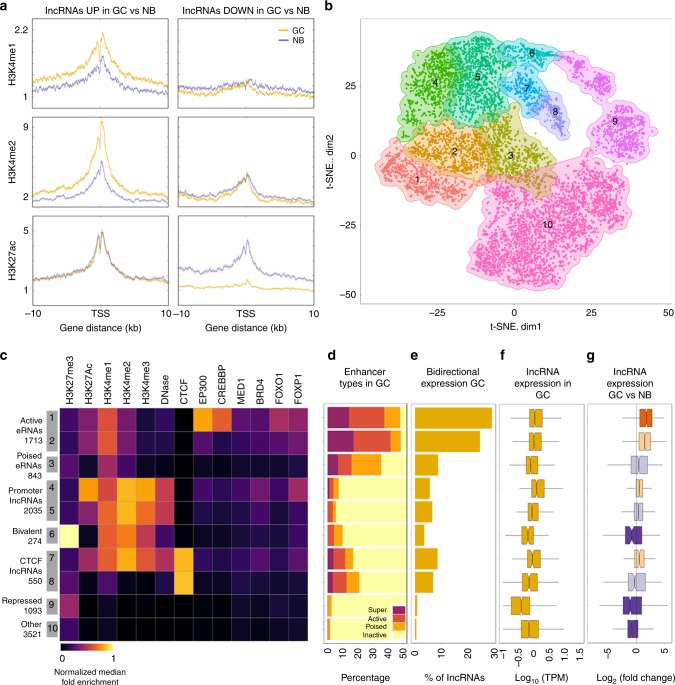
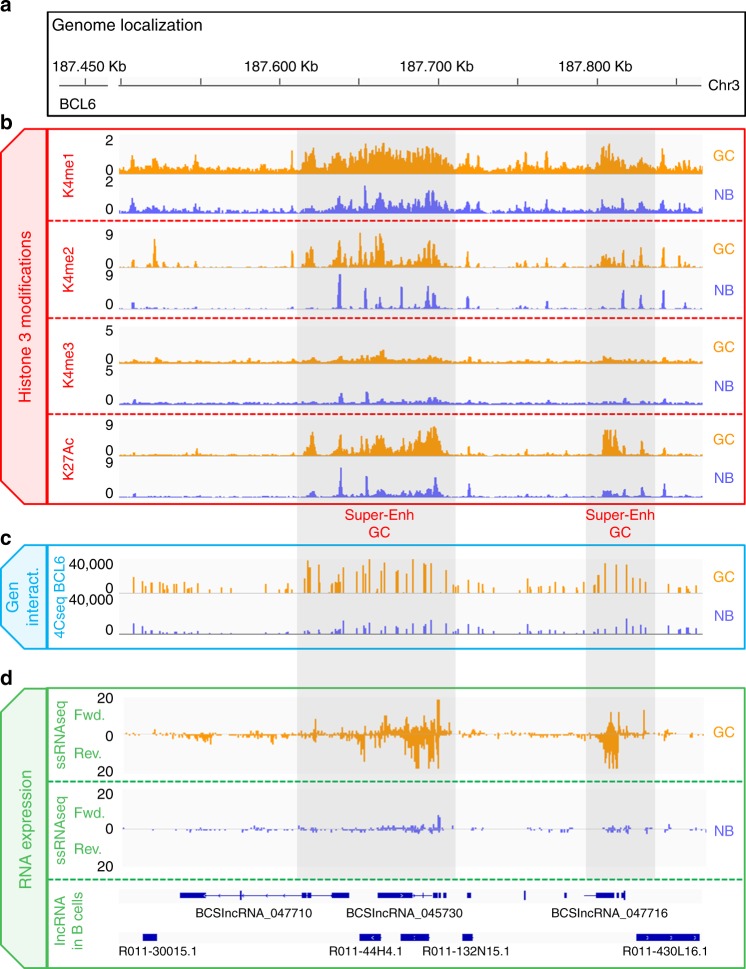
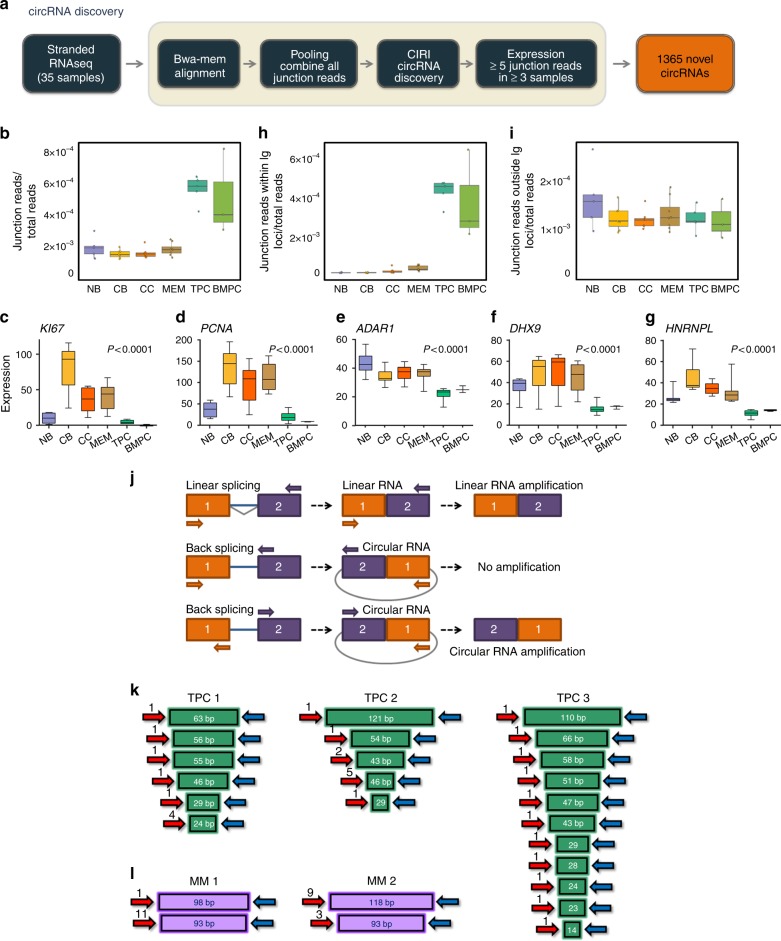
lncRNAs make up a majority of the human transcriptome and have key regulatory functions. Here we perform unbiased de novo annotation of transcripts expressed during the human humoral immune response to find 30% of the human genome transcribed during this process, yet 58% of these transcripts manifest striking differential expression, indicating an lncRNA phylogenetic relationship among cell types that is more robust than that of coding genes. We provide an atlas of lncRNAs in naive and GC B-cells that indicates their partition into ten functionally categories based on chromatin features, DNase hypersensitivity and transcription factor localization, defining lncRNAs classes such as enhancer-RNAs (eRNA), bivalent-lncRNAs, and CTCF-associated, among others. Specifically, eRNAs are transcribed in 8.6% of regular enhancers and 36.5% of super enhancers, and are associated with coding genes that participate in critical immune regulatory pathways, while plasma cells have uniquely high levels of circular-RNAs accounted for by and reflecting the combinatorial clonal state of the Immunoglobulin loci.


Conflict of interest statement

The authors declare no competing interests.

Figures

Fig. 1
Fig. 1
Identification of novel and previously annotated long non-coding RNAs (lncRNAs). a Schematic illustration of terminal differentiation of B cells from naive to plasma cells. b Workflow used to define and identify the novel and annotated lncRNAs expressed during the humoral immune response. c Coding potential, distribution of transcript lengths, distribution of number of exons per transcript, and expression levels for protein-coding genes (messenger RNA (mRNA)—red), previously annotated lncRNAs (annotated lncRNA—green), and novel lncRNAs (blue). d Number of lncRNAs and coding genes expressed. e, f Percentage of transcribed genome during the humoral immune response. f Box plots showing the percentage of coding genes or lncRNAs reads in Ig locus with respect to all coding genes or lncRNAs. Box plots show the median as center, first and third quartiles as the box hinges, and whiskers extend to the smallest and largest value no further than the 1.5× interquartile range (IQR) away from the hinges. NB: naive B cells; CB: centroblasts; CC: centrocytes; MEM: memory B cells; TPC: tonsillar plasma cells; BMPC: plasma cells from bone marrow of healthy donors
Fig. 2
Fig. 2
Differentially expressed long non-coding RNAs (lncRNAs) in each B cell subset. Unsupervised principal components analysis (PCA) of RNA-sequencing (RNA-seq) data for all a lncRNAs and b coding genes. Phylogenetic tree analysis of RNA-seq data for all c lncRNAs and d coding genes. e New scheme of B cell differentiation during the humoral immune response in which the memory B cells are positioned between the NB and GC B cells. The numbers show the distance between two of the B cell subpopulations. f The number of differentially expressed lncRNAs and g the percentage of differentially expressed novel lncRNAs, annotated lncRNAs, and protein-coding genes (with respect to total of expressed novel lncRNAs, annotated lncRNAs, and protenin-coding genes during the humoral immune response) between NB and CB, CB and CC, CC and MEM, CC and TPC, and TPC and BMPC. NB: naive B cells; CB: centroblasts; CC: centrocytes; MEM: memory B cells; TPC: tonsillar plasma cells; BMPC: plasma cells from bone marrow of healthy donors
Fig. 3
Fig. 3
Specific expressions of long non-coding RNAs (lncRNAs) during human humoral immune response. a Heatmap showing all expressed lncRNAs in B cell subpopulations. b Heatmap showing all expressed protein-coding genes in B cell subpopulations. c Tissue specificity distribution index of lncRNAs and protein-coding genes in B cell subtypes (p < 2.2 × 10−16 by Wilcoxon's rank-sum test)
Fig. 4
Fig. 4
Dynamic expression of long non-coding RNAs (lncRNAs) in the germinal center (GC) reaction. a Heatmap showing k-means clustering of specific lncRNAs of each B cell subpopulation indicating dynamic modulation patterns of lncRNAs across different B cell subtypes. b Plot showing the expression of protein-coding genes that are adjacent to lncRNAs specifically expressed in each B cell subpopulations. The enrichment of differentially upregulated genes near lncRNA clusters is shown. c Plot showing the average expression of protein-coding genes that are adjacent to lncRNAs that are differentially expressed in comparison between two B cell subpopulations (p < 2.2 × 10−16 by Wilcoxon's rank-sum test). Box plots show the median as center, first, and third quartiles as the box hinges, and whiskers extend to the smallest and largest value no further than the 1.5× interquartile range (IQR) away from the hinges. d Expression and localization of lncRNAs in relation to protein-coding genes up- or down-regulated. The changes in lncRNAs expression are shown by their proximity to coding genes that are differentially expressed in different stages. NB: naive B cells; CB: centroblasts; CC: centrocytes; MEM: memory B cells; TPC: tonsillar plasma cells; BMPC: plasma cells from bone marrow of healthy donors
Fig. 5
Fig. 5
Categorization of long non-coding RNAs (lncRNAs). a Density plot of chromatin immunoprecipitation-sequencing (ChIP-seq) levels of H3K4me1, H3K4me2, and H3K27ac in lncRNAs differentially expressed between naive B (NB) cells and germinal center (GC) B cells. b t-distributed stochastic neighbor embedding (t-SNE) plot showing 10 different clusters of lncRNAs expressed in GCs and their association with ChIP-seq levels of H3K4me1, H3K4me2, H3K4me3, H3K27ac, H3K27me3, DNase, CTCF, EP300, CREBBP, MED1, BRD4, FOXO1, and FOXP1. c Heatmap of median of ChIP-seq enrichments in each of the 10 clusters of lncRNAs expressed in GC cells. d Percentage of enhancer types, e percentage of bidirectional expression, and f average expression of lncRNAs in each of the 10 clusters of lncRNAs expressed in GC cells and g with respect to NB cells. Box plots show the median as center, first and third quartiles as the box hinges, and whiskers extend to the smallest and largest value no further than the 1.5× interquartile range (IQR) away from the hinges
Fig. 6
Fig. 6
Enhancer RNAs in naive (NB) and germinal center (GC) B cells. a Cartoon showing the definition of enhancer, constituent enhancer, and super-enhancer regions. b Percentage of enhancer and super-enhancer regions with enhancer RNA (eRNA) transcription in GCs. c Percentage of long non-coding RNAs (lncRNAs) transcribed bidirectionally from super-enhancer regions, active (H3K4me1/H3K27ac), poised (H3K4me1), or inactive enhancer (regions that lack H3K4me1 in one cell type but not the other) regions in GCs. d Expression levels of lncRNAs transcribed from super-enhancer regions, active, poised, or inactive enhancer regions in GCs. e Mountain plots (folded cumulative distribution function (CDF)) of H3K27Ac, H3K4me1, H3K4me2, DNase hypersensitivy, normalized HiC contacts, and length of enhancer and super-enhancer regions with eRNA transcription compared to enhancer and super-enhancer regions without eRNA transcription. Mountain plots are created by folding the empirical cumulative distribution function around the median. Statistical significance was tested by Wilcoxon's rank-sum test. f Expression levels of eRNAs transcribed and coding genes closer from super-enhancer regions, active, poised, or inactive enhancer regions in GC or NB cells (p < 2.2 × 10−16 for both terms for NB and GC enhancer status, p < 0.0073 for interaction term between both terms using analysis of variance (ANOVA)). g Expression of coding genes with respect to distance to the nearest eRNAs or non-enhancer lncRNAs in GCs (p < 2.2 × 10−16 for interaction term of nearby lncRNA type with distance in ANOVA). h Expression of coding genes associated with the distance to enhancer regions with and without transcription of eRNAs in GCs as indicated (p < 5 × 10−7 for interaction of enhancer transcription term with distance in ANOVA). i Gene ontology enrichment of coding genes related to eRNAs in NB cells or GCs. NB: naive B cells; GC: germinal centers. ANOVA test was used for statistical analysis. Box plots show the median as center, first and third quartiles as the box hinges, and whiskers extend to the smallest and largest value no further than the 1.5× interquartile range (IQR) away from the hinges
Fig. 7
Fig. 7
Long non-coding RNA (lncRNA) expression from BCL6 enhancer region in the germinal center (GC) cells and naive B (NB) cells. a Genome localization of BCL6 enhancer region. b Chromatin immunoprecipitation-sequencing (ChIP-seq) levels of H3K4me1, H3K4me2, H3K4me3, and H3K27ac in BCL6 enhancer region in GC and NB cells. c 4c-BCL6-seq levels in BCL6 enhancer region in GC and NB cells. d Stranded RNA-seq data in BCL6 enhancer region in GC and NB cells
Fig. 8
Fig. 8
Identification of circular RNAs (circRNAs) during the human humoral immune response. a Scheme of pipeline used to define and identify the putative circRNAs expressed during the humoral immune response. b Box plots showing the average expression of total junction reads from circRNAs. c Box plots showing the expression level of MKI67, PCNA, e ADAR1, f DHX9, and g HNRNPL genes in different B cell subpopulations. Analysis of variance (ANOVA) test was used for statistical analysis. h, i Box plots showing the average expression of junction reads derived from immunoglobulin (Ig) genes and junction reads derived from non-Ig genes. j Schematic representation of the circRNA formation by back splicing circularization and primers designed to properly amplify by PCR these circRNAs. k, l Cloning and sequencing results of a circRNA derived from Ig locus in normal tonsillar plasma cells or plasma cells from multiple myeloma patients as indicated. Box plots show the median as center, first and third quartiles as the box hinges, whiskers extend to the smallest and largest value no further than the 1.5× interquartile range (IQR) away from the hinges. NB: naive B cells; CB: centroblasts; CC: centrocytes; MEM: memory B cells; TPC: tonsillar plasma cells; BMPC: plasma cells from bone marrow of healthy donors; Ig: immunoglobulin genes; MM: multiple myeloma

Similar articles

Cited by

References

    1. Huarte M. The emerging role of lncRNAs in cancer. Nat. Med. 2015;21:1253–1261. doi: 10.1038/nm.3981. - DOI - PubMed
    1. Garitano-Trojaola A, Agirre X, Prósper F, Fortes P. Long non-coding RNAs in haematological malignancies. Int. J. Mol. Sci. 2013;14:15386–15422. doi: 10.3390/ijms140815386. - DOI - PMC - PubMed
    1. Ranzani V, et al. The long intergenic noncoding RNA landscape of human lymphocytes highlights the regulation of T cell differentiation by linc-MAF-4. Nat. Immunol. 2015;16:318–325. doi: 10.1038/ni.3093. - DOI - PMC - PubMed
    1. Hu G, et al. Expression and regulation of intergenic long noncoding RNAs during T cell development and differentiation. Nat. Immunol. 2013;14:1190–1198. doi: 10.1038/ni.2712. - DOI - PMC - PubMed
    1. Fatica A, Bozzoni I. Long non-coding RNAs: new players in cell differentiation and development. Nat. Rev. Genet. 2014;15:7–21. doi: 10.1038/nrg3606. - DOI - PubMed

Publication types