. 2019 Feb 18;10(1):823.
doi: 10.1038/s41467-019-08801-1.

Adenosine deaminase-1 delineates human follicular helper T cell function and is altered with HIV

Affiliations

Adenosine deaminase-1 delineates human follicular helper T cell function and is altered with HIV

Virginie Tardif et al. Nat Commun. .

Abstract

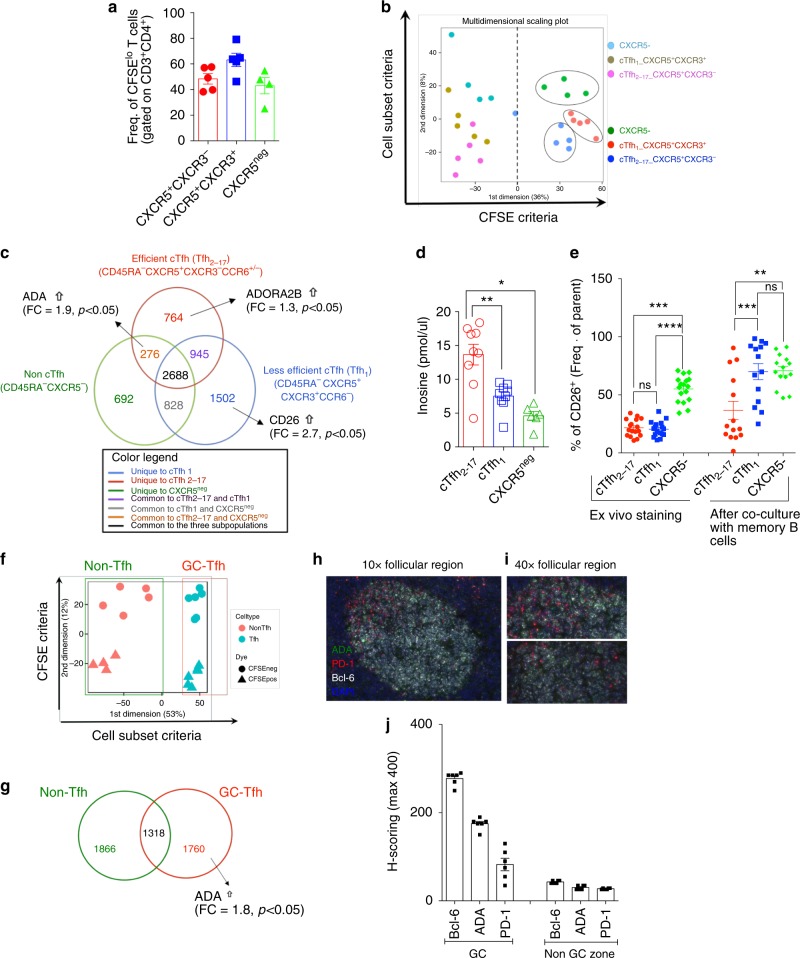
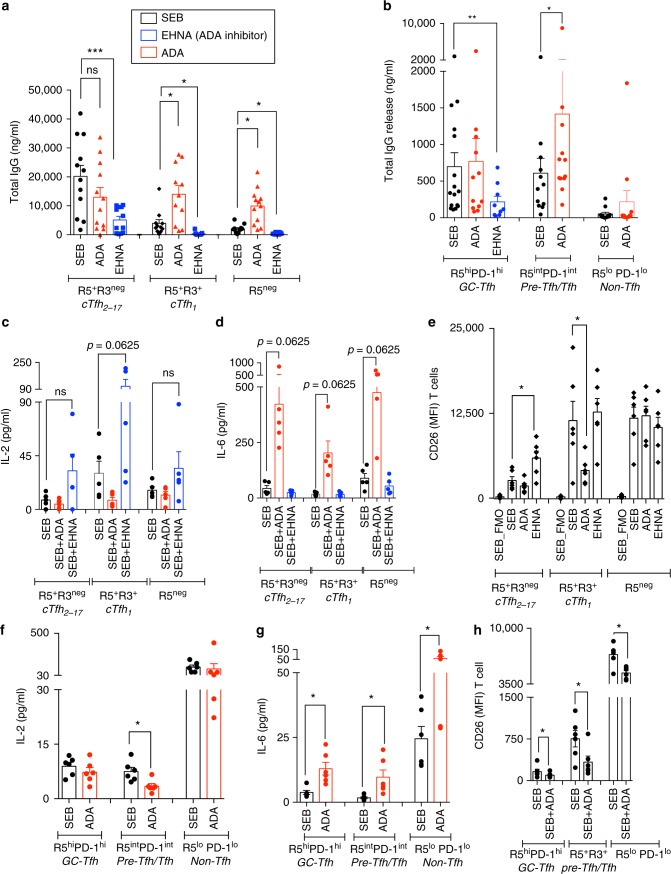
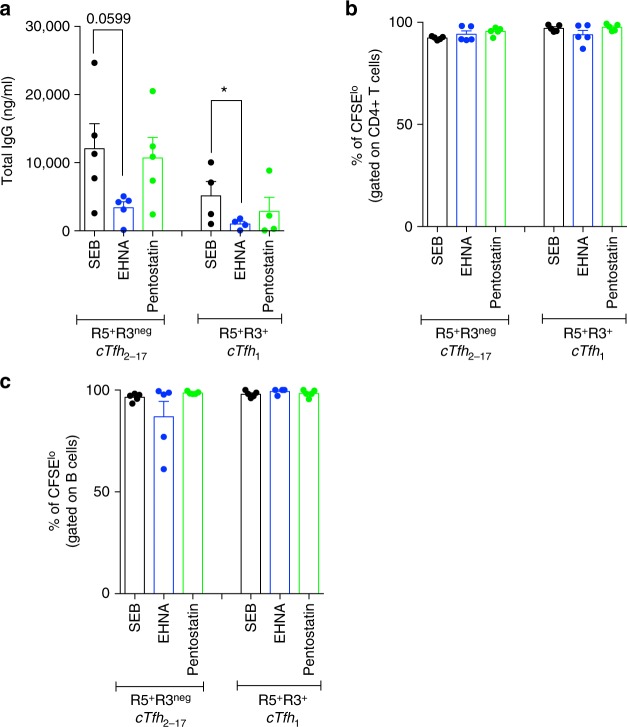
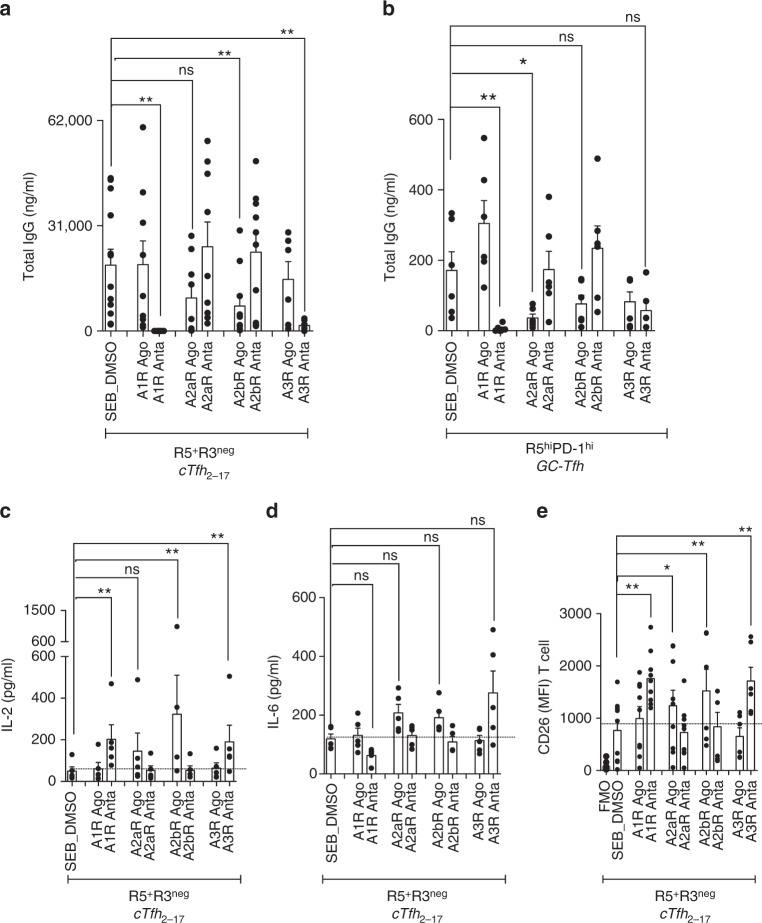
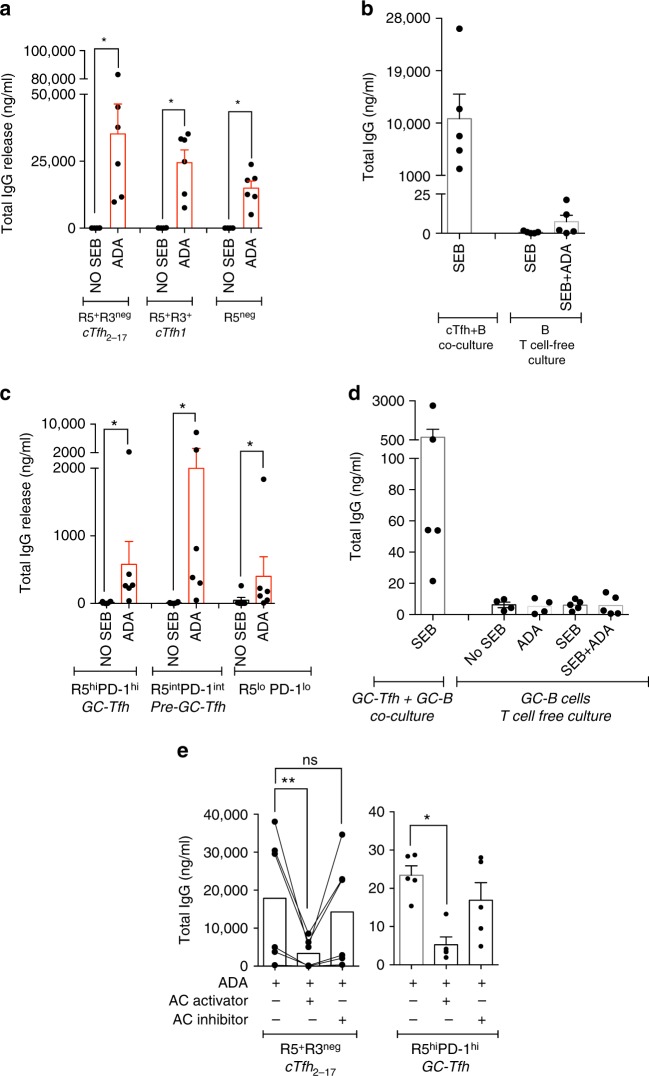
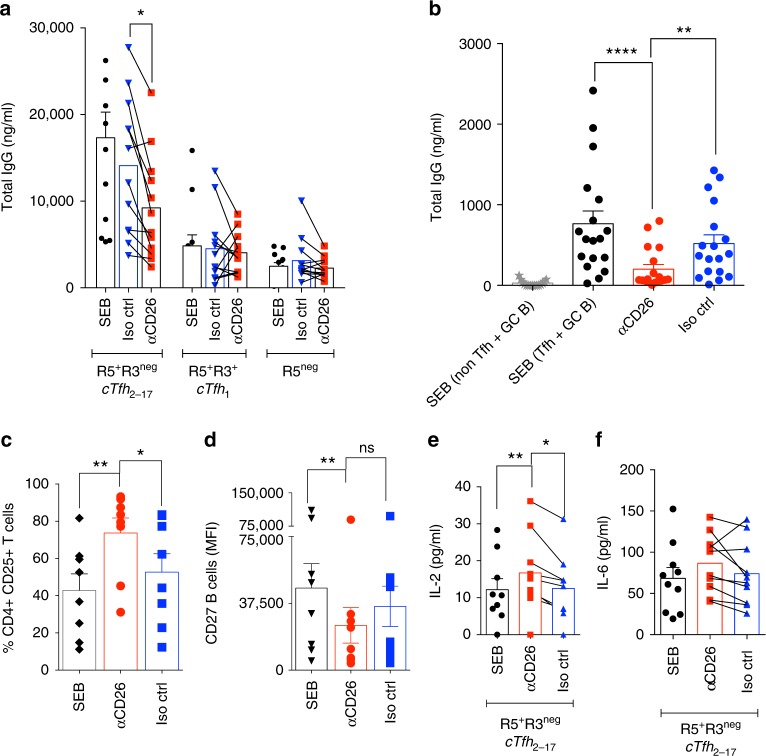
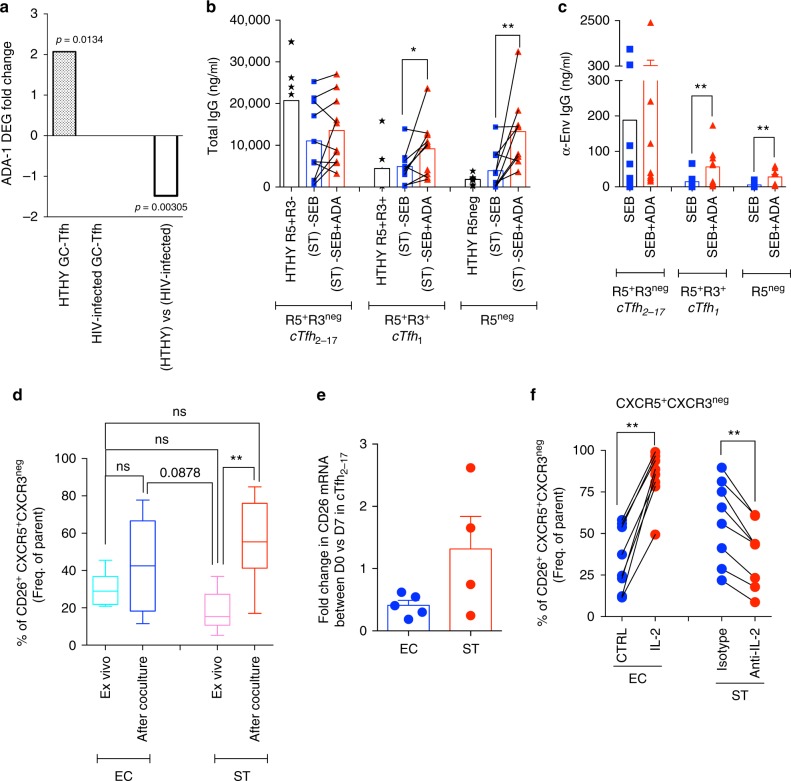
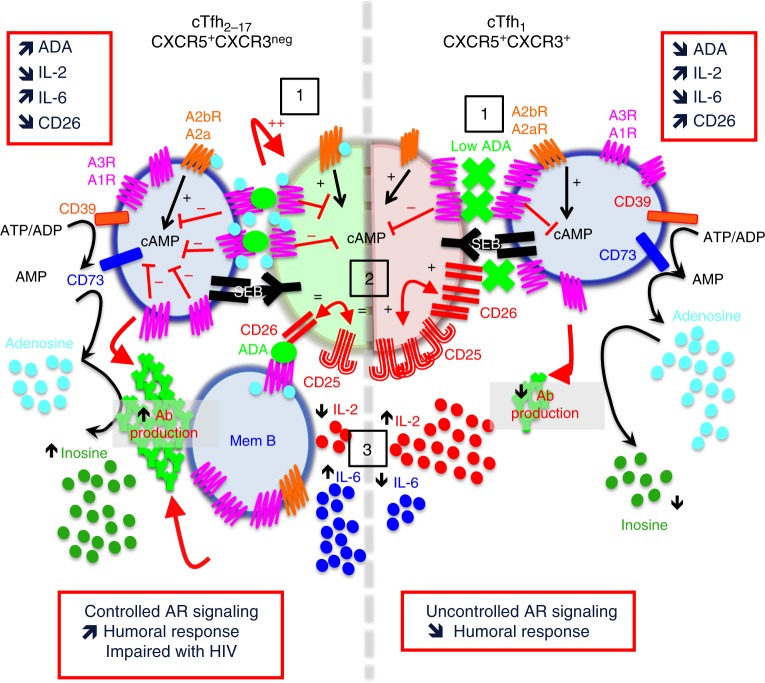
Follicular helper T cells (Tfh) play critical roles instructing, and initiating T-cell dependent antibody responses. The underlying mechanisms that enhance their function is therefore critical for vaccine development. Here we apply gene array analysis identifying adenosine deaminase (ADA) as a key molecule that delineates a human Tfh helper program in proliferating circulating Tfh (cTfh) cells and Germinal Centers Tfh (GC-Tfh). ADA-1 expression and enzymatic activity are increased in efficient cTfh2-17/GC-Tfh cells. Exogenous ADA-1 enhances less efficient cTfh1 and pro-follicular Tfh PD-1+ CXCR5+ cells to provide B cell help, while pharmacological inhibition of ADA-1 activity impedes cTfh2-17/GC-Tfh function and diminished antibody response. Mechanistically, ADA-1 controls the Tfh program by influencing IL6/IL-2 production, controlling CD26 extracellular expression and could balance signals through adenosine receptors. Interestingly, dysfunctional Tfh from HIV infected-individual fail to regulate the ADA pathway. Thus, ADA-1 regulates human Tfh and represents a potential target for development of vaccine strategy.


Conflict of interest statement

The authors declare no competing interests.

Figures

Fig. 1
Fig. 1
Unique gene array analysis of cTfh and GC-Tfh cells identified B cell helper program. a Frequency of CFSElo T cells in each co-culture set-up. Each T-cell subset is able to proliferate at the same rate (n = 5 healthy individuals). b Representative multidimensional scaling (MDS) provide a visual representation of the pattern of proximities (i.e., similarities or distances) among a set of objects (memory T-cells subsets). Within the CFSElo area (right of MDS plot), each subset of T-cells clustered together, suggesting unique gene programs. c Venn diagram analysis of non-Tfh CXCR5 population (green) compared to efficient CXCR5+CXCR3+CCR6+/− cTfh2-17 (red) and less efficient CXCR5+CXCR3+CCR6+/− cTfh1 (light blue). Diagram shows the number of unique and common statistically significant genes based on the above criteria. d Inosine level in supernatant of each co-culture set-up (n = 9 per group, two-independent experiments, 4 sorts) (Wilcoxon, paired, two-tailed non-parametric t-test; *p < 0.05, **p < 0.01, ***p < 0.001, ****p < 0.0001; Mean ± SEM). e Ex vivo (n = 17 per group, two-independent experiments) and after co-culture (n = 14 per group, four-independent experiments) FACS staining for CD26 expression of each T-cells subsets. (ANOVA, paired, two-tailed non-parametric t-test; *p < 0.05, **p < 0.01, ***p < 0.001, ****p < 0.0001; Mean ± SEM). f Representative MDS is shown as a visual representation of the clustered groups among tonsillar GC-Tfh (red) and non-Tfh (green). Within the CFSElo group, each T memory group clusters together showing a specific gene profile unique to each subset. g Venn Diagram shows the number of unique and common statistically significant genes based on the criteria described in f. h Representative RNAscope® of a follicular area from tonsil (×10) and i (×40). j H-scoring for Bcl-6, ADA-1, and PD-1 outside and inside follicular region (n = 3 slides per 2 tonsils)
Fig. 2
Fig. 2
Blocking of ADA impairs cTfh2-17 and GC-Tfh helper program. a Production of IgG in the supernatants of 7-day co-culture of cTfh and non-cTfh with their autologous memory B cells after inhibition of ADA by EHNA or supplementation with hADA-1 (n = 10–11, in four-independent experiments). (ANOVA, paired, two-tailed non-parametric t-test; *p < 0.05, **p < 0.01, ***p < 0.001, ****p < 0.0001; Mean ± SEM). b Production of IgG in the supernatants of 5-day co-culture of GC-Tfh, pre-Tfh and non-Tfh with their autologous GC B cells after inhibition of ADA by EHNA or supplementation with hADA-1 (n = 8–12 per group, in four-independent experiments) (Wilcoxon, paired, two-tailed non-parametric t-test; *p < 0.05, **p < 0.01, ***p < 0.001, ****p < 0.0001; Mean ± SEM). c, d IL-2 and IL-6 production in the supernatants of 7-day co-culture of cTfh and non-cTfh after inhibition of ADA by EHNA or supplementation with hADA-1 (n = 5 per group, in two-independent experiments) (Wilcoxon, paired, two-tailed non-parametric t-test; *p < 0.05, **p < 0.01, ***p < 0.001, ****p < 0.0001; Mean ± SEM). e Extracellular CD26 expression by cTfh and non-cTfh after 7 days of co-culture with or without ADA supplementation or ADA inhibition (n = 6 per group, in two-independent experiments). (Wilcoxon, paired, two-tailed non-parametric t-test (*p < 0.05, **p < 0.01, ***p < 0.001, ****p < 0.0001). fg IL-2 and IL-6 production in the supernatants of 5-day co-culture of GC-Tfh, pre-Tfh and non-Tfh after supplementation with hADA-1 (n = 6 per group, in two-independent experiments) (Wilcoxon, paired, two-tailed non-parametric t-test; *p < 0.05, **p < 0.01, ***p < 0.001, ****p < 0.0001; Mean ± SEM). h Extracellular CD26 expression by GC-Tfh, pre-Tfh and non-Tfh after 5 days of co-culture with or without ADA supplementation (n = 6, in two-independent experiments) (Wilcoxon, paired, two-tailed non-parametric t-test (*p < 0.05, **p < 0.01, ***p < 0.001, ****p < 0.0001; Mean ± SEM)
Fig. 3
Fig. 3
Blocking of ADA with EHNA does not impair T- and B-cell proliferation abilities. a Production of IgG in the supernatants of 7-day co-cultures of cTfh and non-cTfh co-in the presence of ADA-inhibitors EHNA or Pentostatin (n = 5, in two-independent experiments). (ANOVA, paired, two-tailed non-parametric t-test; *p < 0.05; Mean ± SEM). b Percentage of CFSElo T cells after 7-day co-cultures of cTfh subsets with memory B cells in the presence of ADA-inhibitors EHNA or Pentostatin (n = 5 per group, in two-independent experiments; Mean ± SEM). c Percentage of CFSElo B cells after 7-day co-cultures with cTfh subsets in the presence of ADA-inhibitors EHNA or Pentostatin (n = 5 per group, in two-independent experiments; Mean ± SEM)
Fig. 4
Fig. 4
Adenosine receptor signaling fine-tunes Tfh helper program. a Production of IgG in the supernatants of 7-day co-cultures of cTfh2-17 (CXCR5+CXCR3neg) in the presence of agonists or antagonists of A1R, A2aR, A2bR and A3R (n = 6–10 per group, in four-independent experiments). (ANOVA, paired, two-tailed non-parametric t-test; *p < 0.05, **p < 0.01; Mean ± SEM). b Production of IgG in the supernatants of 5-day co-culture of GC-Tfh in the presence of agonists or antagonists of A1R, A2aR, A2bR and A3R (n = 6 per group, in two-independent experiments). (ANOVA, paired, two-tailed non-parametric t-test *p < 0.05, **p < 0.01; Mean ± SEM). c, d IL-2 and IL-6 production in the supernatants of 7-day co-culture of cTfh2-17 (CXCR5+CXCR3neg) in the presence of agonists or antagonists of A1R, A2aR, A2bR and A3R (n = 6 per group, in two-independent experiments) (ANOVA, paired, two-tailed non-parametric t-test; *p < 0.05, **p < 0.01; Mean ± SEM). e Extracellular CD26 expression by of 7-day co-culture of cTfh2-17 (CXCR5+CXCR3neg) in the presence of agonists or antagonists of A1R, A2aR, A2bR and A3R (n = 6–9 per group, in 2–3-independent experiments) (ANOVA, paired, two-tailed non-parametric t-test; *p < 0.05, **p < 0.01; Mean ± SEM)
Fig. 5
Fig. 5
ADA-mediated helper program is blunted by adenylyl cyclase activation. a Production of IgG in the supernatants of 7-days co-culture of cTfh and non-cTfh with their autologous memory B cells supplemented with exogenous hADA-1. To note, co-culture assays are performed without any other Sag, i.e. SEB (n = 6 per group, in two-independent experiments). (Wilcoxon, paired, two-tailed non-parametric t-test; *p < 0.05); Mean ± SEM). b Comparison of IgG production in the supernatants of 7-day co-culture of cTfh with their autologous memory B cells and T-cell free culture model (only memory B cells) supplemented with hADA-1 and SEB (n = 5 per group, in two-independent experiments; Mean ± SEM). c Production of IgG in the supernatants of 5-day co-culture of GC-Tfh, pre-Tfh and non-Tfh with their autologous GC B cells supplemented with exogenous hADA-1. To note, co-culture assays are performed without any other Sag, i.e. SEB (n = 6 per group, in two-independent experiments) (Wilcoxon, paired, two-tailed non-parametric t-test; *p < 0.05); Mean ± SEM). d Comparison of IgG production in the supernatants of 5-day co-culture of GC-Tfh with their autologous GC B cells and T-cell free culture model (only GC B cells) supplemented with hADA-1 and SEB (n = 5 per group, in two-independent experiments; Mean ± SEM). e Production of IgG in the supernatants of co-culture assay with cTfh2-17 (left panel) or GC-Tfh (right panel) performed without adding SEB, but in presence of ADA-1 only, or supplemented with an activator or an inhibitor of adenylyl cyclase (AC) (left panel: n = 6 per group, in two-independent experiments; right panel: n = 5 per group, in two-independent experiment). (ANOVA, paired, two-tailed non-parametric t-test; *p < 0.05, **p < 0.01; Mean ± SEM)
Fig. 6
Fig. 6
Targeting CD26 pathway blocks Tfh-mediated helper program. a Production of IgG in supernatants of the 7-day co-cultures of cTfh and non-cTfh with their autologous memory B cells in the presence of anti-CD26 monoclonal anti-human antibody or its isotype control (n = 12 per group, in four-independent experiments). (ANOVA, paired, two-tailed non-parametric t-test; *p < 0.05, **p < 0.01; Mean ± SEM). b Production of IgG in the supernatants of 5-day co-cultures of GC-Tfh, pre-cTfh and non-Tfh with their autologous GC B in the presence of anti-CD26 monoclonal anti-human antibody or its isotype control (n = 17, in four-independent experiments). (ANOVA, paired, two-tailed non-parametric t-test; *p < 0.05, **p < 0.01, ***p < 0.001, ****p < 0.0001; Mean ± SEM). c Generation of memory B cells (CD27+ B cells). d Percentage of CD4+CD25+ T cells in 7-day co-cultures of cTfh2-17 with their autologous memory B cells in the presence of anti-CD26 antibody (n = 8 per group, three-independent experiments). (ANOVA, paired, two-tailed non-parametric t-test; *p < 0.05, **p < 0.01; Mean ± SEM). e Secretion of IL-2 and f secretion of IL-6 in the supernatants of 7-day co-culture of cTfh and non-cTfh with their autologous memory B cells in the presence of anti-CD26 antibody (n = 9 per group, in two-independent experiments). (ANOVA, paired, two-tailed non-parametric t-test; *p < 0.05, **p < 0.01; Mean ± SEM)
Fig. 7
Fig. 7
ADA/CD26 axis is impaired during HIV infection. a Fold change of ADA-1 gene expression in divided (CFSElo) GC-Tfh after 5 days of co-culture with GC-B cells (n = 4 healthy (HTHY) individuals; n = 6 HIV-infected individuals; Mean ± SEM). b Production of IgG in the supernatants from each ST-cTfh and ST-non-cTfh co-culture after supplementation with ADA-1 (n = 6 per group, in two-independent experiments). (Wilcoxon, paired, two-tailed non-parametric t-test; *p < 0.05, **p < 0.01; Mean ± SEM). Healthy (HTHY) co-culture have been reported as control. c Production of α-Env-IgG in the supernatants from each ST-cTfh and ST-non-cTfh co-culture after supplementation with ADA-1 (n = 9 per group, in twoindependent experiments). (Wilcoxon, paired, two-tailed non-parametric t-test; *p < 0.05, **p < 0.01; Mean ± SEM). d Frequency of ex vivo and 7-day co-culture of CXCR5+CXCR3negCD26+ T cells subsets in EC and ST individuals (n = 8–11, three-independent experiments). (ANOVA, non-paired, two-tailed non-parametric t-test; *p < 0.05, **p < 0.01). Whiskers represent Min to Max. e Fold change in the relative expression of CD26 mRNA, as assessed by real-time PCR analysis with respect to measurements at day 0. Results from five EC and four ST subjects are shown. Each dot represents the average of two biological replicates with four to six experimental replicates each. Bars represent Mean ± SEM. f Frequency of CXCR5+CXCR3negCD26+ T cells subsets in co-cultures of EC-cTfh in presence of IL-2 (left panel: n = 8 per group, two-independent experiments) and from ST-cTfh in presence of anti-IL-2 antibody (right panel: n = 7 per group, two-independent experiments). (Wilcoxon, paired, two-tailed non-parametric t-test; **p < 0.01; Mean ± SEM)
Fig. 8
Fig. 8
ADA-1 delineates human cTfh subset function – In cTfh2-17 subset, ADA-1 by binding to A1R (which is mainly expressed by T/B cells), behaves as an allosteric effector that markedly enhances adenosine affinity for A1R and increases receptor functionality (1) (leading to controlled CD26/IL-2/IL-6 signaling (2–3)), in addition of reducing adenosine concentration and therefore metabolite accessibility for other ARs. Inversely, cTfh1 subset does not up-regulate ADA-1 expression, which leads to less efficient memory B cells interaction, more CD26/CD25 cross-talk (2), more IL-2 expression and less IL-6 signaling (3)

References

    1. Sauer AV, Brigida I, Carriglio N, Aiuti A. Autoimmune dysregulation and purine metabolism in adenosine deaminase deficiency. Front. Immunol. 2012;3:265. doi: 10.3389/fimmu.2012.00265. - DOI - PMC - PubMed
    1. Hershfield, M. in GeneReviews (eds Pagon, R. A. et al) Ch: Adenosine deaminase deficiency (University of Washington, 1993). - PubMed
    1. Apasov SG, Blackburn MR, Kellems RE, Smith PT, Sitkovsky MV. Adenosine deaminase deficiency increases thymic apoptosis and causes defective T cell receptor signaling. J. Clin. Invest. 2001;108:131–141. doi: 10.1172/JCI200110360. - DOI - PMC - PubMed
    1. Cassani B, et al. Altered intracellular and extracellular signaling leads to impaired T-cell functions in ADA-SCID patients. Blood. 2008;111:4209–4219. doi: 10.1182/blood-2007-05-092429. - DOI - PMC - PubMed
    1. Cekic C, Linden J. Purinergic regulation of the immune system. Nat. Rev. Immunol. 2016;16:177–192. doi: 10.1038/nri.2016.4. - DOI - PubMed

Publication types

MeSH terms