. 2019 Feb 18;9(1):2190.
doi: 10.1038/s41598-019-38558-y.

Harnessing neurovascular interaction to guide axon growth

Affiliations

Harnessing neurovascular interaction to guide axon growth

Paul P Partyka et al. Sci Rep. .

Abstract

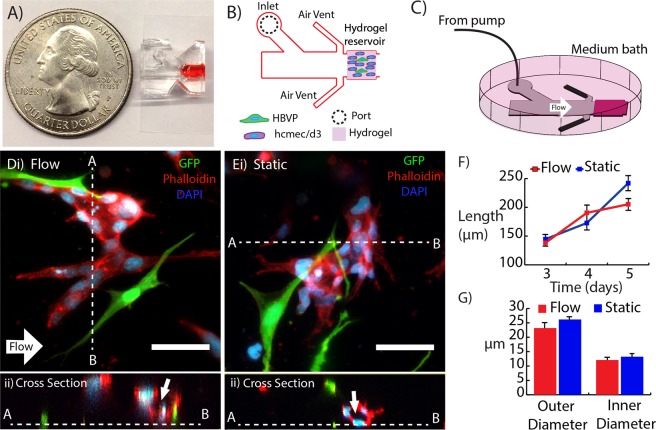
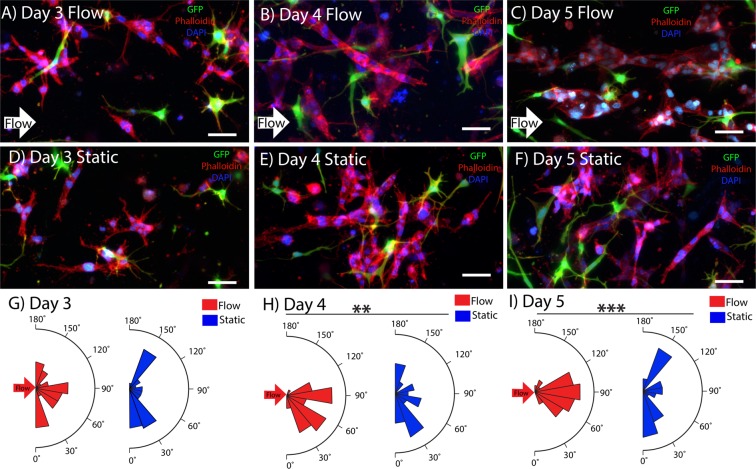
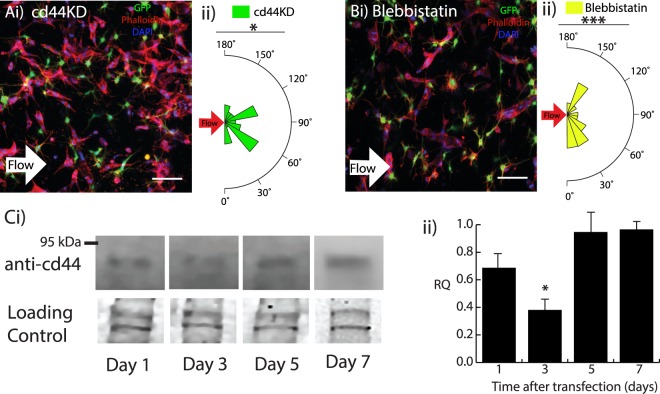
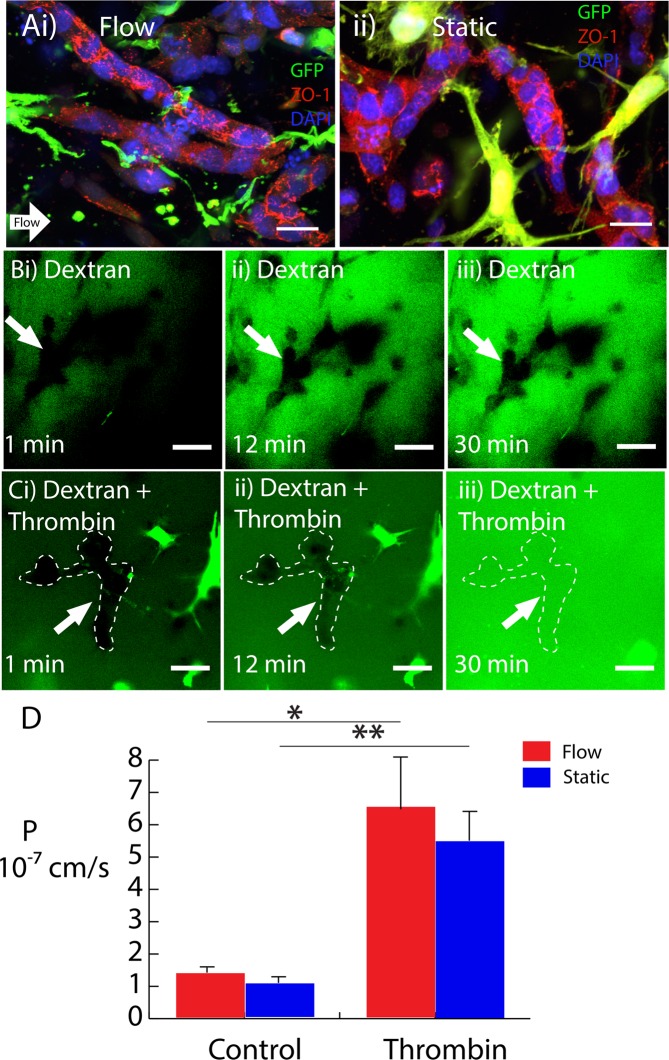
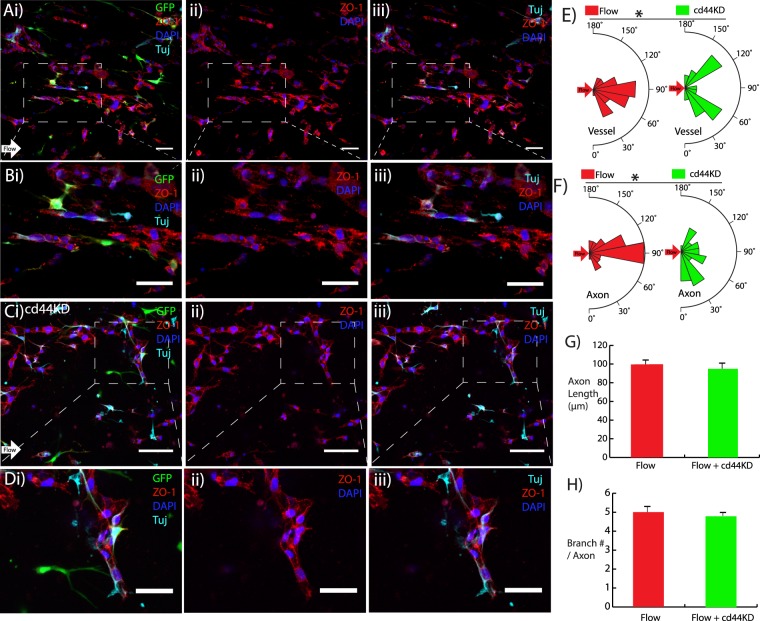
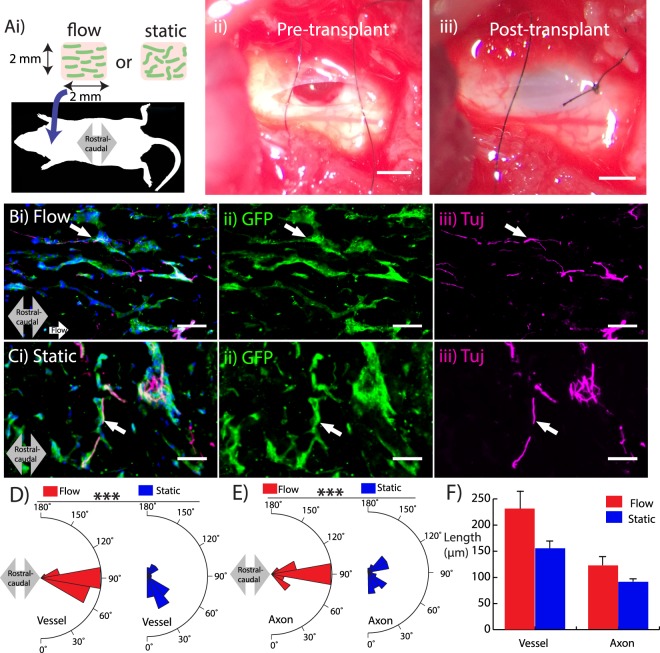
Regulating the intrinsic interactions between blood vessels and nerve cells has the potential to enhance repair and regeneration of the central nervous system. Here, we evaluate the efficacy of aligned microvessels to induce and control directional axon growth from neural progenitor cells in vitro and host axons in a rat spinal cord injury model. Interstitial fluid flow aligned microvessels generated from co-cultures of cerebral-derived endothelial cells and pericytes in a three-dimensional scaffold. The endothelial barrier function was evaluated by immunostaining for tight junction proteins and quantifying the permeability coefficient (~10-7 cm/s). Addition of neural progenitor cells to the co-culture resulted in the extension of Tuj-positive axons in the direction of the microvessels. To validate these findings in vivo, scaffolds were transplanted into an acute spinal cord hemisection injury with microvessels aligned with the rostral-caudal direction. At three weeks post-surgery, sagittal sections indicated close alignment between the host axons and the transplanted microvessels. Overall, this work demonstrates the efficacy of exploiting neurovascular interaction to direct axon growth in the injured spinal cord and the potential to use this strategy to facilitate central nervous system regeneration.


Conflict of interest statement

The authors declare no competing interests.

Figures

Figure 1
Figure 1
3D in vitro microvessel formation. Microfluidic device (A) photograph, (B) schematic, and (C) setup for flow. (D) Microvessel exposed to interstitial fluid flow (direction denoted by white arrow) with cross section (white dashed line) showing lumen (ii). (Ei) Microvessel from static control with cross section showing lumen (arrow) (ii). (F,G) Microvessel length and diameter as a function of time. GFP hBVP (green), Phalloidin-Texas Red (red), and DAPI (blue). Scale bars, 50 μm.
Figure 2
Figure 2
3D Microvessel alignment with interstitial fluid flow. Microvessel alignment with flow (direction denoted by white arrow) at day 3 (A), day 4 (B), and day 5 (C). Microvessel orientation in static conditions for day 3 (D), day 4 (E), and day 5 (F). Microvessel alignment plots over time for day 3 (G), day 4 (H), and day 5 (I). GFP hBVP (green), Phalloidin-Texas Red (red), and DAPI (blue). Scale bars, 50 μm. Data are presented as mean ± s.e.m. **P < 0.01, ***P < 0.001; statistical significance was calculated using ANOVA and post-hoc Tukey’s HSD test. Alignment values (n = 30) are from individual hydrogel samples at each time and condition (flow or static).
Figure 3
Figure 3
Disruption of 3D microvessel alignment. (Ai) Day 5 scaffold exposed to interstitial fluid flow (direction denoted by white arrow) with hCMEC/D3 cd44KD cells and microvessel alignment plot (ii). (Bi) Day 5 hydrogel exposed to interstitial fluid flow with 0.5 μM blebbistatin and microvessel alignment plot (ii). GFP hBVP (green), Phalloidin-Texas Red (red), and DAPI (blue). Scale bars, 100 μm. (C,i) Western blot of cd44 protein expression levels from day 1 after transfection to day 7 and (ii) bar graph showing cd44 protein expression levels as relative intensity (RQ) normalized to day 7 values. Coomassie blue was used to control for gel loading. Data are presented as mean ± s.e.m. *P < 0.05, ***P < 0.001; statistical significance was calculated using Welch Two Sample t-test. Alignment values (n = 30) are from single samples per condition.
Figure 4
Figure 4
Blood-spinal cord barrier evaluation. (A) Day 5 scaffold exhibiting ZO-1 (red) localization to the cell-cell junctions, pericytes (GFP), and nuclei (DAPI) for flow (i) and static (ii) conditions. (B) 4-kDa FITC-dextran permeability test for static condition at (i) 1 min, (ii) 12 min, and (iii) 30 min. (C) 4-kDa FITC-dextran perfused with thrombin for static condition at (i) 1 min, (ii) 12 min, and (iii) 30 min. White dashed lines show microvessel contour. (D) Permeability values. Scale bars, 20 μm (A) and 50 μm (B,C). Data are presented as mean ± s.e.m. *P < 0.05, **P < 0.01; statistical significance was calculated using Welch Two Sample t-test.
Figure 5
Figure 5
Patterned microvessels guide axons from NPCs in vitro (Ai) Day 4 axon alignment with microvessels (direction denoted by white arrow), (ii) ZO-1 tight junction stain (red), and (iii) axons labeled with Tuj (cyan) for flow condition. (B) Higher magnification images from A. (Ci) Day 4 cd44KD with flow condition, (ii) ZO-1 tight junction stain (red), and iii) Tuj-positive axons (cyan), GFP hBVP (green), DAPI (blue). (D) Higher magnification images from C. (E,F) Axon and vessel alignment quantification for flow and cd44KD conditions. (G,H) Axon length and branch number for both flow and cd44KD conditions. Scale bars, 50 μm. Data are presented as mean ± s.e.m. *P < 0.05 compared to untreated flow condition. Alignment values (n = 30), axon length values (n = 15), and branch number/axon values (n = 5) are from single hydrogel samples per condition.
Figure 6
Figure 6
Axon guidance at the site of a cervical spinal cord injury in a rat model. (Ai) Schematic illustrating transplantation of scaffold into a C-4 hemisection. The injury cavity is shown prior to (ii) and immediately following (iii) transplantation. (Bi) Scaffold conditioned with flow exhibits viable GFP-labeled microvessels (green) (ii) and alignment of host axons (magenta) infiltrating the scaffold in the rostral-caudal direction (grey arrow). (C) Scaffold conditioned in static conditions showing disrupted alignment of both microvessels (ii) and host axons (iii). (DF) Microvessel and axon plots showing alignment (D,E) and length (F). Scale bars, 1 mm (Aii,Aiii) and 50 μm (B,C). Data are presented as mean ± s.e.m. ***P < 0.001; statistical significance was calculated using Welch Two Sample t-test. White arrows denote proximity of axons with microvessels. Microvessel alignment values (n = 30), axon alignment values (n = 30), microvessel length values (n = 15), and axon length values (n = 15) are from single hydrogel samples per condition.

References

    1. Bautch VL, James JM. Neurovascular development: The beginning of a beautiful friendship. Cell Adh Migr. 2009;3:199–204. doi: 10.4161/cam.3.2.8397. - DOI - PMC - PubMed
    1. Lazarovici P, Marcinkiewicz C, Lelkes PI. Cross talk between the cardiovascular and nervous systems: neurotrophic effects of vascular endothelial growth factor (VEGF) and angiogenic effects of nerve growth factor (NGF)-implications in drug development. Curr Pharm Des. 2006;12:2609–2622. doi: 10.2174/138161206777698738. - DOI - PubMed
    1. Bar T. Patterns of vascularization in the developing cerebral cortex. Ciba Found Symp. 1983;100:20–36. - PubMed
    1. Coultas L, Chawengsaksophak K, Rossant J. Endothelial cells and VEGF in vascular development. Nature. 2005;438:937–945. doi: 10.1038/nature04479. - DOI - PubMed
    1. Eichmann A, Thomas JL. Molecular parallels between neural and vascular development. Cold Spring Harb Perspect Med. 2013;3:a006551. doi: 10.1101/cshperspect.a006551. - DOI - PMC - PubMed

Publication types

MeSH terms