. 2019 Apr;22(4):545-555.
doi: 10.1038/s41593-018-0333-8. Epub 2019 Feb 18.

Cell-of-origin susceptibility to glioblastoma formation declines with neural lineage restriction

Affiliations

Cell-of-origin susceptibility to glioblastoma formation declines with neural lineage restriction

Sheila Alcantara Llaguno et al. Nat Neurosci. 2019 Apr.

Abstract

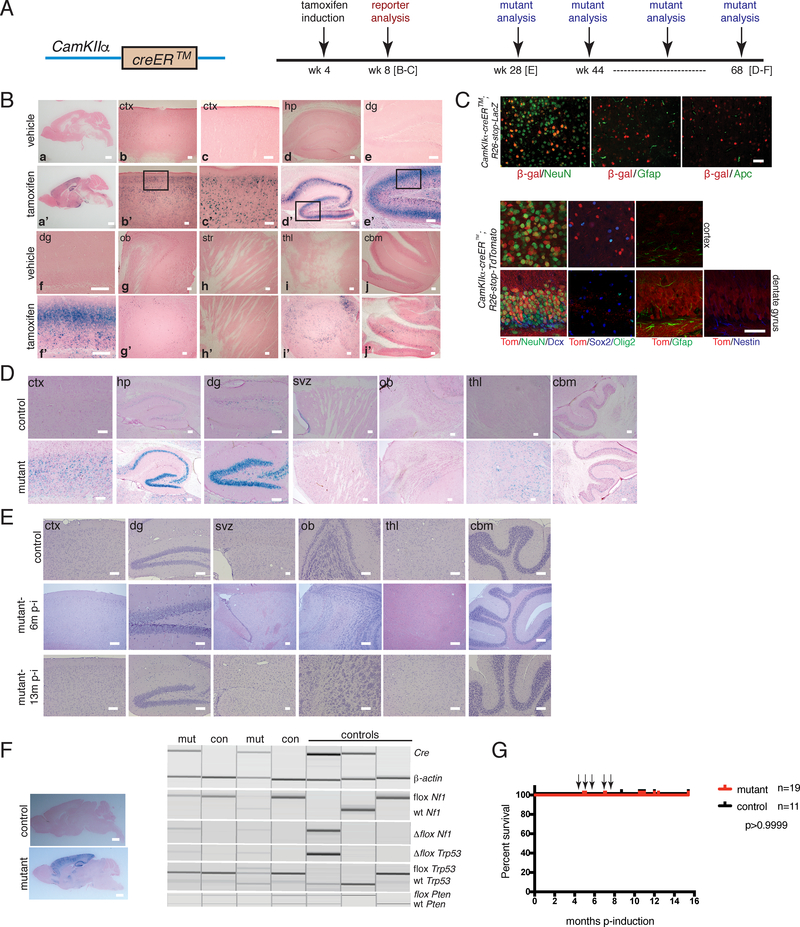
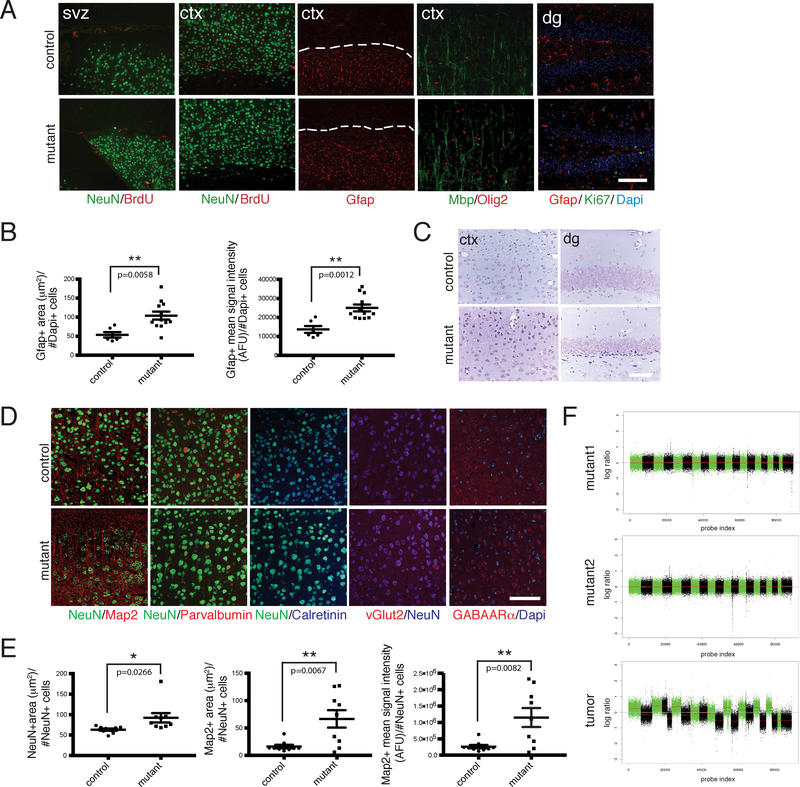
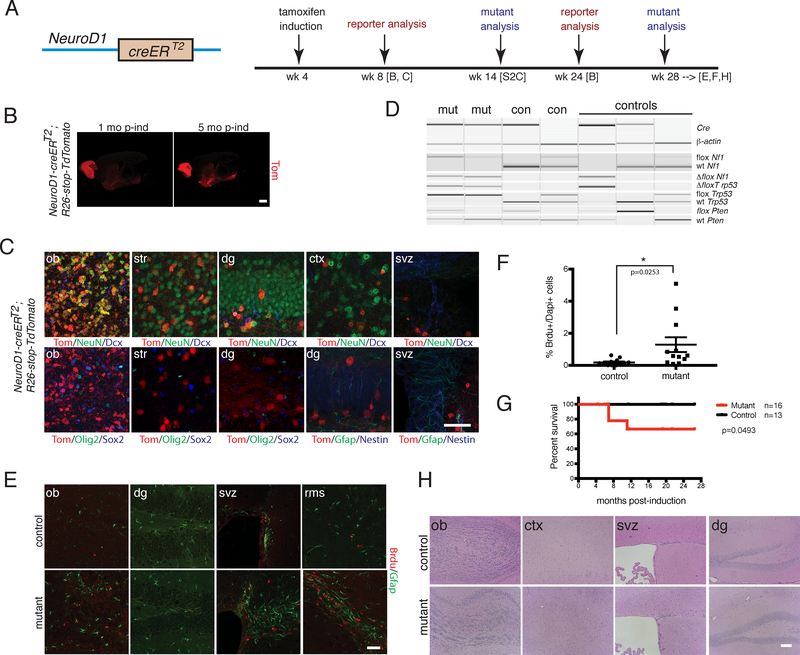
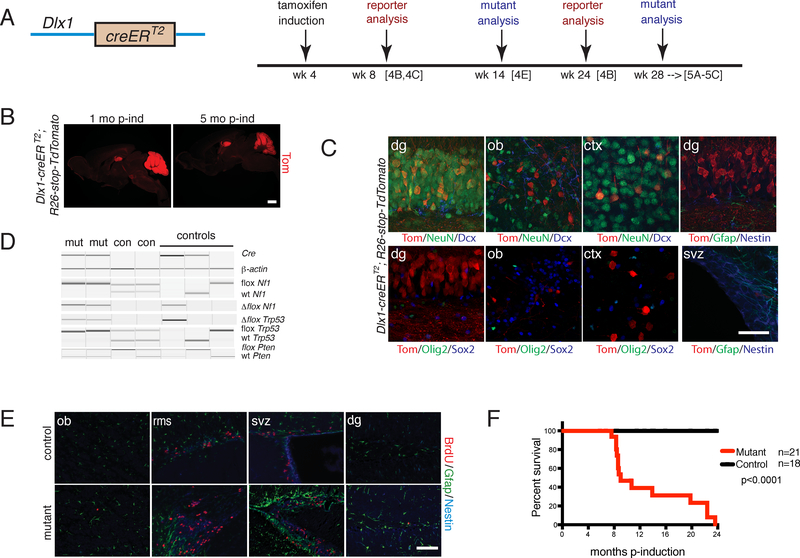
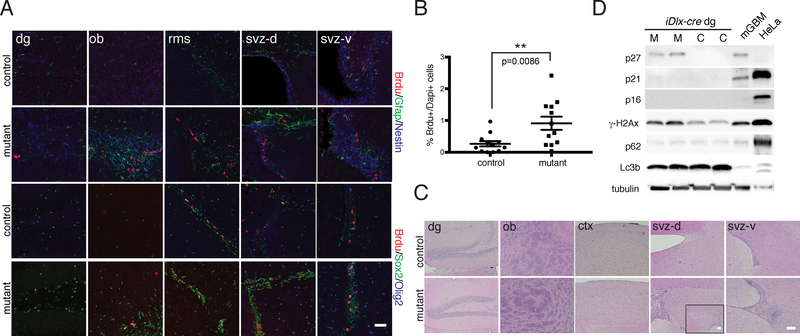
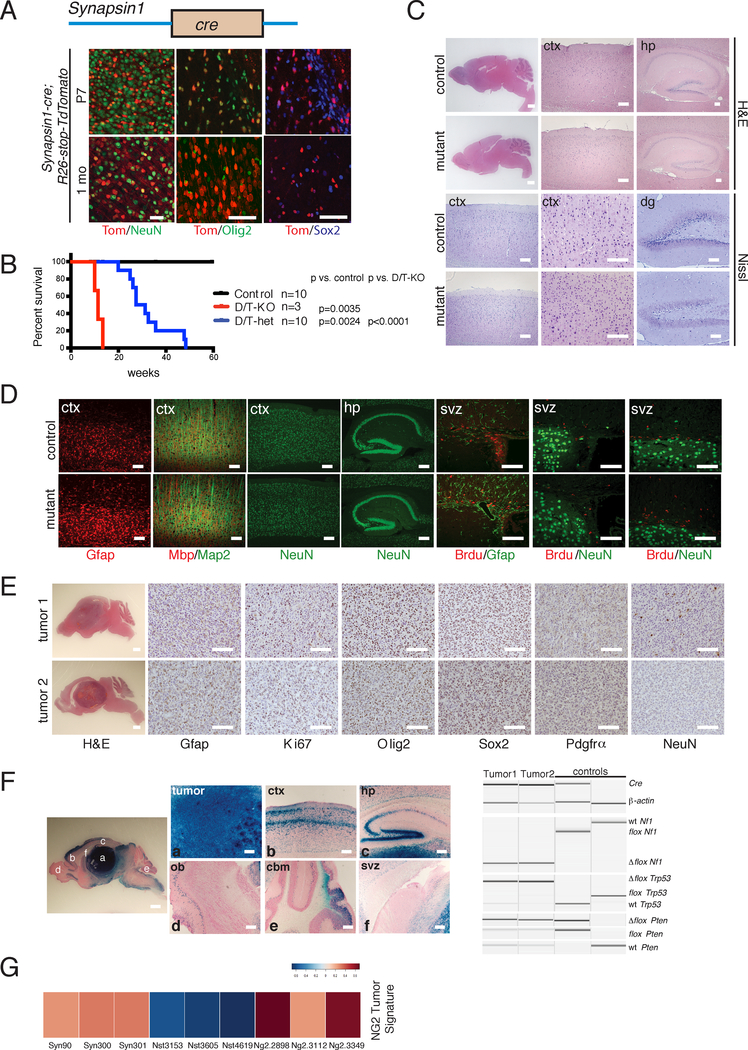
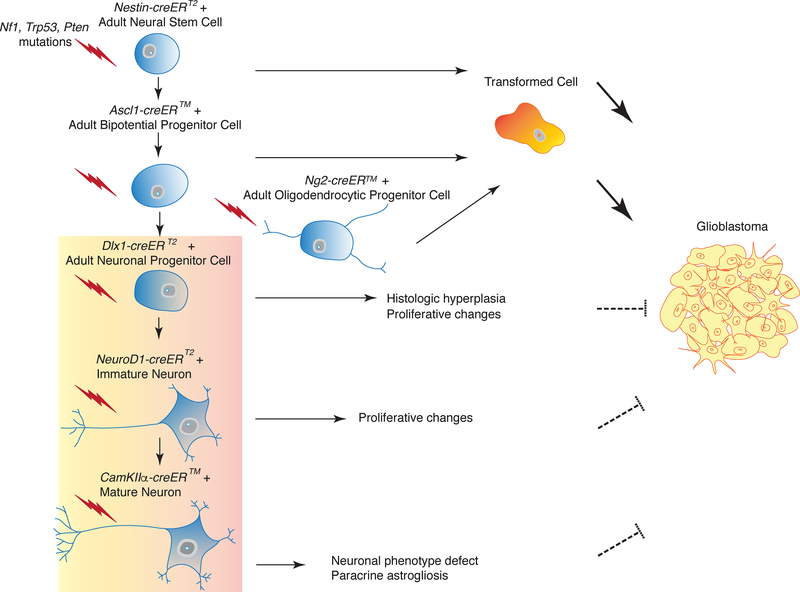
The contribution of lineage identity and differentiation state to malignant transformation is controversial. We have previously shown that adult neural stem and early progenitor cells give origin to glioblastoma. Here we systematically assessed the tumor-initiating potential of adult neural populations at various stages of lineage progression. Cell type-specific tamoxifen-inducible Cre recombinase transgenes were used to target glioblastoma-relevant tumor suppressors Nf1, Trp53 and Pten in late-stage neuronal progenitors, neuroblasts and differentiated neurons. Mutant mice showed cellular and molecular defects demonstrating the impact of tumor suppressor loss, with mutant neurons being the most resistant to early changes associated with tumor development. However, we observed no evidence of glioma formation. These studies show that increasing lineage restriction is accompanied by decreasing susceptibility to malignant transformation, indicating a glioblastoma cell-of-origin hierarchy in which stem cells sit at the apex and differentiated cell types are least susceptible to tumorigenesis.


Figures

Figure 1.
Figure 1.. Tumor Suppressor Deletion in Adult Post-mitotic Neurons Does Not Induce Glioblastoma Development
A. (Left panel) Cartoon of CamKIIa-creER™ (iCK-cre) construct. (Right panel) Timeline of tamoxifen induction and analyses of reporter and mutant strains. B. X-gal staining of tamoxifen-vs. vehicle-induced iCK-cre;R26-stop-LacZ reporter 1 month post-induction (a,a’-whole brain; b,b’-cortex (ctx); c,c’-higher magnification of cortex; d,d’-hippocampus (hp); e,e’-dentate gyrus (dg); f,f’-higher magnification of dentate gyrus; g,g’-olfactory bulb (ob); h,h’-striatum (str); i,i’-thalamus (thl); j,j’-cerebellum (cbm). Scale bars: a,a’=2 mm; b,b’-j,j’=100 μm. C. Immunoflourescence staining of iCK-cre reporters at 1 month post-induction. (Top panel) Immunostaining of iCK-cre;R26-stop-LacZ reporter brain sections using β-galactosidase and cell type-specific markers NeuN (neurons), Gfap (astrocytes), and Apc (oligodendrocytes). (Bottom panel) Immunostaining of iCK-cre;R26-stop-TdTomato reporter brain sections with Tomato and lineage markers NeuN, Dcx (doublecortin), Gfap, Nestin, Sox2 and Olig2. Scale bars=100 μm. D. X-gal staining of iCK-cre mutant vs. control at 12 months post-induction (svz=subventricular zone). Scale bars=100 μm. E. Hematoxylin and eosin (H&E) staining of iCK-cre mutants vs. controls at 6 months and 13 months post-induction. Scale bars=100 μm. F. Genotyping for Cre and recombined, loxP and wild type (wt) alleles of Nf1, Trp53 and Pten (right panel) using micro-dissected mutant (mut) and control (con) brain regions (left panel). Scale bars=2 mm. G. Survival curve of iCK-cre mutants (n=19) vs. controls (n=11). p>0.9999 using Logrank (Mantel-Cox) test. Arrows show n=5 asymptomatic mutant mice that were sacrificed for analysis at 5 to 9 months post-tamoxifen induction for non-health-related reasons. In B-F, experiments were independently repeated with similar results at least n=3 times using at least n=3 different mouse tissue samples for each group.
Figure 2.
Figure 2.. iCK-Cre Mutants Exhibit Astrogliosis and Neuronal Defects.
A. Immunohistochemistry of aged iCK-cre mutant vs. control brain sections using cell type-specific markers Gfap, NeuN, Mbp and Olig2, as well as proliferation markers BrdU (1 hour pulse) and Ki67. Dashed lines show areas with Gfap staining in the cortex. B. Dot plots showing Gfap-positive area (μm2) per number of Dapi-positive cells (left panel; p=0.0058) and Gfap-positive mean signal intensity in AFU (arbitrary fluorescence units) per number of Dapi-positive cells (right panel; p=0.0012) in iCK-cre mutants (n=12) vs. controls (n=6). **p<0.01 using two-tailed unpaired student’s t-test. Data is presented as mean +/− standard error of the mean (SEM). C. Nissl staining of iCK-cre mutant vs. control brain sections. D. Immunoflourescence staining of iCK-cre mutant vs. control brain sections using specialized neuronal markers Map2, Parvalbumin, Calretinin, vGlut2, and GABAARα. E. Quantification of neuronal marker stainings. (Left panel) Dot plot showing the average size of NeuN-positive cells (mean NeuN-positive area per NeuN-positive cell number) in iCK-cre mutants (n=9) vs. controls (n=9). p=0.0266. (Middle panel) Dot plot showing Map2-positive area per NeuN-positive cell number in iCK-cre mutants (n=9) vs. controls (n=9). p=0.0067. (Right panel) Dot plot showing Map2-positive mean signal intensity per NeuN-positive cell number in iCK-cre mutants (n=9) vs. controls (n=9). p=0.0082. *p<0.05, **p<0.01 using two-tailed unpaired Student’s t-test. Data presented as mean +/− SEM. F. Shallow whole genome sequencing of iCK-cre mutants (n=3) compared to controls (n=3). Chromosomal segmentation analysis of mutant recombined brain regions (top 2 panels) and a Synapsin1-cre mutant tumor positive control (bottom panel) showing log ratio of normalized counts between mutant and control on x-axis and probe index on y axis are shown. All scale bars=100 μm. In A and C-D, experiments were independently repeated with similar results at least n=3 times using at least n=3 different mouse tissue samples for each group.
Figure 3.
Figure 3.. iND-cre Immature Neuron Mutants Show Olfactory Bulb Proliferation Defects.
A. (Left panel) Cartoon of NeuroD1-creERT2 (iND-cre) construct; (Right panel) Timeline of tamoxifen induction and analyses of reporter and mutant strains. B. Immunostaining of iND-cre;R26-stop-TdTomato reporter at 1 month and 5 months post-induction. Scale bar = 2 mm. C. Immunostaining of iND-cre;R26-stop-TdTomato reporter using cell type-specific markers at 1 month post-induction. Scale bar=100 μm. D. PCR genotyping for cre and recombined, wild type and conditional tumor suppressor alleles of iND-cre mutant and control brain regions. E. Immunoflourescence staining of aged iND-cre mutant vs. control after a short term BrdU pulse chase. Scale bar=100 μm. F. Dot plot showing % of BrdU-positive cells per Dapi-positive cells in iND-cre mutants (n=12) vs. controls (n=12). p=0.0253. *p<0.05 using two-tailed unpaired student’s t-test. Data is presented as mean +/− SEM. G. Kaplan-Meier survival curve of iND-cre mutants (n=16) vs. controls (n=13). p=0.0493 using Logrank (Mantel-Cox) test. H. H&E staining of aged iND-cre mutant vs. control mouse brains. Scale bar=100 μm. In B-E and H, experiments were independently repeated with similar results at least n=3 times using at least n=3 different mouse tissue samples for each group.
Figure 4.
Figure 4.. Adult Neuronal Progenitor iDlx-cre Targeted Mutants Exhibit Early Defects.
A. (Left panel) Cartoon of iDlx-cre (Dlx1-creERT2) construct; (Right panel) Timeline of tamoxifen induction and analyses of reporter and mutant strains. B. Immunostaining of iDlx-cre;R26-stop-TdTomato reporter at 1 month and 5 months post-induction. Scale bar=2 mm. C. Immunohistochemistry of iDlx-cre reporter at 1 month post-induction using cell type-specific markers. Scale bar=100 μm. D. PCR genotyping for cre and tumor suppressor wild type, conditional and recombined alleles of mutant vs. control tissue. E. Immunoflourescence staining of iDlx-cre mutant vs. control given a short BrdU pulse at 10 weeks post-induction. Scale bar=100 μm. F. Kaplan-Meier survival curve of iDlx-cre mutants (n=21) vs. controls (n=18) p<0.0001 using Logrank (Mantel-Cox) test. In B-E, experiments were independently repeated with similar results at least n=3 times using at least n=3 different mouse tissue samples for each group.
Figure 5.
Figure 5.. iDlx-cre Mutants exhibit Hyperplastic Lesions and Molecular Phenotypes.
A. Immunoflourescence staining of iDlx-cre mutant vs. control with BrdU (after a short term pulse) and lineage markers (svz-d=dorsal SVZ region, svz-v=ventral SVZ region). B. Quantification of % BrdU-positive cells in iDlx-cre mutants (n=12) vs. controls (n=12). p=0.0086. **p<0.01 using two-tailed unpaired Student’s t-test. Data is presented as mean +/− SEM. C. H&E staining of aged iDlx-cre mutant vs. control mouse brains reveal regions of hypercellularity (>28 weeks post-induction). Inset in mutant svz-d showing magnified lateral ventricle. D. Western blot analysis of iDlx-cre mutants and controls using DNA damage (gH2Ax), senescence (p16, p21, p27) and autophagy (Lc3b, p62) markers. Mouse GBM (mGBM) and HeLa cell lysates were used as controls. All scale bars=100 μm. In A and C-D, experiments were independently repeated with similar results at least n=3 times using at least n=3 different mouse tissue samples for each group
Figure 6.
Figure 6.. Syn-cre Mutants Exhibit Ectopic Recombination in Neural Progenitors and OPCs
A. (Top panel) Cartoon of Synapsin1-cre (Syn-cre) construct. (Bottom panel) Immunoflourescence staining of Syn-cre;R26-stop-TdTomato reporter mouse brain using cell lineage markers at P7 and 1 month of age. Scale bars=100 μm. B. Kaplan-Meier survival curve of double/triple knockout (D/T-KO: Syn-cre;Nf1flox/flox;Trp53flox/flox;Ptenflox/+ or Syn-cre;Nf1flox/flox;Trp53flox/flox;Pten+/+; n=3), double/triple heterozygotes (D/T-het: Syn-cre;Nf1flox/+;Trp53flox/+;Ptenflox/+ or Syn-cre;Nf1flox/+; Trp53flox/+;Pten+/+; n=10), and controls (n=10). D/T-KO vs. control: p=0.0035; D/T-het vs. control: p=0.0024; D/T-KO vs. D/T-het: p<0.0001 using Logrank (Mantel-Cox) test. C. H&E and Nissl staining of double/triple knockout mutant brains vs. controls. Scale bars=100 μm except for whole brain=2 mm. D. Immunoflourescence staining of double/triple knockout mutant brains vs. controls using lineage and proliferation markers. Scale bars=100 μm. E. H&E and immunohistochemistry of representative brain tumors using cell lineage and proliferation markers. Scale bars=100 μm except for whole brain=2 mm. F. Recombination of tumor suppressors in Syn-cre Mutants. (Left panel) X-gal staining of a Syn-cre mutant brain section showing different brain regions. (Right panel) PCR genotyping of Syn-cre mutants and controls. Scale bars=100 μm except for whole brain=2 mm. G. Heat map of NG2-creER™ GBM gene expression signature in Syn-cre tumors (n=3, leftmost), as compared with Nestin-creERT2 (n=3, middle) and NG2-creER™ (n=3, rightmost) tumors. In A and C-F, experiments were independently repeated with similar results at least n=3 times using at least n=3 different mouse tissue samples for each group.
Figure 7.
Figure 7.. Model for Tumor Suppressor-Mediated Transformation of Adult Neural Lineage Cells.
Targeting of tumor suppressor mutations (Nf1, Trp53, Pten, symbolized by lightning) in neural stem cells (Nestin-creERT2), bi-potential progenitors (Ascl1-creER™) and oligodendrocyte progenitors (NG2-creER™) leads to transformation and glioma development, whereas targeting of late stage neuronal progenitors (Dlx1-creERT2), newly born neurons (NeuroD1-creERT2) and post-mitotic, differentiated neurons (CamKIIα-creER™) does not. The latter three mouse models show decreasing phenotypic defects with increasing lineage differentiation.

Comment in

References

    1. Sanai N, Alvarez-Buylla A & Berger MS Neural stem cells and the origin of gliomas. N Engl J Med 353, 811–822 (2005). - PubMed
    1. Bond AM, Ming GL & Song H Adult Mammalian Neural Stem Cells and Neurogenesis: Five Decades Later. Cell Stem Cell 17, 385–395 (2015). - PMC - PubMed
    1. Gage FH & Temple S Neural stem cells: generating and regenerating the brain. Neuron 80, 588–601 (2013). - PubMed
    1. Lim DA & Alvarez-Buylla A The Adult Ventricular-Subventricular Zone (V-SVZ) and Olfactory Bulb (OB) Neurogenesis. Cold Spring Harb Perspect Biol 8 (2016). - PMC - PubMed
    1. Huse JT & Holland EC Genetically engineered mouse models of brain cancer and the promise of preclinical testing. Brain Pathol 19, 132–143 (2009). - PMC - PubMed

Methods-only References

    1. Louis DN, et al. The 2016 World Health Organization Classification of Tumors of the Central Nervous System: a summary. Acta Neuropathol 131, 803–820 (2016). - PubMed
    1. Lin SC, et al. Somatic mutation of p53 leads to estrogen receptor alpha-positive and - negative mouse mammary tumors with high frequency of metastasis. Cancer Res 64, 3525–3532 (2004). - PubMed
    1. Flores I, et al. The longest telomeres: a general signature of adult stem cell compartments. Genes Dev 22, 654–667 (2008). - PMC - PubMed
    1. Mi H, et al. PANTHER version 11: expanded annotation data from Gene Ontology and Reactome pathways, and data analysis tool enhancements. Nucleic Acids Res 45, D183–D189 (2017). - PMC - PubMed

Publication types