

Diversity of cytosine methylation across the fungal tree of life
- PMID: 30778188
- PMCID: PMC6533610
- DOI: 10.1038/s41559-019-0810-9
Diversity of cytosine methylation across the fungal tree of life
Abstract
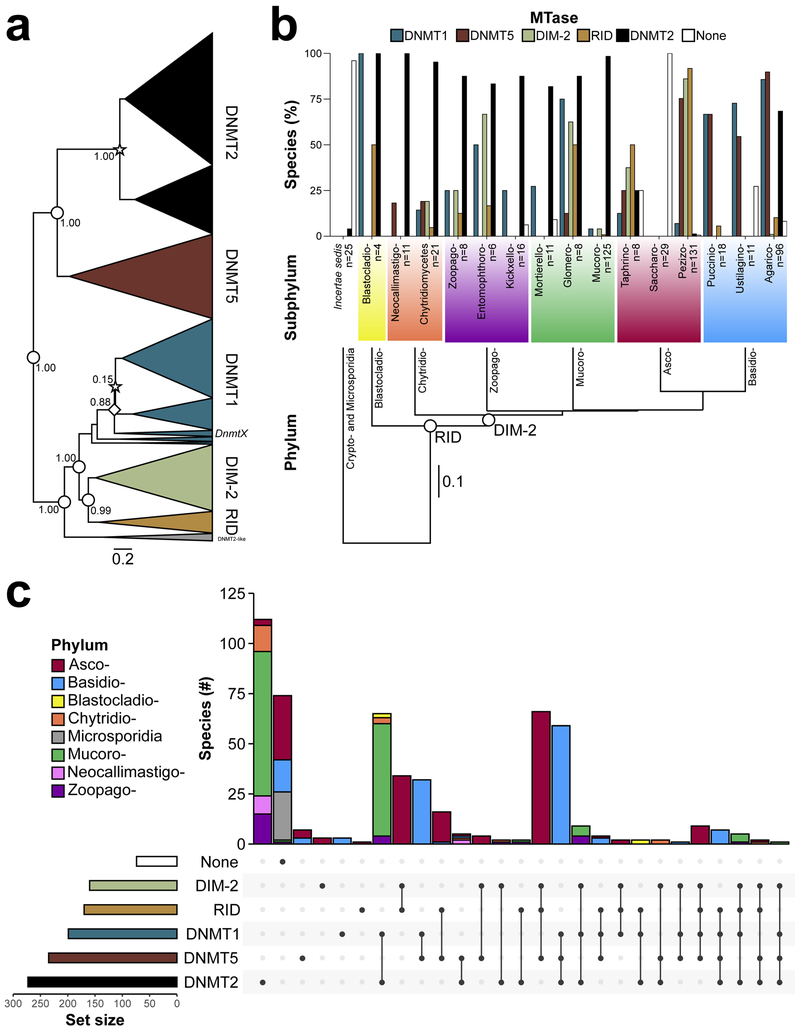
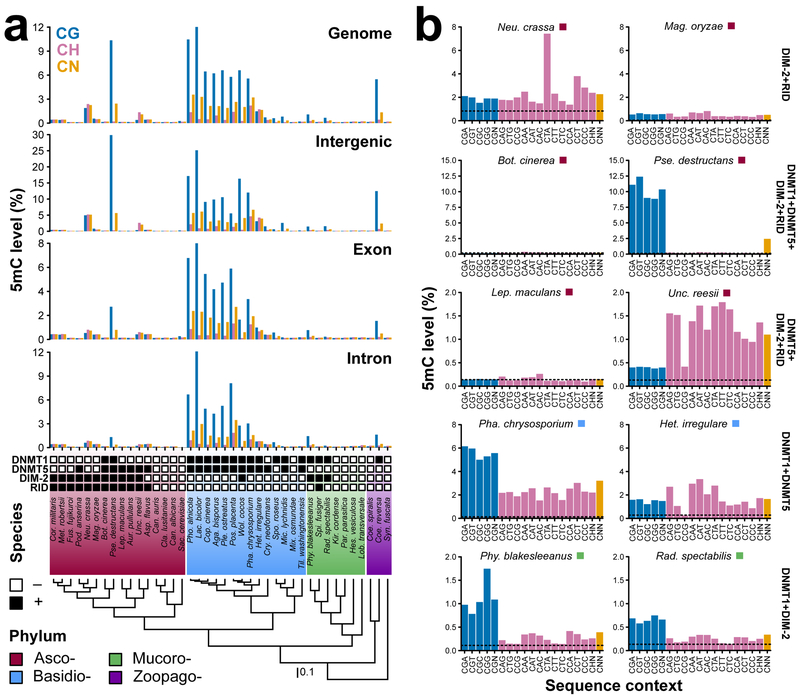
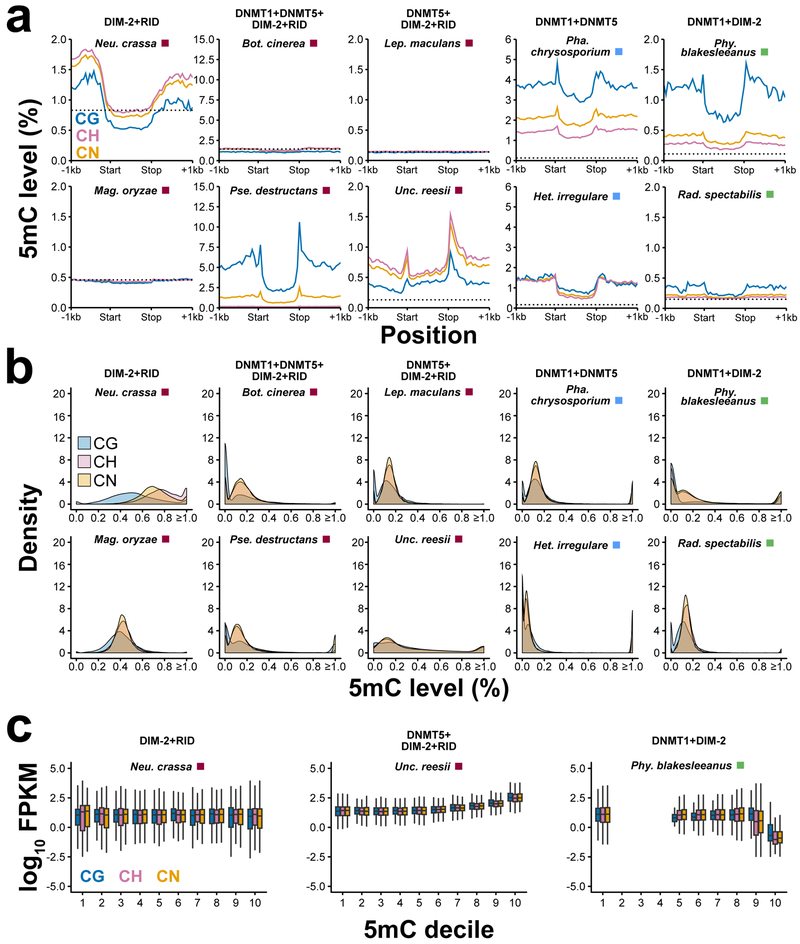
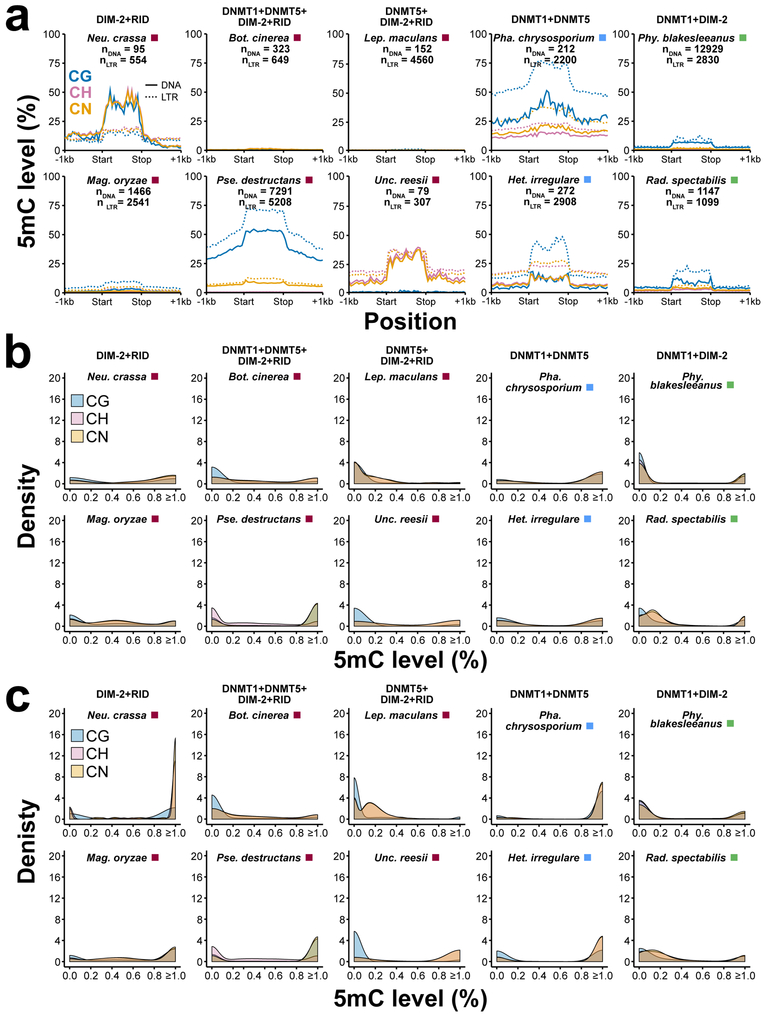
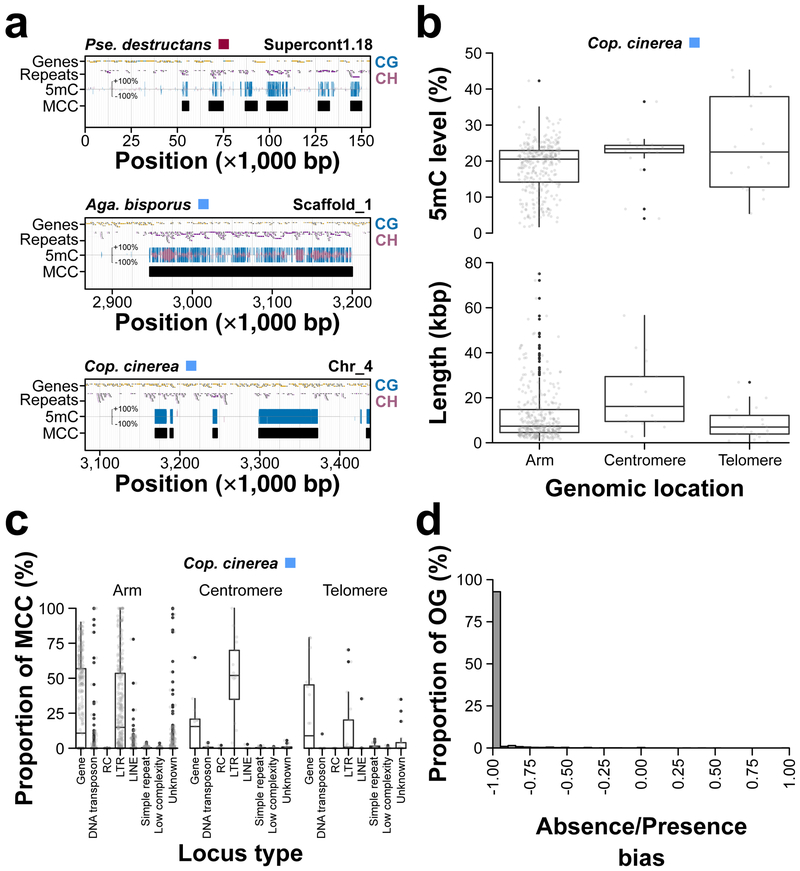
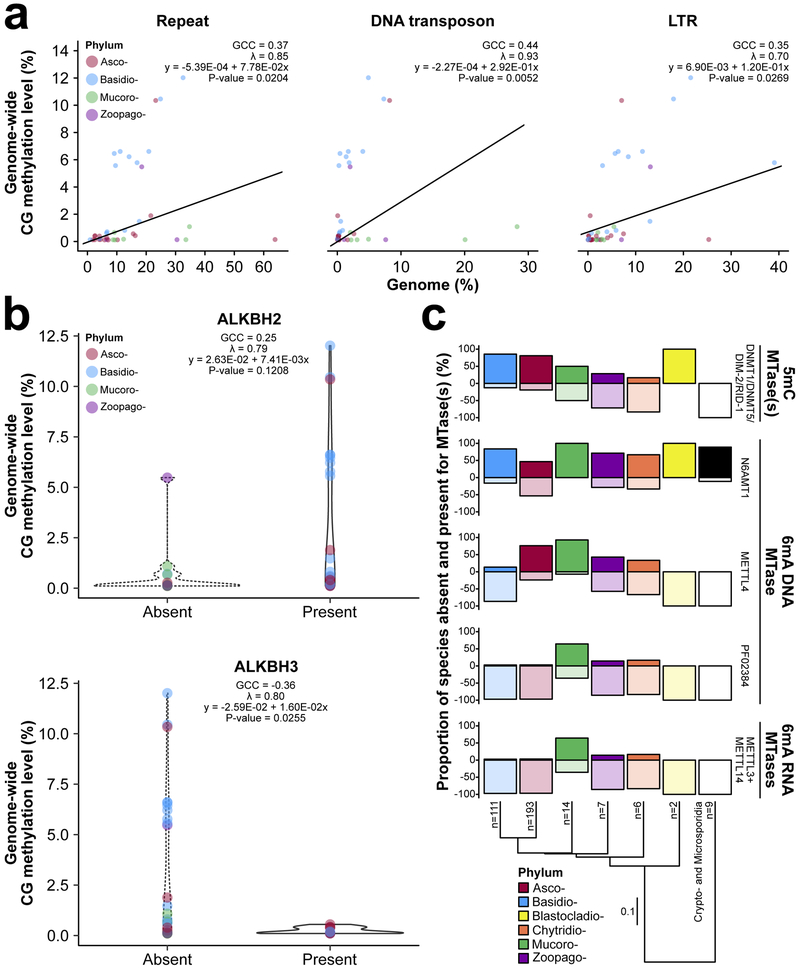
The generation of thousands of fungal genomes is leading to a better understanding of genes and genomic organization within the kingdom. However, the epigenome, which includes DNA and chromatin modifications, remains poorly investigated in fungi. Large comparative studies in animals and plants have deepened our understanding of epigenomic variation, particularly of the modified base 5-methylcytosine (5mC), but taxonomic sampling of disparate groups is needed to develop unifying explanations for 5mC variation. Here, we utilize the largest phylogenetic resolution of 5mC methyltransferases (5mC MTases) and genome evolution to better understand levels and patterns of 5mC across fungi. We show that extant 5mC MTase genotypes are descendent from ancestral maintenance and de novo genotypes, whereas the 5mC MTases DIM-2 and RID are more recently derived, and that 5mC levels are correlated with 5mC MTase genotype and transposon content. Our survey also revealed that fungi lack canonical gene-body methylation, which distinguishes fungal epigenomes from certain insect and plant species. However, some fungal species possess independently derived clusters of contiguous 5mC encompassing many genes. In some cases, DNA repair pathways and the N6-methyladenine DNA modification negatively coevolved with 5mC pathways, which additionally contributed to interspecific epigenomic variation across fungi.
Figures
Similar articles
-
Annelid methylomes reveal ancestral developmental and aging-associated epigenetic erosion across Bilateria.Genome Biol. 2024 Aug 1;25(1):204. doi: 10.1186/s13059-024-03346-z. Genome Biol. 2024. PMID: 39090757 Free PMC article.
-
Widespread adenine N6-methylation of active genes in fungi.Nat Genet. 2017 Jun;49(6):964-968. doi: 10.1038/ng.3859. Epub 2017 May 8. Nat Genet. 2017. PMID: 28481340
-
Recent loss of the Dim2 DNA methyltransferase decreases mutation rate in repeats and changes evolutionary trajectory in a fungal pathogen.PLoS Genet. 2021 Mar 22;17(3):e1009448. doi: 10.1371/journal.pgen.1009448. eCollection 2021 Mar. PLoS Genet. 2021. PMID: 33750960 Free PMC article.
-
Cross-Kingdom DNA Methylation Dynamics: Comparative Mechanisms of 5mC/6mA Regulation and Their Implications in Epigenetic Disorders.Biology (Basel). 2025 Apr 24;14(5):461. doi: 10.3390/biology14050461. Biology (Basel). 2025. PMID: 40427651 Free PMC article. Review.
-
Intertwined evolution of plant epigenomes and genomes.Curr Opin Plant Biol. 2021 Jun;61:101990. doi: 10.1016/j.pbi.2020.101990. Epub 2021 Jan 11. Curr Opin Plant Biol. 2021. PMID: 33445143 Review.
Cited by
-
Three putative DNA methyltransferases of Verticillium dahliae differentially contribute to DNA methylation that is dispensable for growth, development and virulence.Epigenetics Chromatin. 2021 May 3;14(1):21. doi: 10.1186/s13072-021-00396-6. Epigenetics Chromatin. 2021. PMID: 33941240 Free PMC article.
-
Epigenetic regulation of nuclear processes in fungal plant pathogens.PLoS Pathog. 2023 Aug 3;19(8):e1011525. doi: 10.1371/journal.ppat.1011525. eCollection 2023 Aug. PLoS Pathog. 2023. PMID: 37535497 Free PMC article. Review.
-
The stem rust fungus Puccinia graminis f. sp. tritici induces centromeric small RNAs during late infection that are associated with genome-wide DNA methylation.BMC Biol. 2021 Sep 15;19(1):203. doi: 10.1186/s12915-021-01123-z. BMC Biol. 2021. PMID: 34526021 Free PMC article.
-
Genome-Wide Analyses of Repeat-Induced Point Mutations in the Ascomycota.Front Microbiol. 2021 Feb 1;11:622368. doi: 10.3389/fmicb.2020.622368. eCollection 2020. Front Microbiol. 2021. PMID: 33597932 Free PMC article.
-
Mycena genomes resolve the evolution of fungal bioluminescence.Proc Natl Acad Sci U S A. 2020 Dec 8;117(49):31267-31277. doi: 10.1073/pnas.2010761117. Epub 2020 Nov 23. Proc Natl Acad Sci U S A. 2020. PMID: 33229585 Free PMC article.
References
-
- Takuno S, Ran J-H. & Gaut BS. Evolutionary patterns of genic DNA methylation vary across land plants. Nat. Plants 2, 15222 (2016). - PubMed
Publication types
MeSH terms
Substances
Grants and funding
LinkOut - more resources
Full Text Sources
Medical
Molecular Biology Databases
