. 2019 Feb;566(7745):558-562.
doi: 10.1038/s41586-019-0949-1. Epub 2019 Feb 18.

Multiplex chromatin interactions with single-molecule precision

Affiliations

Multiplex chromatin interactions with single-molecule precision

Meizhen Zheng et al. Nature. 2019 Feb.

Abstract

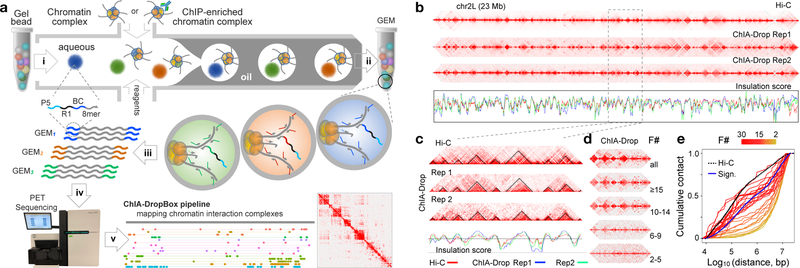
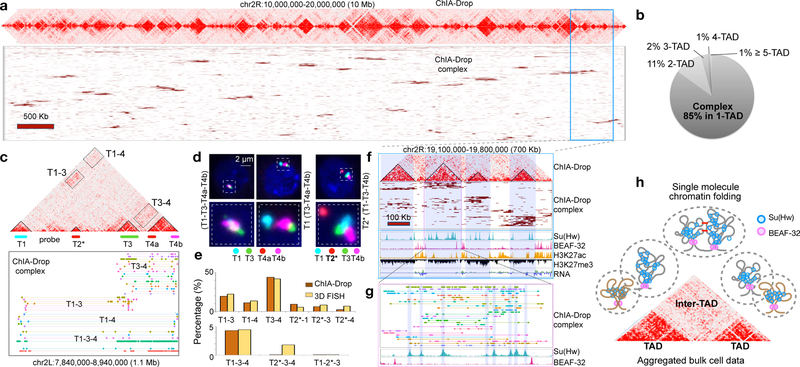
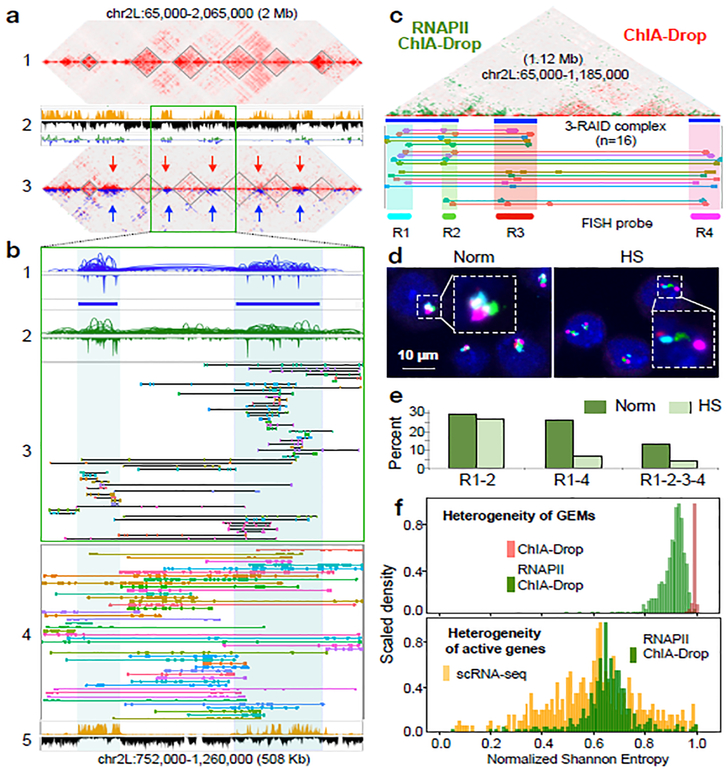
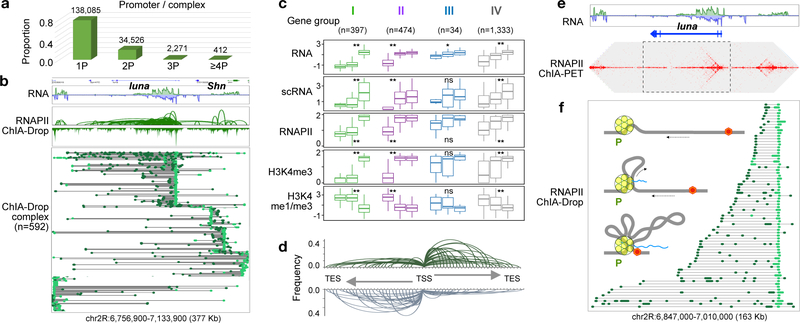
The genomes of multicellular organisms are extensively folded into 3D chromosome territories within the nucleus1. Advanced 3D genome-mapping methods that combine proximity ligation and high-throughput sequencing (such as chromosome conformation capture, Hi-C)2, and chromatin immunoprecipitation techniques (such as chromatin interaction analysis by paired-end tag sequencing, ChIA-PET)3, have revealed topologically associating domains4 with frequent chromatin contacts, and have identified chromatin loops mediated by specific protein factors for insulation and regulation of transcription5-7. However, these methods rely on pairwise proximity ligation and reflect population-level views, and thus cannot reveal the detailed nature of chromatin interactions. Although single-cell Hi-C8 potentially overcomes this issue, this method may be limited by the sparsity of data that is inherent to current single-cell assays. Recent advances in microfluidics have opened opportunities for droplet-based genomic analysis9 but this approach has not yet been adapted for chromatin interaction analysis. Here we describe a strategy for multiplex chromatin-interaction analysis via droplet-based and barcode-linked sequencing, which we name ChIA-Drop. We demonstrate the robustness of ChIA-Drop in capturing complex chromatin interactions with single-molecule precision, which has not been possible using methods based on population-level pairwise contacts. By applying ChIA-Drop to Drosophila cells, we show that chromatin topological structures predominantly consist of multiplex chromatin interactions with high heterogeneity; ChIA-Drop also reveals promoter-centred multivalent interactions, which provide topological insights into transcription.


Conflict of interest statement

The authors declare no competing interests.

Figures

Extended Data Figure 1.
Extended Data Figure 1.. ChIA-Drop method optimization.
The efficiency of the microfluidics system for chromatin DNA barcoding and amplification was characterized by MiSeq sequencing data, where each test generated 2–4 million sequencing reads. The numbers of captured GEM barcodes, the percentages of uniquely mapped reads, and the read length distribution are presented for data quality assessment. a Pure DNA versus chromatin DNA. Both pure DNA and chromatin DNA templates were prepared from the same chromatin sample. The chromatin sample was prepared by in situ HindIII digestion followed by sonication for nuclear lysis. The chromatin DNA used for test was still in crosslinked state, and some DNA positions were bound by protein component. The pure DNA was purified from the chromatin fragment after de-crosslinking. The length of the DNA templates was about 3,000 bp. Most of the pure DNA sequencing reads were in maximum length (130 bp), of which 96% were mappable. The chromatin DNA yield 59% mappable reads. b Distance density comparison of pure DNA and chromatin DNA. The relative probability densities of the log10 of fragment-to-fragment distances in a GEM are plotted, categorized by the fragment number per GEM (F#), color code blue-green-red for fragment F=2, F=3, up to F=11. Both pure DNA (left) and chromatin DNA (right) data are plotted on the same color scale. To be noted, the low-fragment-containing GEMs showed the similar distributions as the pure DNA, whereas the chromatin DNA with high-fragment-containing GEMs displayed different patterns. c 2D heatmap comparison of pure DNA (HindIII, 6-bp cutter), chromatin DNA (Mbol, 4-bp cutter and HindIII). The pure DNA data show random interactions and lack chromatin topological structures; the Mbol chromatin DNA data exhibit little structures, and HindIII chromatin DNA data show rich chromatin contact structures. d Chromatin fragment length by different fragmentation methods. Chromatin sample digested by 4bp-cutter (MboI, ~300 bp) or 6bp-cutter (HindIII, ~3,000 bp), or sheared by sonication (~6,000 bp) were prepared accordingly. The longer chromatin fragments (3,000–6,000 bp) generated more mappable DNA sequencing reads (≥50 bp) than the shorter fragments. e Summary statistics of GEMs from chromatin libraries prepared by Mbol and HindIII digestion. The read statistics between the two libraries are comparable under the same loading amount, but the fragment histograms of GEMs are different. The HindIII data generated more uniquely mappable reads and more high-fragment-containing GEMs than the Mbol data, contributing to the chromatin structures shown in (c). f Chromatin sample loading by different input quantity. Input chromatin DNA of 0.5 ng yield optimal results. When input was too low (i.e., 0.5 pg), the majority of the sequencing reads were only 19–20 bp (barcode primer sequence), indicating that most droplets lack chromatin materials. g Inter-species chromatin experiment. Chromatin samples of Drosophila S2 and human GM12878 cells were mixed in equal number of cells or in equal quantity of chromatin DNA. Barcoded sequencing reads were mapped to each reference genome. Reads with the same GEMbarcode were grouped as a GEM. GEMs with fly-only, human-only, or mixed reads were identified. The ratio of mixed GEMs over the total GEMs is an approximate likelihood of a mixed chromatin complex in a droplet. When tested with equally mixed numbers of cells, the number of GEMs with chromatin fragments of human origin is 20-fold more than GEMs of Drosophila origin (181,956 / 9,149 = 19.89), which reflect the ratio of human to Drosophila genome lengths (hg 3,000 Mb / dm 175 Mb = 17.14). Notably, in the test with equal chromatin mass, the GEMs with mixed origins of fragments were only 5.1%, indicating a small proportion of droplets with mixed chromatin samples.
Extended Data Figure 2.
Extended Data Figure 2.. ChIA-Drop data reproducibility and characterization.
a Genome-wide reproducibility assessment of ChIA-Drop and RNAPII ChIA-Drop. To best assess the data quality and reproducibility, we conducted a comprehensive comparison between 4 datasets (ChIA-Drop, Hi-C, RNAPII ChIA-Drop, and RNAPII ChIA-PET), each with two replicates for reproducibility analysis using HiCRep. Each row and column represent the 8 datasets of interest, and the entry indicates the correlation coefficient (‘scc’ output from HiCRep) between the corresponding row and column. The entries are color-coded by their values, with darker colors for higher values. b Scatter plot of insulation scores between ChIA-Drop replicates. The insulation scores of every 10 kb bins (n=11,918) are computed and plotted genome-wide for both replicates of ChIA-Drop, with Spearman correlation coefficient ρ = 0.83. c Venn diagram of TAD comparison between ChIA-Drop Rep1 and Rep2. Of 471 and 522 TADs called from Rep1 and Rep2 respectively, 79% overlapped. Boxplots of insulation scores for reproducible TADs and replicate-specific TADs show that the reproducible TADs have higher scores (boxplot: middle line, median; box, interquartile range (IQR); whiskers, 1.5xIQR). The unique and intersect parts with either replicates show high differences (two-sided Wilcoxon test p-value < 2.2×10⁻¹⁶ for Rep1, and p-value = 5.42×10⁻¹³ for Rep2). Details in the Supplementary Methods. d Browser view of A/B compartment and TAD of ChIA-Drop and Hi-C data. For a given 1.2 Mb window, ChIA-Drop and Hi-C data heatmaps are presented along with their TADs (triangle) and A (light orange)/B (grey) compartments by eigenvectors, and histone ChIP-seq H3K27ac (golden) and H3K27me3 (black) tracks. Both ChIA-Drop and Hi-C data exhibit similar patterns. e Epigenomic patterns in A and B compartments. Each of the A and B compartments is binned to 300 bins and are extended by 100 bins on both ends. The RPM scaled densities of H3K27ac and H3K27me3 ChIP-seq signals are plotted. f TAD size distribution. From Hi-C and two replicates of ChIA-Drop data, TADs are called via insulation scores. The resulting densities of TAD sizes (lengths) are plotted, with a peak at 142 Kb for all three datasets. g 2D contact map of two replicates of ChIA-Drop data. A 10 Mb region is shown for two replicates in contact heatmaps. HiCRep correlation coefficient, scc = 0.79. h Distribution of contact distances by fragment size. The empirical cumulative distribution function (ECDF) of log10 of contact distances support the observed pattern that small complexes have larger contact distances than large complexes, where the color bar scales from blue, green to red for fragments in ascending order. F#: Fragment number per complex. i Distribution plots for the number of fragments per chromatin complex involved in TADs or in gap regions. j A zoomed-in browser view (1.5 Mb) showing that ChIA-Drop complex clusters associate with TADs. From top to bottom, ChIA-Drop 2D pairwise contact map showing a region with a number of TADs and boundary regions; eigenvector-called A/B (orange/gray, respectively) compartments from ChIA-Drop data; cluster view of the chromatin complexes in this region with binning at 10Kb resolution; fragment view of the chromatin complexes in this region. Each set of the assorted color bars connected by a straight line depicts a ChIA-Drop chromatin complex. A further zoomed-in fragment view (490 Kb), highlighting the inter-TAD chromatin complexes, was shown at the bottom.
Extended Data Figure 3.
Extended Data Figure 3.. Technical validation of ChIA-Drop data.
a Comparison of ChIA-Drop and PacBio detected multiple chromatin complexes. In a given 270 Kb window, a linear fragment view of ChIA-Drop data shows clusters associated with TAD structures. A zoomed-in view displays the overlapping chromatin fragments from ChIA-Drop and PacBio complexes, with matching regions highlighted in light blue. Both complex data exhibit high level of heterogeneity. b Comparison of distributions of fragment number in chromatin complexes in PacBio and ChIA-Drop data. Both methods captured multiplex chromatin complexes at a single-molecule resolution. Under the same cost, PacBio sequencing generated less number of reads than ChIA-Drop sequencing using Miseq. With more reads, ChIA-Drop data show higher multiplexity in chromatin contacts than PacBio data. c ChIA-Drop data of chromatin contacts with multiple fragments were shown in pairwise 2D contact map, complex cluster, and fragment views in this region. The same region was studied by Szabo and colleagues using 3D super-resolution DNA-FISH (3D-SIM), with three probes (1 ‘green’, 2 ‘red’, 3 ‘blue’) designed to test intra-TAD contacts (probe 1–2) and inter-TAD contacts (probe 1–3, 2–3, and 1-2-3). ChIA-Drop detected all combinations possible pairwise and 3-way contacts, and the number of GEMs are noted as n. d ChIA-Drop contact frequencies between the 3 loci are plotted. The highest contacts were between the intra-TAD loci 1 and 2, and the 3 other combinations of inter-TAD were low approximately at the same level. The intra-TAD and inter-TAD contact frequencies matched with the physical distances of the three loci as measured by 3D-SIM. More specifically, individual GEMs contained fragments that overlap the 3 probed loci were detected, validating ChIA-Drop for detecting multiplex chromatin contacts. e Diagram of Hox genes cluster BX-C (bithorax complex, comprises three Hox genes, Ubx, abd-A, and Abd-B). The pairwise chromatin contacts between Fab-7/Abd-B and Fab-7/abd-A were shown by 2-color FISH in S2 cells but not in S3 cells. The three loci, bxd, Fab-7 and the Abd-B promoter (Pm), were used to make fluorecent DNA probes as shown. Fab-7 and bxd are separated by approximately 130 kb, Fab-7 and Abd-B Pm by approximately 70 kb. Gene Antp in another Hox gene cluster ANT-C (Antennapedia complex) approximity 10 Mb away from BX-C was also included for a fluorecent probe to provide a nuclear position point in FISH experiment. An arrow indicates gene orientation, square with orange color indicates promoter regulatory elements (PRE), and the colored circle dots represent DNA probes with corresponding colors. f Four-color FISH in Drosophila S2 cells. The three loci (Abd-B, Fab-7, and bxd; n=20, measured in 179 nuclei from two independent biological replicates) were colocalized, and the probe for Antp locus provided spatial nuclear position. The scale bar is either 2 μm or 1 μm as indicated. Right side is zoom-in view of the left side. g Four-color FISH in Drosophila S3 cells. The three loci (Abd-B, Fab-7, and bxd; n=1, measured in 76 nuclei from two independent biological replicates) were notably not colocalized, revealing topological structure of of this Hox gene cluster. Same as in S2 cell, the probe for Antp locus provided spatial nuclear position. h Curves of spatial distances (μm) between pairs of probes measured by Imaris image analysis software v9.2. The modes of the distances of Abd-B to Fab-7 is 0.24 μm in S2 cells (n = 179) and 0.41 μm in S3 cells (n = 76); the modes of the distances of Fab-7 to bxd is 0.28 μm in S2 cells (n = 179), and 0.3 μm in S3 cells (n = 76). In both cells, the modes of the distances of Fab-7 to Antp, are larger than 1.81 μm. i Histogram displays the ChIA-Drop-identified chromatin contacts at the Hox gene locus between Abd-B to Fab-7, Fab-7 to bxd, and Abd-B to Fab-7 to bxd together simultaneously. j Histogram displays proportions of nuclei that were detected colocalization at loci between Abd-B to Fab-7, Fab-7 to bxd, and Abd-B to Fab-7 to bxd together simultaneously. With spatial distance cutoff of 0.24 μm, the more nuclei colocalized in S2 cells (n = 179) than in S3 cells (n = 76). k Distributions of spatial distances (μm) between pairs of probes, measured using the Imaris image analysis software. The modes of the distance distributions for each pair of probes are as follows: T4a-T4b, mode Mo = 0.22 (nuclei, n = 221); T3-T4a, Mo = 0.5 (nuclei, n = 221); T3-T4b, Mo = 0.5 (nuclei, n = 404); T2*-T4b, Mo = 0.78 (nuclei, n = 404); T1-T4b, Mo = 0.63 (nuclei, n = 404). l Spatial distances (μm) of probe pairs in normal S2 cells (n = 213) and heat-shock (HS) treated cells (n = 150), analyzed using the Imaris image analysis software. Upper panel, distributions of spatial distances in the normal, untreated cells (n = 213). The modes of spatial distance distributions for each of the probe pairs are: R1-R2, mode Mo = 0.48; R1-R4, Mo = 0.81. Lower panel, curves of spatial distances in the heat-shock treated cells (n = 150). The modes of spatial distance distributions for each of the probe pairs are: R1-R2, Mo = 0.57; R1-R4, Mo = 1.06. The spatial distances of R1-R2 and R1-R4 observed in HS treated cells were notably larger than in untreated normal cells.
Extended Data Figure 4.
Extended Data Figure 4.. Characterization of RNAPII ChIA-Drop data.
a Comparison of 2D contact maps between ChIA-Drop and RNAPII ChIA-Drop replicates (Rep1 and Rep2) in a 1.8 Mb segments in chr 3L. TADs called in ChIA-Drop are shown in 2D contact maps, along with tracks of histone marks H3K27ac, H3K27me3 and RNA-Seq to illustrate the active and inactive regions. Complex Cluster of RNAPII ChIA-Drop data are shown at the bottom. Notably, contact signals in RNAPII ChIA-Drop data were enriched in active regions but reduced in inactive regions. b Distribution of contact distances by GEM complexity of fragment numbers. The empirical cumulative distribution function (ECDF) of log10 of contact distances support the pattern that small complexes have larger contact distances than large complexes. Color scales for each curve were from the spectrum of blue to green to red for fragment numbers 2 to 30 to 50 in ascending order. F#: Fragment number per complex. c Basic browser view in a 37 Kb window (chr2R:5,423,000–5,460,000) to display the loops and peaks from two replicates of RNAPII ChIA-Drop data. Multiple ChIA-Drop fragments (n = 79) of chromatin complexes (n = 26) were shown in the bottom panel. d Scatter plot shows peaks (n = 14,347) correlation between two replicates inside RAID regions. Pearson correlation coefficient r = 0.92. e Venn diagram shows the loop anchor overlapping between two replicates inside RAID regions. Loop numbers with PET counts cutoff were indicated.
Extended Data Figure 5.
Extended Data Figure 5.. Characterization of RNAPII ChIA-PET data.
a Correlation of RNAPII ChIA-PET data between two replicates. Scatterplot shows two replicates of RNAPII ChIA-PET data, peak coverage (RPM, top, n = 5,924 union peaks), loops frequency (RPM, middle, n = 23,773 overlapped loops), and 2D contact map (100 kb/bin, RPM, bottom, n=1,449,616 bins). Pearson correlation coefficient are r = 0.976, r = 0.928 and r = 0.939 from top to bottom panels, respectively. b Loop span distribution by PET counts. The interaction loop spans (n= 1,461,514) are recorded separately by the PET counts and their distributions are plotted. Those with high PET counts tend to have shorter loop spans than those with low PET counts. Colors denote PET counts. c Mixture model for loop span. The population of loops (n = 17,088 loops) is separated into mid-range interaction (red) and long-range interaction (green) classes through the Gaussian mixture model. Dotted line shows the marginal distribution of the log10(loop span) for loops with ≥ 4 PET counts, and 100 Kb is selected as a cutoff threshold. d Relationship between loop size and PET counts with respect to RAIDs. Loops (n = 90,885, PET ≥ 2) are categorized into intra-RAID (n = 476 RAIDs) if both anchors are in the same RAID and inter-RAID if they span two different RAIDs. The log of loop size and log of PET counts are plotted, with colors indicating the two categories. e Browser view. A 737 Kb region is presented along with RAIDs, epigenomic-defined states (ChromHMM, color codes indict 9 chromatin state), and various ChIP-seq and RNA-Seq signal tracks. Daisy-chain like loops tend to be clustered inside a RAID, but long-range inter-RAID loops also exist. A 59Kb RAID region is highlighted below. f Characteristics of RAIDs (n=476). The lengths, loop PET counts, and gene counts in RAIDs are plotted as histograms and density lines.
Extended Data Figure 6.
Extended Data Figure 6.. Comparison of RNAPII ChIA-PET RNAPII ChIA-Drop.
a 2D contact maps comparison. The 2D contact maps of RNAPII ChIA-PET (lower left) and RNAPII ChIA-Drop (upper right) are displayed at multiple resolutions (whole chromosome 2R, a 10 Mb segment, and two 2.5 Mb domains). Dotted circles highlight the long-range loops identified by both methods. b Loops, peaks and fragment visualization. In a 63 Kb window in chr2R, the RNAPII ChIA-PET loops and peaks are similar for Kc167 and S2 cell lines. Moreover, the RNAPII ChIA-Drop data in loop and peaks veiw are in high concordance with the RNAPII ChIA-PET loops in S2 cells. Individual complexes with multiplex fragments show further details of RNAPII ChIA-Drop data. C#: complex number; F#: fragment number. c Peak correlation. Taking all peaks called by RNAPII ChIA-PET and RNAPII ChIA-Drop inside RAIDs (n = 476), the signal density of peak unions (n = 1,521) in RPM are plotted in log10 scale. Pearson correlation coefficient r = 0.69. d Loop count correlation. The number of loops in corresponding RAIDs (n = 476) identified in RNAPII ChIA-Drop and RNAPII ChIA-PET data were counted for each RAID. The loop counts of each RAID were ploted. Pearson correlation coefficient r = 0.85. e Promoter-to-promoter (PP) correlation. For each gene promoter (n = 9,133 genes with PP interaction), the number of interactions with another promoter were counted in both RNAPII ChIA-PET and RNAPII ChIA-Drop data and are plotted in log10 scale. Pearson correlation coefficient r = 0.76. f Promoter-to-enhancer (PE) correlation. Each gene promoter (n = 7,115 genes with PE interaction) is evaluated for its interactions with enhancers (i.e., ‘non-TSS’) and the counts are plotted (Pearson correlation coefficient r = 0.71). g Loop anchor correlation. Venn diagram shows that 82.9% of the RNAPII ChIA-PET loops with PET ≥ 3 within RAIDs overlap with 60.5% of the RNAPII ChIA-Drop loops with PET ≥ 4 inside RAIDs. h Boxplot of normalized ChIA-Drop fragment coverage in chromatin domains. Left panel: the coverage in active domains (dark green) and inactive domains (dark gray) from ChIA-Drop data or RNAPII-enriched ChIA-Drop data. The active/inactive domains were called by segmenting signals for RNA-Seq and histone modification ChIP-seq (Inactive Domains, n = 706; Active Domains, n = 708; ChIA-Drop, two-sided Wilcoxon test p-value = 0.72; RNAPII_ChIA-Drop, p-value = 6.94×10⁻¹⁴). For each box plot, the middle line indicates the median, the shaded box indicates the IQR (interquartile range), and the whiskers extend to a max of 1.5 × IQR beyond the box. Data points are plotted as dots individually if they are located beyond ends of the whiskers. Details in the Supplementary Methods. i Boxplot of coverage in chromatin domains (boxplot: middle line, median; box, interquartile range (IQR); whiskers, 1.5xIQR). The coverage in TADs (silver) and RAIDs (blue) from ChIA-Drop data or RNAPII ChIA-Drop data (TADs, n = 583; RAIDs, n = 476; ChIA-Drop, two-sided Wilcoxon test p-value = 0.97; RNAPII ChIA-Drop, p-value = 4.61×10⁻⁵). RAIDs are chromosome regions defined by merging high confidential loops (PET ≥ 4, span ≤ 100 kb) from RNAPII ChIA-PET data (Supplementary Methods). TADs were called by calculating insulation score. Detailed statistics in the Supplementary Methods. j Boxplot of the complexity of RNAPII ChIA-Drop chromatin complexes in RAIDs (boxplot: middle line, median; box, interquartile range (IQR); whiskers, 1.5xIQR). RAIDs (n = 476) are binned at 5 Kb resolution and the number of bins covered by each chromatin complex in RNAPII ChIA-Drop data is counted. Individual distributions across each RAID are averaged, with the heights indicating the means and the error bars indicating one standard deviation. The gray bar shows an expected random distribution based on a binomial model, and yellow dots are individual data points. Chromatin complexes from RNAPII ChIA-Drop in RAIDs show lower complexity than expected (i.e., more constrained). k The complexity boxplot of ChIA-Drop significant chromatin complexes in TADs (boxplot: middle line, median; box, interquartile range (IQR); whiskers, 1.5xIQR). TADs (n = 582) are binned at 5 Kb resolution and the number of bins covered by each chromatin complex in ChIA-Drop data is counted. Barplots follow the same convention as panel (j), but unlike in (j), chromatin complexes from ChIA-Drop in TADs show higher complexity than expected (Supplementary Note 2). l Bias towards active genes in RNAPII ChIA-Drop. The number of chromatin complexes (GEM) overlapping with active (n = 7,334) and inactive (n = 3,210) gene promoters inside RAIDs are recorded and are normalized by the number of unique isoforms (Supplementary Methods). The boxplot shows a preference towards active genes (boxplot: middle line, median; box, interquartile range (IQR); whiskers, 1.5xIQR). Two-sided Wilcoxon test p-value < 2.2×10⁻¹⁶. Detailed statistics in the Supplementary Methods. m Bias towards active genes in RNAPII ChIA-PET. Instead of the GEM counts in ChIA-Drop (panel d), the coverage in ChIA-PET are recorded and normalized accordingly. The skew towards active genes are yet again observed (n = 7,334 active genes and n = 3,210 inactive genes) in the boxplot (boxplot: middle line, median; box, interquartile range (IQR); whiskers, 1.5xIQR). Two-sided Wilcoxon test p-value < 2.2×10⁻¹⁶. Detailed statistics in the Supplementary Methods. n Single cell RNA-Seq (scRNA-Seq) and bulk cell RNA-Seq correlation. Using the RPKM of single cell RNA-Seq cell and bulk RNA-Seq expression level for genes in S2 (n = 2,094 genes), the two sets of numbers are plotted in log10 scale (Pearson correlation coefficient r = 0.72). o Single cell RNA-Seq (scRNA-Seq) and bulk cell RNA-Seq visualization. The bulk RNA-Seq expression level and the accumulated scRNA-Seq expressed level show similar profile.
Extended Data Figure 7.
Extended Data Figure 7.. Examples of RNAPII ChIA-Drop data.
a Promoter-centric view of RNAPII ChIA-Drop complexes at the 188 kb region with 28 genes including lilli, a large gene of length 65 Kb. This region contains 518 promoter-linked complexes including one-promoter complexes (1P complex, n = 425), two-promoter complexes (2P complexes, n = 89), and three-promoter complexes (3P complexes n = 4). 2P and 3P complexes are shown in the lower panel. b Among the chromatin complexes involving three promoters (3P), different subgroups were identified based on expression levels of the three genes. Each chromatin complex is displayed as a dot, arranged by similarity via dimensionality reduction and density based clustering (Supplementary Methods). Clusters are color-coded. c 3-gene complex with one dominant gene. RNAPII ChIA-drop connected promoters of 3 genes RpL28, CG12078, and ckd. Based on the RNA-seq and histone marks, only RpL28 displays active behaviors. The expression level (in RPKM) of the three genes are shown as a bar chart. d 3-gene complex with three dominant genes. All three genes, CG1115, Kat60, and CG12713 -- simultaneously captured by RNAPII ChIA-Drop-- are active with similarly high expression levels. e 3-gene complex with two dominant genes. Only Aats-asp and NAT1 are active, with Mdr49 potentially playing the role of an enhancer (expression level on the right). f An example of intra-genic RNAPII ChIA-Drop data. At the lilli locus, processive promoter-linked multiplex chromatin contacts covering the entire gene body are shown. The number of fragments in a complex reflects potential looping complexity for the one-sided extrusion model in transcription.
Extended Data Figure 8.
Extended Data Figure 8.. Examples of RNAPII ChIA-Drop data.
a Browser view of luna gene. Processive promoter-linked multiplex chromatin contacts covering the entire luna gene body are shown. Only a few chromatin contacts appear in the upstream of the luna gene, indicating the specific chromatin interactions in the direction of gene transcription. b Browser view of shn gene. Similar to luna, the shn locus displays processive promoter-linked multiplex chromatin contacts. Also, 2D contact maps of RNAPII ChIA-PET show chromatin contact “stripe” pattern supporting the RNAPII ChIA-Drop data. c Processive promoter-linked multiplex chromatin contacts at the mam locus. d Processive promoter-linked multiplex chromatin contacts at the locus of Nipped-A and d4 genes in the opposite transcription direction.
Figure 1.
Figure 1.. ChIA-Drop overview
a. ChIA-Drop schematic. i) Chromatin samples or ChIPed samples are loaded to the device to produce Gel-bead-in-Emulsion (GEM) droplets, each with a unique barcode (“P5”, PCR priming site; “R1”, sequencing priming site; “BC”, 16-nt barcode; “8-mer”, random 8-nt). ii) DNA templates in GEMs are annealed for linear amplification and barcoding. iii) Barcoded amplicons are pooled for iv) sequencing and v) mapping via ChIA-DropBox pipeline for visualizations. b. Comparing Hi-C and ChIA-Drop. Insulation scores (red: Hi-C; blue: Rep1; green: Rep2) have Spearman correlation of 0.84 (Rep1 vs. Rep2), 0.60 (Rep1 vs. Hi-C), and 0.72 (Rep2 vs. Hi-C). c. Zoomed view (2.1 Mb) of panel (b). Spearman correlation of insulation scores: 0.87 (Rep1 vs. Rep2), 0.77 (Rep1 vs. Hi-C), and 0.84 (Rep2 vs. Hi-C). d. ChIA-Drop data (chr2R:19.1–20.1Mb): all complexes and then complexes decomposed by fragment number (F). e. Cumulative distribution for the pairwise distances of ChIA-Drop interactions, plotted by fragment number (F) (Blue: significant ChIA-Drop data; black dotted, Hi-C data).
Figure 2.
Figure 2.. Multiplex chromatin interactions from ChIA-Drop
a. ChIA-Drop data shown as “linear multi-fragment views” of complexes with ≥10 fragments. Each row is a complex and columns are 50 Kb bins. b. Proportion of chromatin complexes in single TAD (1-TAD) or multiple TADs (2- to 5-TAD). c. ChIA-Drop data containing 4 TADs. Fluorescent DNA probes T1-T4b were designed. d. FISH images. Left, 4 test probes colocalized (T1-T3-T4a-T4b) in 17 of 404 nuclei; middle, 3 test probes colocalized (T3-T4a-T4b) in 177 of 404 nuclei; right, the control T2* probe far from the other probes in 221 of 221 nuclei. Data are combined from two replicates. e. Percentage of ChIA-Drop complexes involving a given combination of TADs and the corresponding FISH colocalization (Top, 2-TADs; Bottom, 3-TADs). 150 nuclei were analyzed with a 0.28 μm “colocalization” cutoff. f. A 700 kb region in chr2R shows ChIA-Drop complexes binned at 10 kb, along with RNA-Seq and ChIP-Seq of Su(Hw), BEAF-32, H3K27ac, and H3K27me3. g. Further zoom of chromatin complexes (n=29) with their fragments (n=328) (top), along with Su(Hw) and BEAF-32 profiles (bottom). h. Proposed single-molecule model of chromatin folding in topological domains. BEAF-32 defines TAD boundaries. Within domains, chromatin is folded randomly and associated with Su(Hw). Nearby domains likely have random or specific inter-domain contacts (red bars).
Figure 3.
Figure 3.. Characterization of RNAPII ChIA-Drop
a. ChIA-Drop data shows a number of TADs and gap regions (Track-1), along with H3K27ac/me3 and RNA-Seq signals (Track-2). Track-3 shows RNAPII ChIA-Drop contacts (red) superimposed with chromatin loops (blue) identified by RNAPII ChIA-PET. Red and blue arrows indicate loci with enriched signals. b. A zoomed-in view of a 508 Kb segment from (a). From top to bottom: 1) RNAPII ChIA-PET loops and peaks in two RAIDs (blue); 2) RNAPII ChIA-Drop loops and peaks (green); 3) RNAPII ChIA-Drop multiplex (F≥5) complexes (n=64) and fragments (n=454) are shown; 4) ChIA-Drop multiplex (F≥10) complexes (n=48) and fragments (n=814) are shown; 5) H3K27ac/me3. c. ChIA-Drop data (red) exhibit multiple TADs. RNAPII ChIA-Drop data (green) are abundant in RAIDs (blue bars). Below, inter-RAID RNAPII ChIA-Drop complexes are displayed and fluorescent DNA probe R1, R2, R3 and R4 are indicated. d. FISH images of 4-color probes. Left, 4 probes colocalized in normal cells (Norm) in 27 of 213 nuclei in two replicates. Right, 4 probes were scattered in heat-shock (HS) cells in 144 of 150 nuclei in two replicates. e. FISH colocalization percentages (Norm, n=213; HS, n=150). f. Histogram ranging from homogeneous (left) to heterogeneous. Top, RNAPII ChIA-Drop (green, n=476) and ChIA-Drop (red, n=582) complexes binned within each domain (statistic=0.95, p<2.2×10⁻¹⁶; two-sided Kolmogorov-Smirnov test). Bottom, heterogeneity for active promoters in each RAID in RNAPII ChIA-Drop (green, n=427) and single-cell scRNA-seq (yellow, n=403) (statistic=0.27, p=2.4×10⁻¹³; two-sided Kolmogorov-Smirnov test).
Figure 4.
Figure 4.. Promoter-centered multiplex chromatin interactions reveal topological insights for transcription.
a. Proportion of chromatin complexes involving one promoter (1P) or more (2P, etc.). b. Browser view of a chr2R segment. RNAPII ChIA-Drop promoter (bright-green)-linked chromatin complexes (n=592) are depicted with non-promoter fragments (dark-green). c. Four subtypes of 3-promoter (3P) chromatin complexes were identified based on expression levels of the three corresponding genes. Three boxplot columns for each group correspond to these three genes involved in each complex (boxplot: middle line, median; box, interquartile range (IQR); whiskers, 1.5xIQR). Two-sided Kruskal–Wallis test yields ‘ns’: p>0.05; *: p≤0.05; **: p<2.2×10⁻¹⁶ for 2,238 genes involved in 3Ps. The y-axes units: “expression RPKM” (RNA), “cell count” (scRNA), “max coverage” (RNAPII, H3K4me3), and “ratio” (H3K4me1/me3). d. Aggregation plot of RNAPII ChIA-Drop data showing average chromatin contact profile over all active genes (plus strand: green; minus strand: gray). e. RNAPII ChIA-PET data in the luna gene shows a chromatin contact “stripe” from the promoter into the gene body. f. RNAPII ChIA-Drop complexes involving luna promoter (n=72). Inset: a one-sided extrusion model for chromatin looping for transcription initiation and extension. RNAPII (yellow circles); promoter (P); DNA (gray line); moving direction (arrow); TES (red hexagon); transcript (blue wavy line).

Comment in

References

    1. Cremer T & Cremer M Chromosome territories. Cold Spring Harbor perspectives in biology 2, a003889, doi:10.1101/cshperspect.a003889 (2010). - DOI - PMC - PubMed
    1. Lieberman-Aiden E et al. Comprehensive mapping of long-range interactions reveals folding principles of the human genome. Science 326, 289–293, doi:10.1126/science.1181369 (2009). - DOI - PMC - PubMed
    1. Fullwood MJ et al. An oestrogen-receptor-alpha-bound human chromatin interactome. Nature 462, 58–64, doi:10.1038/nature08497 (2009). - DOI - PMC - PubMed
    1. Dixon JR et al. Topological domains in mammalian genomes identified by analysis of chromatin interactions. Nature 485, 376–380, doi:10.1038/nature11082 (2012). - DOI - PMC - PubMed
    1. Li G et al. Extensive promoter-centered chromatin interactions provide a topological basis for transcription regulation. Cell 148, 84–98, doi:10.1016/j.cell.2011.12.014 (2012). - DOI - PMC - PubMed

Publication types

MeSH terms