. 2019 Mar;21(3):397-407.
doi: 10.1038/s41556-019-0287-4. Epub 2019 Feb 18.

NAD+ metabolism governs the proinflammatory senescence-associated secretome

Affiliations

NAD+ metabolism governs the proinflammatory senescence-associated secretome

Timothy Nacarelli et al. Nat Cell Biol. 2019 Mar.

Abstract

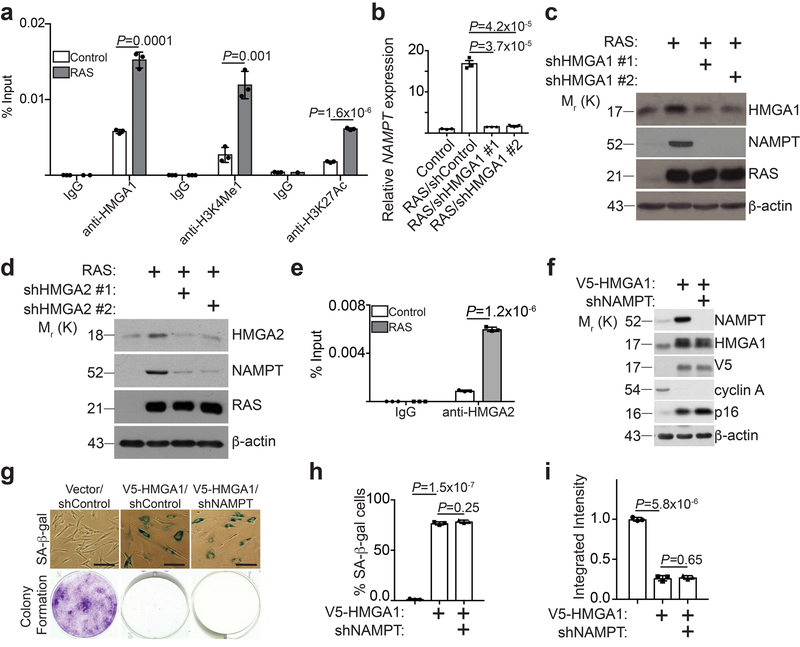
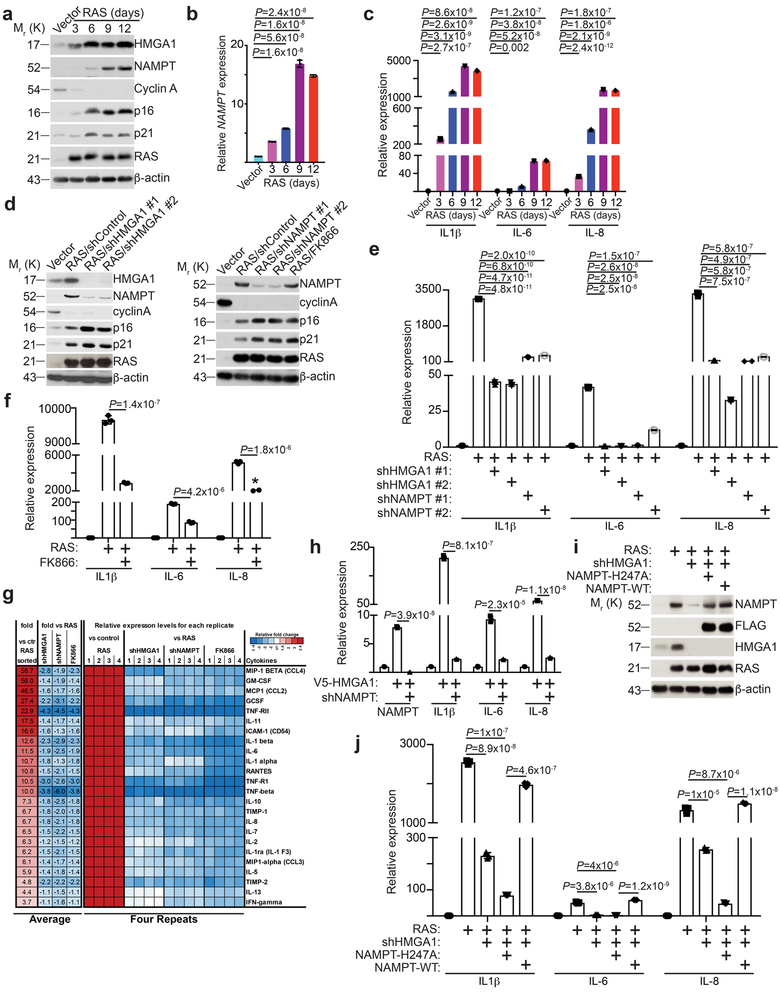
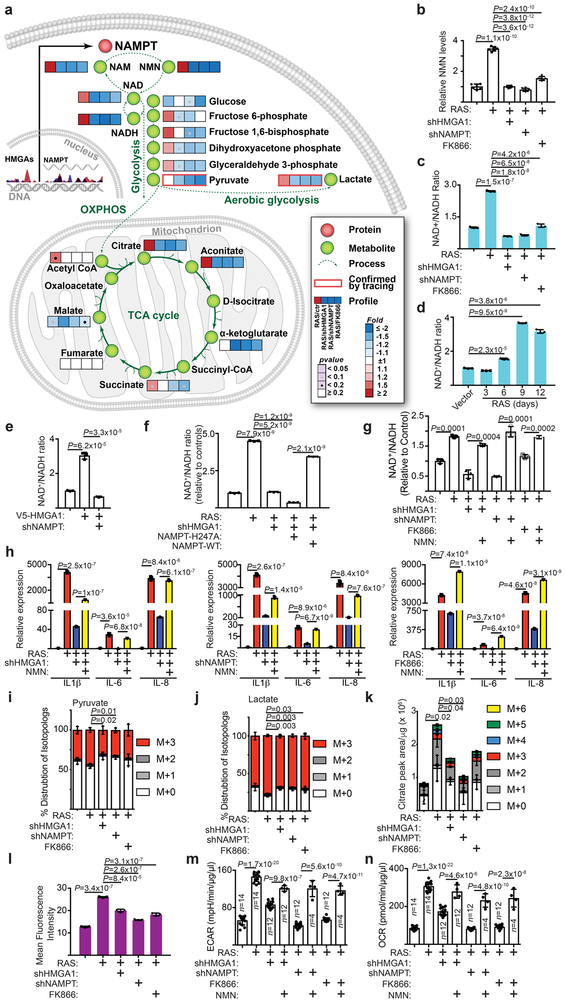
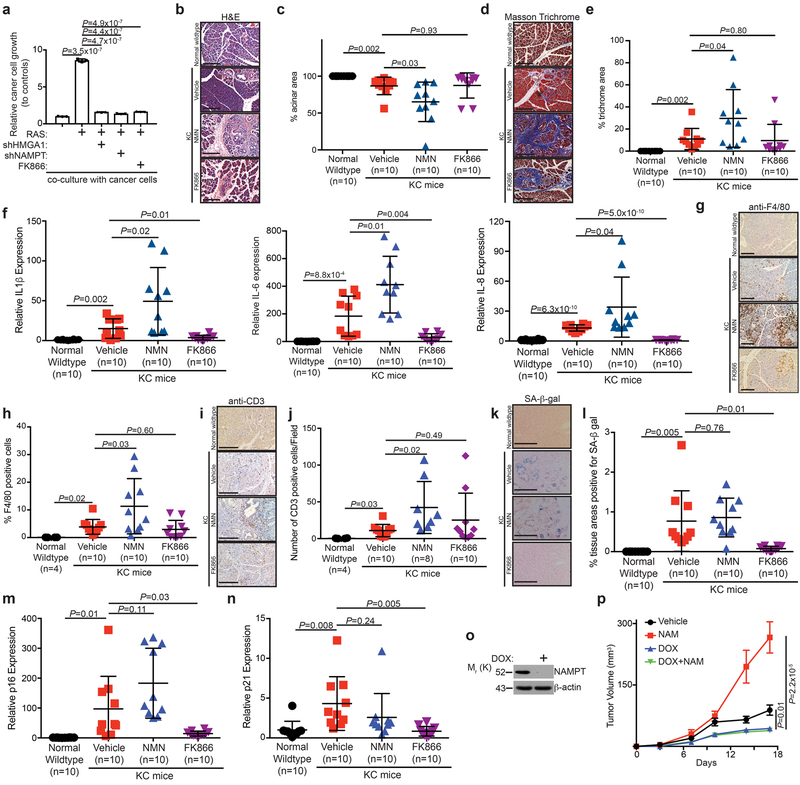
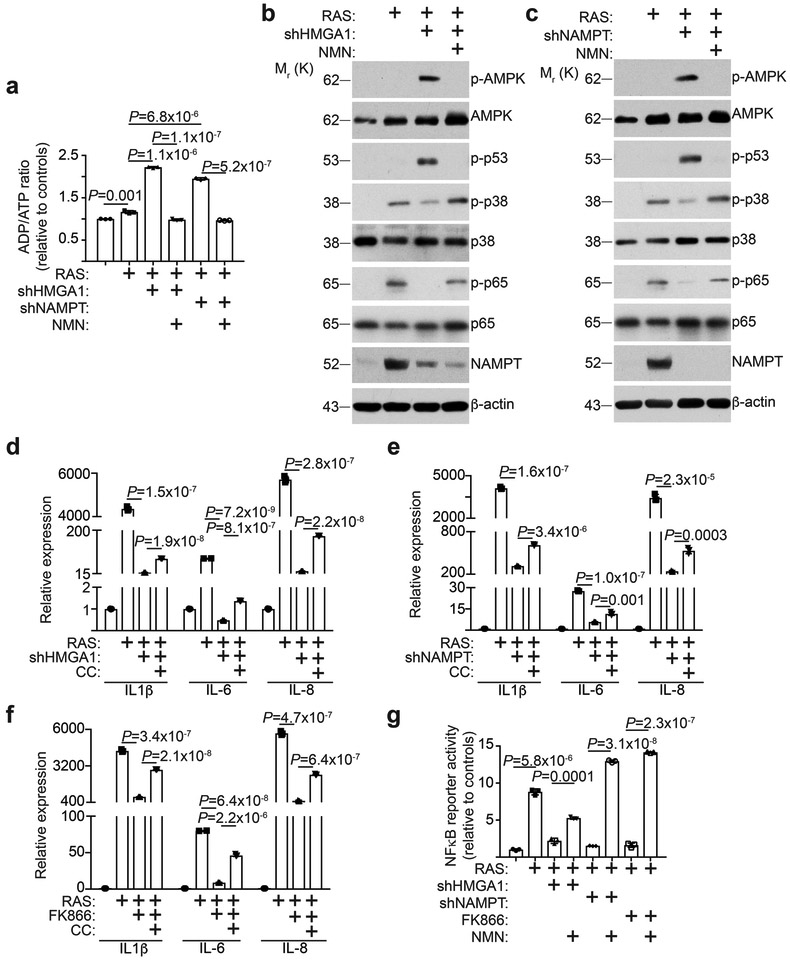
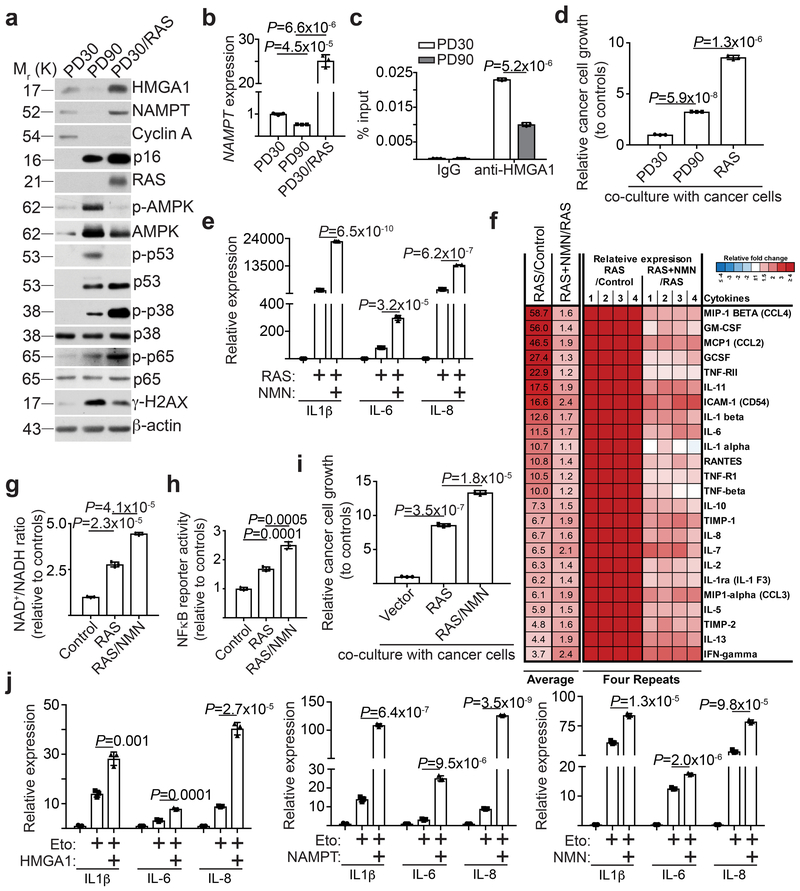
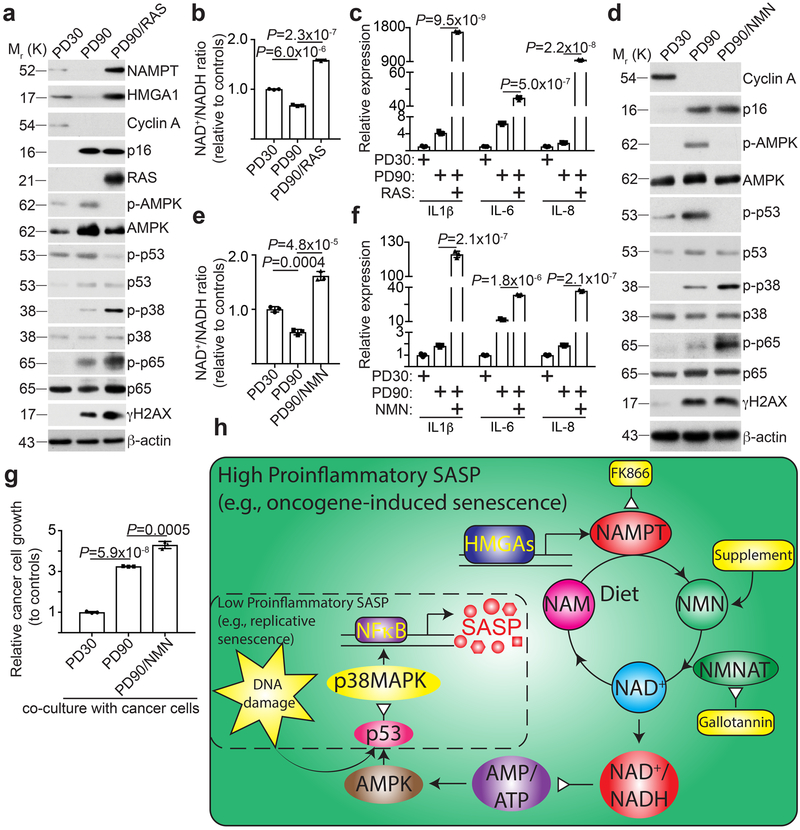
Cellular senescence is a stable growth arrest that is implicated in tissue ageing and cancer. Senescent cells are characterized by an upregulation of proinflammatory cytokines, which is termed the senescence-associated secretory phenotype (SASP). NAD+ metabolism influences both tissue ageing and cancer. However, the role of NAD+ metabolism in regulating the SASP is poorly understood. Here, we show that nicotinamide phosphoribosyltransferase (NAMPT), the rate-limiting enzyme of the NAD+ salvage pathway, governs the proinflammatory SASP independent of senescence-associated growth arrest. NAMPT expression is regulated by high mobility group A (HMGA) proteins during senescence. The HMGA-NAMPT-NAD+ signalling axis promotes the proinflammatory SASP by enhancing glycolysis and mitochondrial respiration. HMGA proteins and NAMPT promote the proinflammatory SASP through NAD+-mediated suppression of AMPK kinase, which suppresses the p53-mediated inhibition of p38 MAPK to enhance NF-κB activity. We conclude that NAD+ metabolism governs the proinflammatory SASP. Given the tumour-promoting effects of the proinflammatory SASP, our results suggest that anti-ageing dietary NAD+ augmentation should be administered with precision.


Figures

Figure 1.
Figure 1.. HMGA proteins regulate NAMPT expression.
a, ChIP analysis for the enhancer of NAMPT gene identified by HMGA1 ChIP-seq using the indicated antibodies or an isotype matched IgG control during OIS (n = 3 independent experiments). b,c, HMGA1 in fully established senescent cells was knocked down using two independent short hairpin RNAs (shRNAs). Expression of NAMPT mRNA was determined by qRT-PCR (b) (n = 3 independent experiments), or the indicated proteins were determined by immunoblot (c). d, In established senescent cells, HMGA2 was knocked down using two independent shRNAs and expression of the indicated proteins was determined by immunoblot. e, ChIP analysis for the enhancer of NAMPT gene identified by HMGA1 ChIP-seq using an anti-HMGA2 antibody or an isotype matched IgG control during OIS (n = 3 independent experiments). f,g, Cells with or without ectopic V5-tagged HMGA1 expression with or without NAMPT knockdown were examined for the expression of the indicated proteins by immunoblot (f), or subjected to SA-β-gal staining or colony formation (g), scale bar = 100 μm. The percentage of SA-β-gal positive cells (h) and the integrated intensity of the colonies formed by the indicated cells (i) were quantified using NIH Image J software (n = 3 independent experiments). All graphs represent mean ± s.d. P values were calculated using a two-tailed t-test. Statistical source data are provided in Supplementary Table 1. Unprocessed original scans of all blots with size marker are shown in Supplementary Fig. 8.
Figure 2.
Figure 2.. HMGA1-mediated NAMPT expression drives the proinflammatory SASP.
a-c, The expression of indicated proteins in cells induced to senesce by oncogenic RAS at the indicated time points was analyzed by immunoblot (a). Expression of NAMPT (b) and the indicated proinflammatory SASP genes (c) were determined by qRT-PCR (n = 3 independent experiments). d-g, In established senescent cells, HMGA1 or NAMPT were knocked down using the indicated shRNAs. The NAMPT activity was also inhibited by FK866. The expression of the indicated proteins was determined by immunoblot (d). Expression of SASP genes was determined using quantitative RT-PCR (n = 3 independent experiments) (e,f). g, The secretion of soluble factors under the indicated conditions were detected by antibody arrays. Heat map indicates fold change in comparison to the control or RAS condition. Relative expression level per replicate and average fold change differences are shown (n = 4 independent experiments). h, V5-HMGA1 overexpressing cells had NAMPT knocked down and expression of NAMPT and the indicated SASP genes were determined using qRT-PCR (n = 3 independent experiments). i-j, In established senescent cells, HMGA1 was knocked down with or without ectopic expression of a FLAG-tagged wild type or catalytically-inactive NAMPT. The expression of the indicated proteins was determined by immunoblot (i). Expression of the indicated SASP genes was determined using qRT-PCR (n = 3 independent experiments) (j). All graphs represent mean ± s.d. P values were calculated using a two-tailed t-test. Statistical source data are provided in Supplementary Table 1. Unprocessed original scans of all blots with size marker are shown in Supplementary Fig. 8.
Figure 3.
Figure 3.. NAD+ metabolism drives proinflammatory SASP.
a-c, In established senescent cells, HMGA1 or NAMPT were knocked down using the indicated short hairpin RNAs. The NAMPT activity was also inhibited by FK866. Steady-state metabolite levels were measured by LC-MS/MS. Heat map indicates fold change in comparison to the control condition (a) (n=6 independent experiments). NMN (b) (n=6 independent experiments) and NAD+/NADH ratio (c) were determined in the indicated cells. d, Cells were induced to senesce by oncogenic RAS and analyzed for the NAD+/NADH ratio at the indicated time points. e, Cells with or without ectopic V5-tagged HMGA1 expression with or without NAMPT knockdown were examined for the NAD+/NADH ratio. f, The NAD+/NADH ratio was determined in established senescent cells with or without HMGA1 knockdown with or without ectopic expression of a FLAG-tagged wild type or catalytically-inactive NAMPT. g,h, In established senescence, HMGA1 or NAMPT were knocked down using the indicated shRNAs. The NAMPT activity was also inhibited by FK866. Under these conditions, cells were treated with NMN and the NAD+/NADH ratio (g) and expression of the indicated SASP genes (h) were determined by qRT-PCR. i-k, Cells from the conditions as in (a) were incubated for 6 hours in the presence of 13C6-glucose and intracellular metabolites were extracted for analysis by LC-MS to evaluate glycolytic flux in the form of pyruvate (i) and lactate (j) and mitochondrial respiration rates as indicated by citrate production (k). Data were normalized based on protein concentration. l, Cells from conditions as in (a) were incubated with a fluorescent glucose analog (2-NBDG) and analyzed by flow cytometry for glucose uptake. m,n, Cells from the conditions in (g) were analyzed using Seahorse Bioanalyzer XFe96 for extracellular acidification (ECAR) (m) and oxygen consumption (OCR) (n). Data were normalized based on protein concentration. n = 3 independent experiments unless otherwise stated. All graphs represent mean ± s.d. P values were calculated using a two-tailed t-test. Statistical source data are provided in Supplementary Table 1.
Figure 4.
Figure 4.. NMN enhances the inflammatory environment and cancer progression in vivo.
a, In established senescent cells, HMGA1 or NAMPT were knocked down or cells were treated with FK866 to assess the effect on the growth of co-cultured luciferase-expressing TOV21G ovarian cancer cells. Cell growth was assessed by luminescence following eight days of growth. (n=3 independent experiments). b-n, Wildtype mice were compared to KC mice treated with vehicle, NMN (500 mg/kg daily), or FK866 (25 mg/kg daily). Representative H&E images of pancreas (b) and quantification of percent acinar area (c). Representative Masson trichrome staining images of pancreas (d) and quantification of percent trichrome area (e). Expression of IL1β, IL-6 and IL-8 was determined using qRT-PCR analysis (f). Representative immunohistochemical staining of infiltrating F4/80-positive immune cells (g) and quantification of percent F4/80 positive cells (h). Representative immunohistochemical staining of infiltrating CD3-positive immune cells (i) and quantification of the number of CD3 positive cells/field (j). Representative SA-β-gal staining (k) and quantification of SA-β-gal positive areas (l) in the indicated treatment groups. Expression of p16 (m) and p21 (n) was determined using qRT-PCR analysis. n=10 mice/group unless otherwise stated. Scale bar for all images is 200 μm. o, Immunoblot of the indicated protein in TOV21G cells containing doxycycline-inducible knockdown of NAMPT with or without doxycycline treatment. p, TOV21G and oncogene-induced senescent IMR90 cells were subcutaneously co-injected into the right dorsal flank of 6-8 week old NSG female mice. The mice (n=9 mice/group) were treated with vehicle control, NAM (500 mg/kg; intraperitoneal injection; every other days) for 17 days. Tumor growth in the indicated treatment groups was measured at the indicated time points. All graphs represent mean ± s.d. P values were calculated using a two-tailed t-test. Statistical source data are provided in Supplementary Table 1. Unprocessed original scans of all blots with size marker are shown in Supplementary Fig. 8.
Figure 5.
Figure 5.. AMPK signaling mediates proinflammatory SASP induced by NAD+ metabolism.
a-c, In established senescent cells, HMGA1 or NAMPT was knocked down using the indicated shRNAs. Under these conditions, cells were treated with NMN and the ADP/ATP ratio (a) and expression of the indicated proteins by immunoblot in the indicated HMGA1 knockdown (b) or NAMPT knockdown (c) cells were determined (n = 3 independent experiments). d-f, In established senescent cells, HMGA1 (d) or NAMPT (e) was knocked down using the indicated shRNAs or treated with FK866 (f). Under these conditions, cells were treated with Compound C (CC, 50 nM), an AMPK inhibitor. Expression of the indicated SASP genes was determined using qRT-PCR (n = 3 independent experiments). (g) In established senescent cells, HMGA1 or NAMPT was knocked down using the indicated shRNAs or treated with FK866. Under these conditions, cells were treated with NMN and NFκB reporter activity was determined (n = 3 independent experiments). All graphs represent mean ± s.d. P values were calculated using a two-tailed t-test. Statistical source data are provided in Supplementary Table 1. Unprocessed original scans of all blots with size marker are shown in Supplementary Fig. 8.
Figure 6.
Figure 6.. HMGA1/NAMPT axis regulates the strengths of SASP.
a, Cells cultured at early passage (population doubling 30, PD30), late passage (population doubling 90, PD90), and oncogene-induced senescence (PD30 expressing oncogenic RAS) were compared. Expression of the indicated proteins was determined using immunoblot. b, Expression of NAMPT mRNA in the indicated cells was determined using qRT-PCR (n = 3 independent experiments). c, The indicated early passage and late passage cells were subjected to ChIP analysis for the NAMPT enhancer site using an anti-HMGA1 antibody. An isotype matched IgG was used as a control (n = 3 independent experiments). d, Cells from the conditions in (a) were assessed for their effects on the growth of co-cultured TOV21G cancer cells (n = 3 independent experiments). e-i, The indicated cells with or without NMN supplementation were compared. Cells were examined for expression of the indicated SASP genes using qRT-PCR (n = 3 independent experiments) (e), secretion of soluble factors using antibody arrays (f), NAD+/NADH ratio (g), NFκb reporter activity (h), and the effects on the growth of co-cultured TOV21G cancer cells (i). The heat map for the antibody array indicates fold change in comparison to the control or RAS + NMN condition. Relative expression level per replicate and average fold change differences are shown (n = 4 independent experiments). j, TOV21G cells overexpressing HMGA1 or NAMPT, or supplemented with NMN, were induced to senesce using etoposide (50 μM for 48 hours) and expression of the indicated SASP genes was determined by qRT-PCR (n = 3 independent experiments). All graphs represent mean ± s.d. P values were calculated using a two-tailed t-test. Statistical source data are provided in Supplementary Table 1. Unprocessed original scans of all blots with size marker are shown in Supplementary Fig. 8.
Figure 7.
Figure 7.. NAD+ metabolism governs the strengths of SASP.
a-c, Cells cultured at early passage (population doubling 30), senescent late passage (population doubling 90), and late passage expressing oncogenic RAS (population doubling 90) were compared. Cells were examined for expression of the indicated proteins by immunoblot (a), NAD+/NADH ratio (b) and expression of the indicated SASP genes using qRT-PCR (c) (n = 3 independent experiments). d-g, The indicated cells with or without NMN supplementation were compared. Cells were examined for the indicated proteins by immunoblot (d), NAD+/NADH ratio (e), expression of the indicated SASP genes using qRT-PCR (f), and the effect on the growth of co-cultured TOV21G cancer cells (g). n = 3 independent experiments. All graphs represent mean ± s.d. P values were calculated using a two-tailed t-test. h, Schematic of the mechanism by which NAD+ metabolism drives the high-proinflammatory SASP. A high-proinflammatory SASP accompanies oncogene-induced senescence that is driven by HMGAs-mediated NAMPT expression and NAD+ metabolism as well as DNA damage signaling (large solid line box). NAD+ metabolism supports metabolic changes and signaling that leads to activation of NFκB signaling and high proinflammatory SASP expression. A low-proinflammatory SASP that accompanies replicative senescence is driven primarily through DNA damage-mediated p38MAPK activation, but devoid of HMGAs-mediated NAMPT expression (dash line box). Statistical source data are provided in Supplementary Table 1. Unprocessed original scans of all blots with size marker are shown in Supplementary Fig. 8.

References

    1. Hayflick L & Moorhead PS The serial cultivation of human diploid cell strains. Exp Cell Res 25, 585–621 (1961). - PubMed
    1. Campisi J Aging, cellular senescence, and cancer. Annu Rev Physiol 75, 685–705 (2013). - PMC - PubMed
    1. Wang X et al. SMARCB1-mediated SWI/SNF complex function is essential for enhancer regulation. Nat Genet 49, 289–295 (2017). - PMC - PubMed
    1. Childs BG et al. Senescent cells: an emerging target for diseases of ageing. Nat Rev Drug Discov 16, 718–735 (2017). - PMC - PubMed
    1. Sieben CJ, Sturmlechner I, van de Sluis B & van Deursen JM Two-Step Senescence-Focused Cancer Therapies. Trends Cell Biol 28, 723–737 (2018). - PMC - PubMed

Publication types

Substances