

Causal relationships among the gut microbiome, short-chain fatty acids and metabolic diseases
- PMID: 30778224
- PMCID: PMC6441384
- DOI: 10.1038/s41588-019-0350-x
Causal relationships among the gut microbiome, short-chain fatty acids and metabolic diseases
Abstract
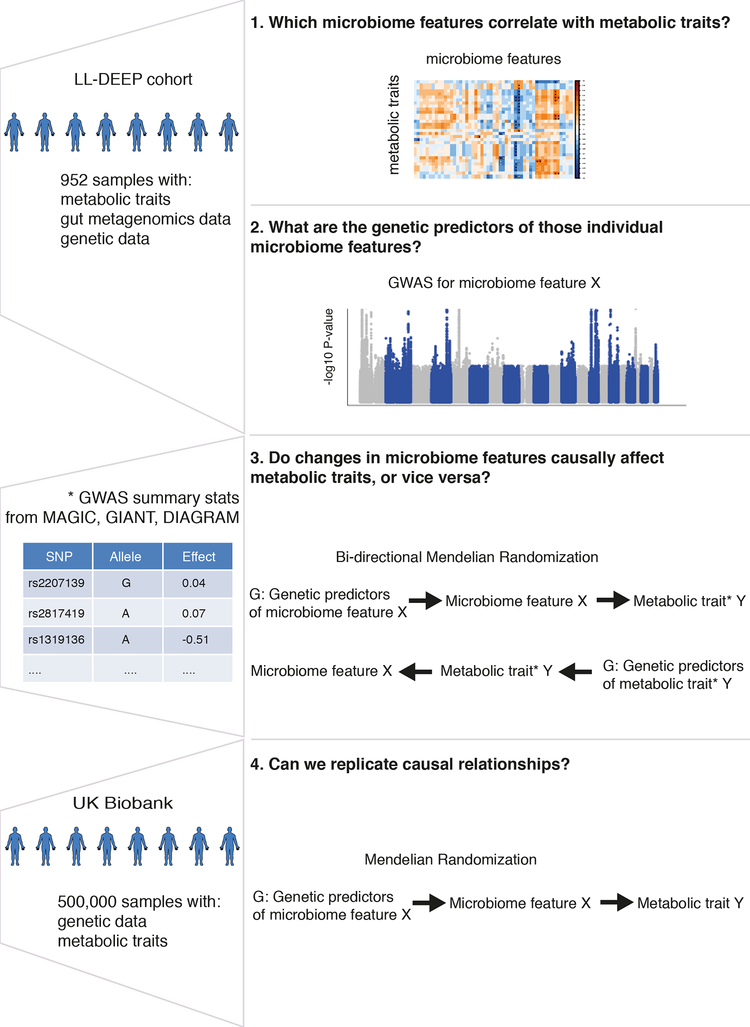
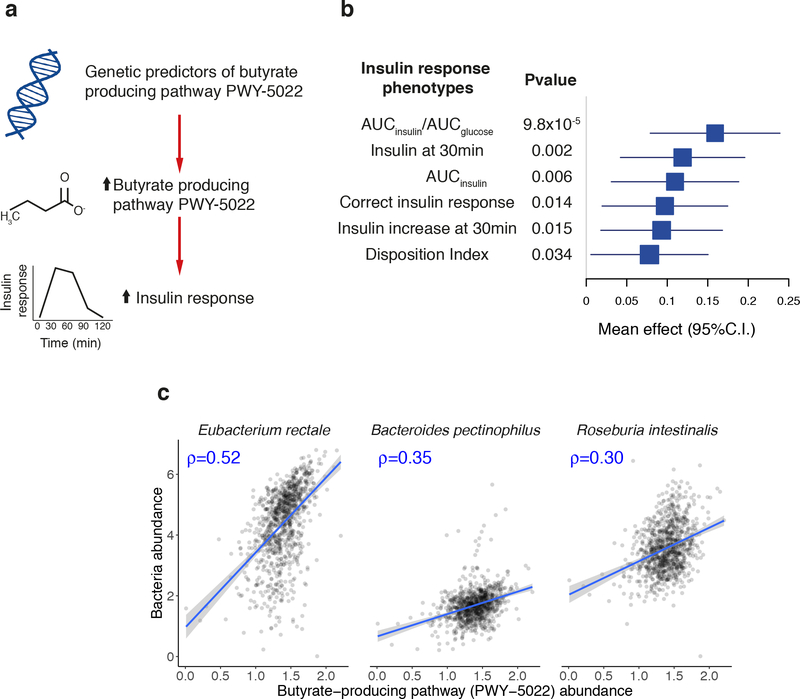
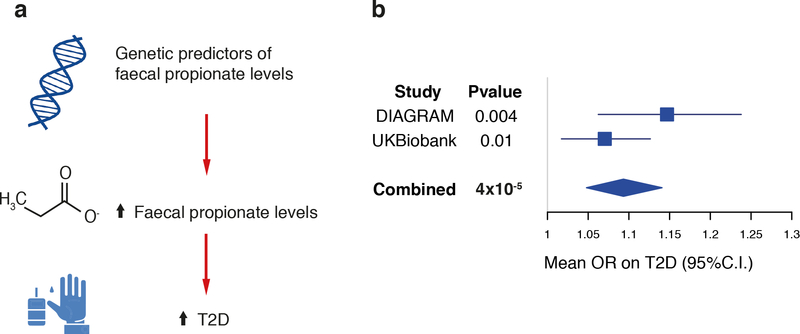
Microbiome-wide association studies on large population cohorts have highlighted associations between the gut microbiome and complex traits, including type 2 diabetes (T2D) and obesity1. However, the causal relationships remain largely unresolved. We leveraged information from 952 normoglycemic individuals for whom genome-wide genotyping, gut metagenomic sequence and fecal short-chain fatty acid (SCFA) levels were available2, then combined this information with genome-wide-association summary statistics for 17 metabolic and anthropometric traits. Using bidirectional Mendelian randomization (MR) analyses to assess causality3, we found that the host-genetic-driven increase in gut production of the SCFA butyrate was associated with improved insulin response after an oral glucose-tolerance test (P = 9.8 × 10⁻⁵), whereas abnormalities in the production or absorption of another SCFA, propionate, were causally related to an increased risk of T2D (P = 0.004). These data provide evidence of a causal effect of the gut microbiome on metabolic traits and support the use of MR as a means to elucidate causal relationships from microbiome-wide association findings.
Conflict of interest statement
Competing Interests statement
M.M serves on advisory panels for Pfizer, NovoNordisk, Zoe Global; has received honoraria from Pfizer, NovoNordisk and Eli Lilly; has stock options in Zoe Global; has received research funding from Abbvie, Astra Zeneca, Boehringer Ingelheim, Eli Lilly, Janssen, Merck, NovoNordisk, Pfizer, Roche, Sanofi Aventis, Servier, Takeda. All other authors declare no competing financial interests.
Figures
Comment in
-
Mendelian randomization reveals causal effects of the gut microbiota.Nat Rev Gastroenterol Hepatol. 2019 Apr;16(4):198-199. doi: 10.1038/s41575-019-0133-y. Nat Rev Gastroenterol Hepatol. 2019. PMID: 30850821 No abstract available.
-
Gut microbial short-chain fatty acids and the risk of diabetes.Nat Rev Nephrol. 2019 Jul;15(7):389-390. doi: 10.1038/s41581-019-0142-7. Nat Rev Nephrol. 2019. PMID: 30918350 No abstract available.
-
SCFAs - the thin microbial metabolic line between good and bad.Nat Rev Endocrinol. 2019 Jun;15(6):318-319. doi: 10.1038/s41574-019-0205-7. Nat Rev Endocrinol. 2019. PMID: 30976118 No abstract available.
References
-
- Bonder MJ et al. The effect of host genetics on the gut microbiome. Nat Genet 48, 1407–1412 (2016). - PubMed
-
- Evans DM & Davey Smith G Mendelian Randomization: New Applications in the Coming Age of Hypothesis-Free Causality. Annu Rev Genomics Hum Genet 16, 327–50 (2015). - PubMed
-
- Karlsson FH et al. Gut metagenome in European women with normal, impaired and diabetic glucose control. Nature 498, 99–103 (2013). - PubMed
Methods-Only References
-
- Li N et al. Pleiotropic effects of lipid genes on plasma glucose, HbA1c, and HOMA-IR levels. Diabetes 63, 3149–58 (2014). - PubMed
-
- Garcia-Villalba R et al. Alternative method for gas chromatography-mass spectrometry analysis of short-chain fatty acids in faecal samples. J Sep Sci 35, 1906–13 (2012). - PubMed
Publication types
MeSH terms
Substances
Grants and funding
LinkOut - more resources
Full Text Sources
Other Literature Sources
Medical
