

doi: 10.1038/s41591-018-0338-6.
Epub 2019 Feb 18.
Development of a CRISPR/Cas9-based therapy for Hutchinson-Gilford progeria syndrome
Affiliations
- PMID: 30778239
- PMCID: PMC6546610
- DOI: 10.1038/s41591-018-0338-6
Item in Clipboard
Development of a CRISPR/Cas9-based therapy for Hutchinson-Gilford progeria syndrome
Nat Med.
2019 Mar.
Abstract
CRISPR/Cas9-based therapies hold considerable promise for the treatment of genetic diseases. Among these, Hutchinson-Gilford progeria syndrome, caused by a point mutation in the LMNA gene, stands out as a potential candidate. Here, we explore the efficacy of a CRISPR/Cas9-based approach that reverts several alterations in Hutchinson-Gilford progeria syndrome cells and mice by introducing frameshift mutations in the LMNA gene.
Conflict of interest statement
Figures
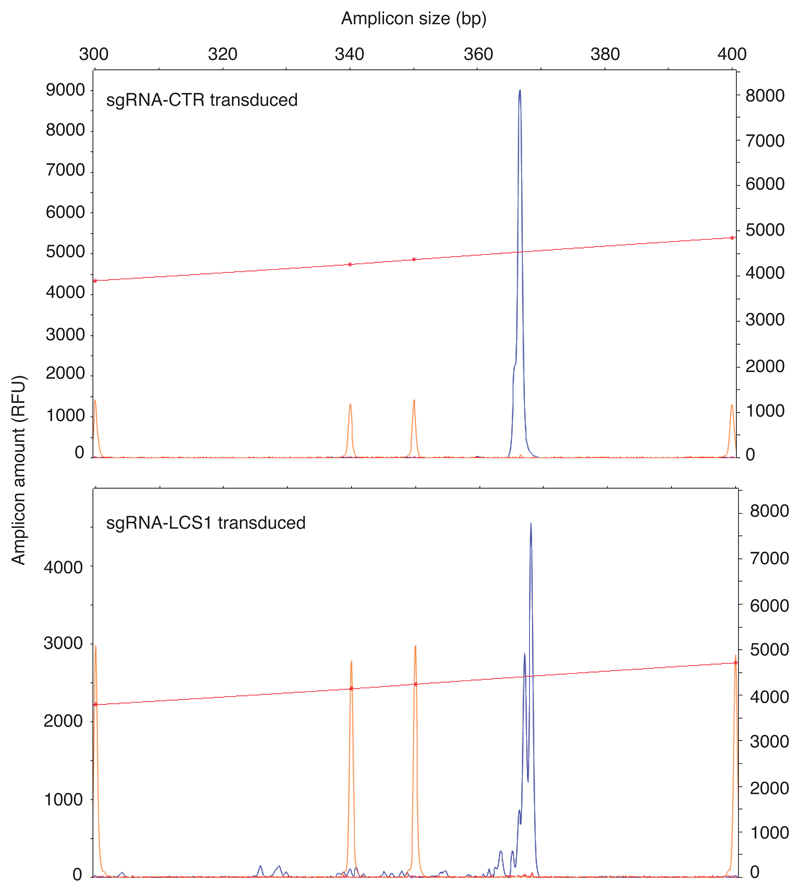
Red line and orange peaks correspond to size standards.
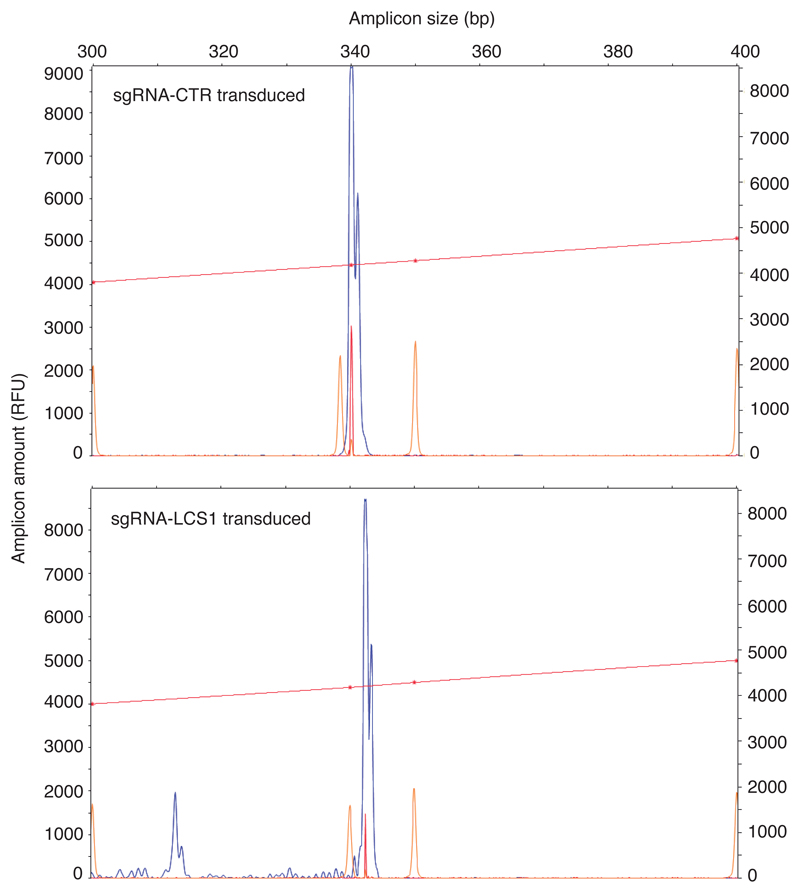
Red line and orange peaks correspond to size standards.
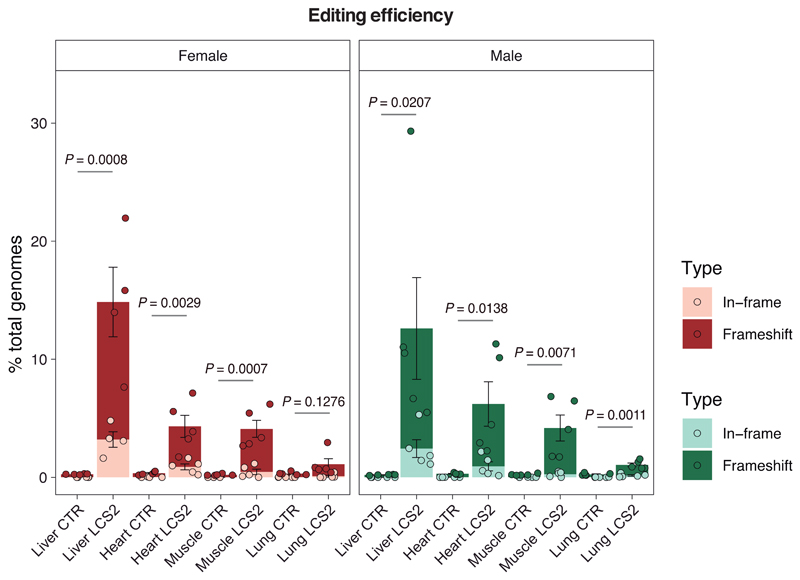
Data are mean ± s.e.m. (n = 5 tissues per group, except in sgRNA-LCS2-transduced female liver where n = 4; two-tailed Student’s t-test).
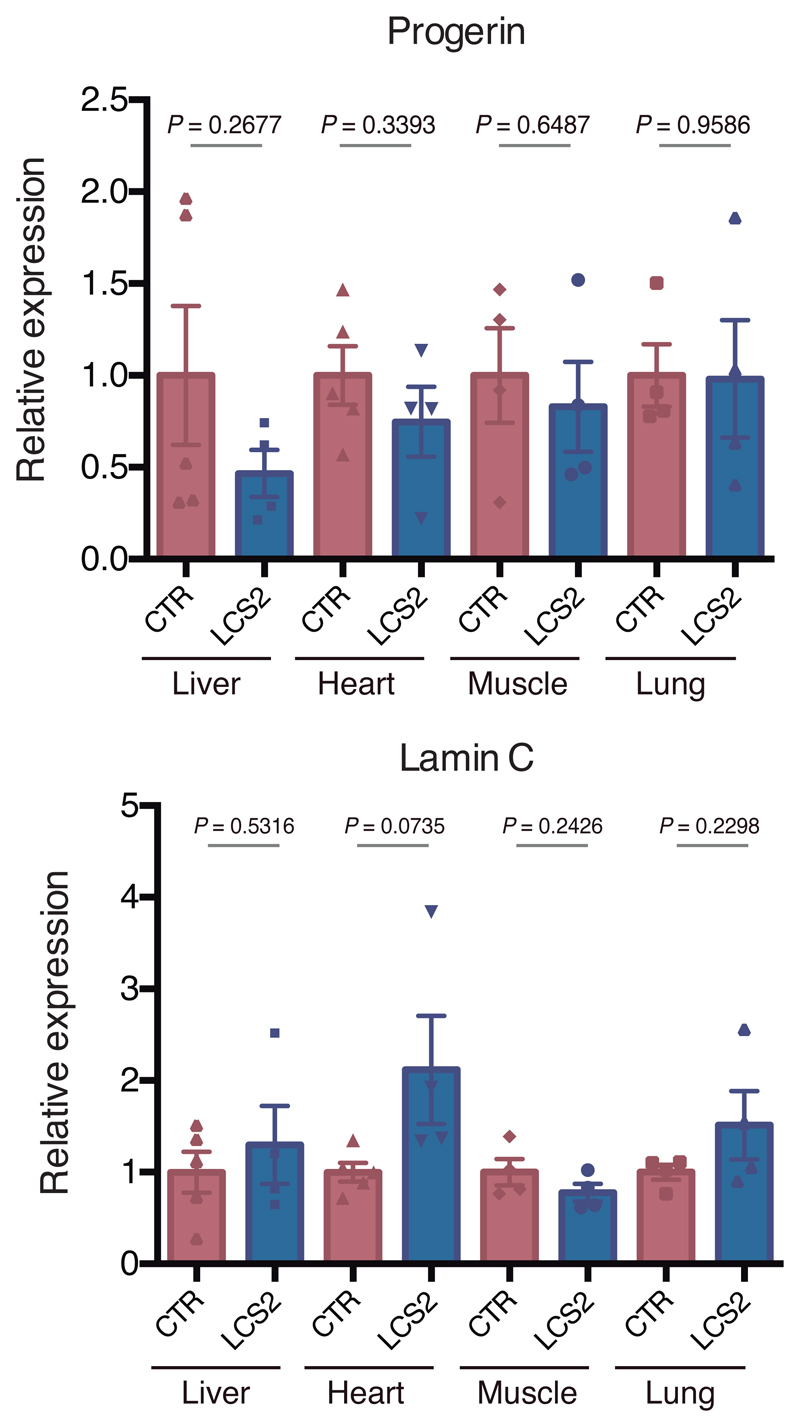
Data are mean ± s.e.m. (n = 4 tissues per group, except sgRNA-control-transduced liver and heart where n = 5; two-tailed Student’s t-test).
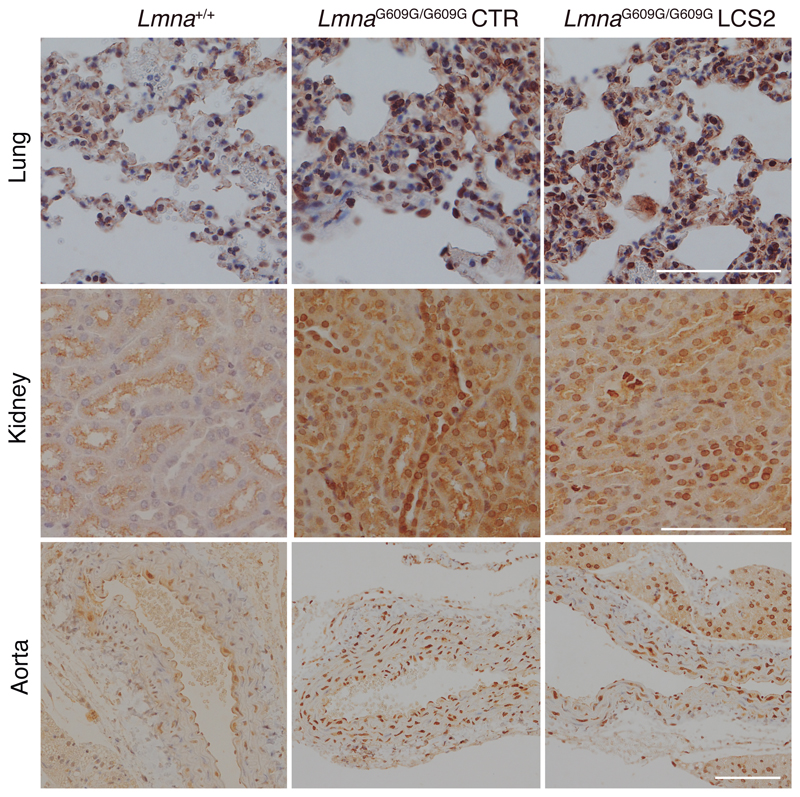
Progerin immunohistochemistry in lung, kidney and aorta from WT, LmnaG609G/G609G sgRNA-control-transduced and LmnaG609G/G609G sgRNA-LCS2-transduced mice (lung and kidney, n = 5 for WT and sgRNA-control-transduced mice and n = 4 for sgRNA-LCS2-transduced mice; aorta, n = 2 for WT and n = 3 for sgRNA-control- and sgRNA-LCS2-transduced LmnaG609G/G609G mice). Scale bar, 100 μm.
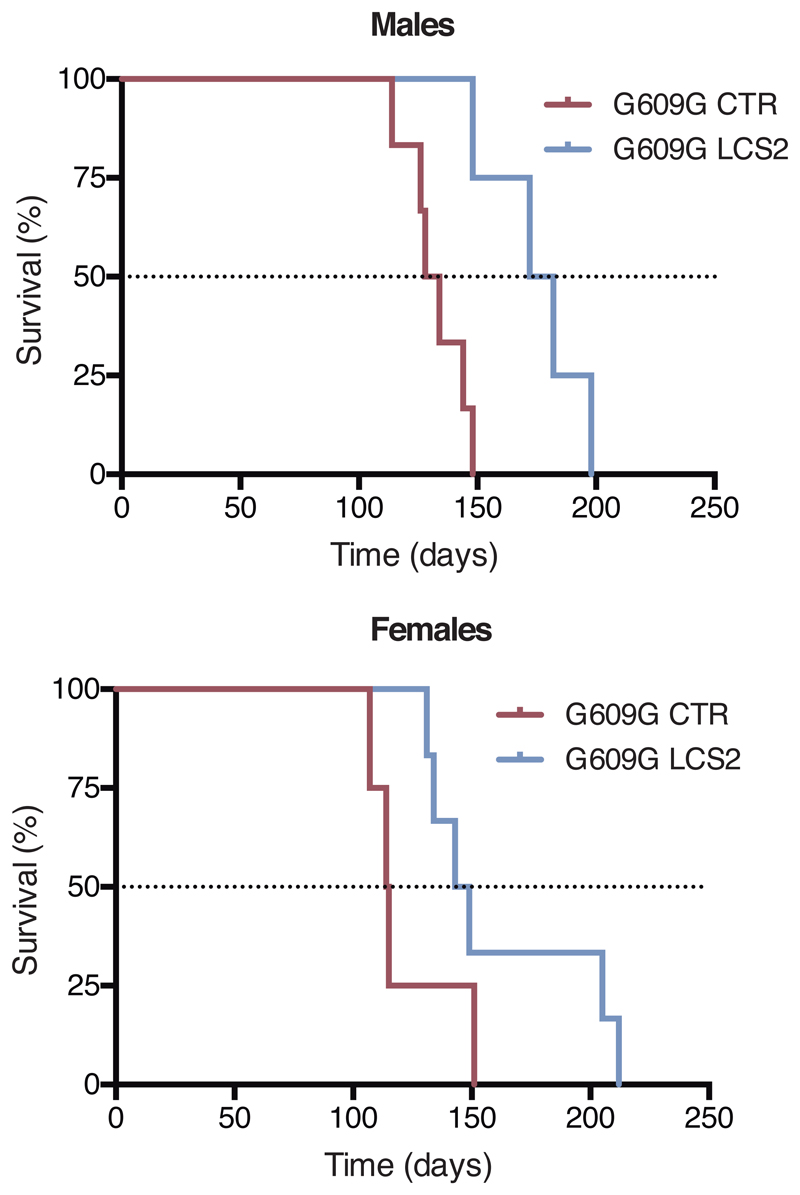
Kaplan–Meier survival plot of LmnaG609G/G609G male and female mice transduced with sgRNA-control (n = 6 males; n = 4 females) or sgRNA-LCS2 (n = 4 males; n = 6 females).
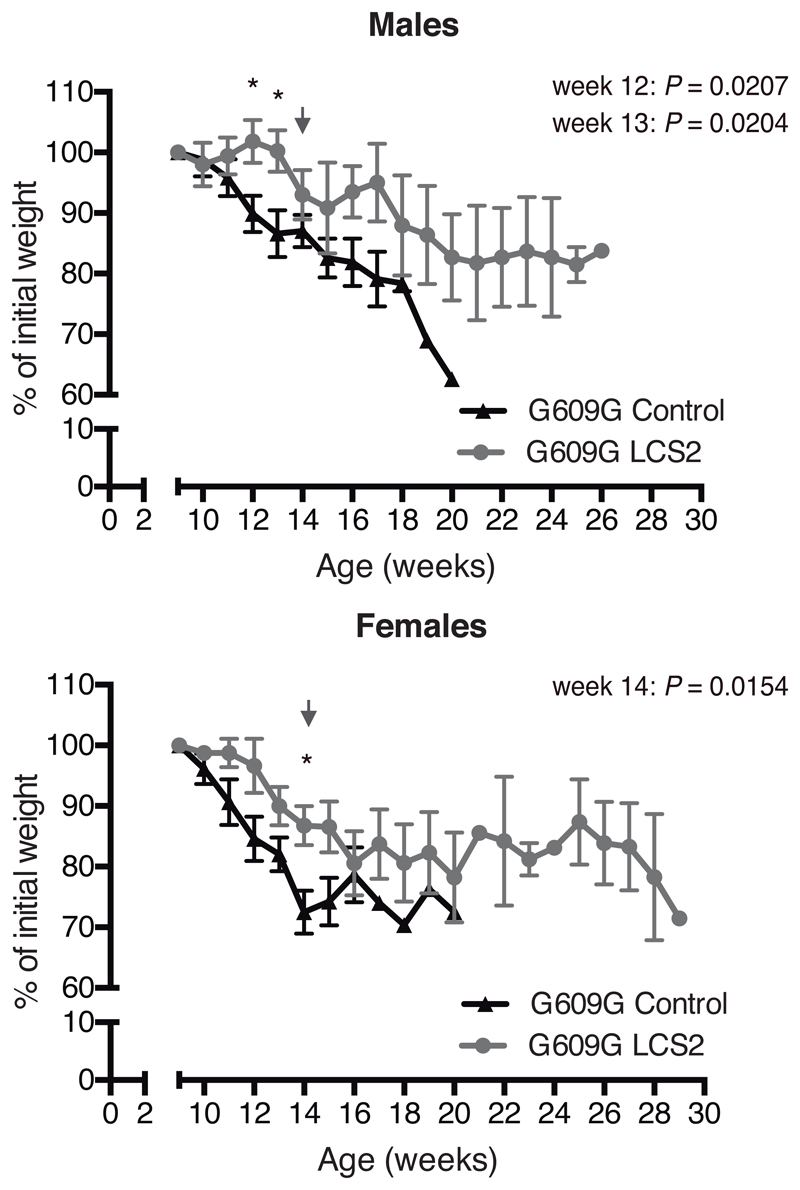
Mean values ± s.e.m. are shown (for males, initial n = 9 sgRNA-control-transduced mice and n = 8 sgRNA-LCS2-transduced mice; for females, initial n = 6 mice per group; two-tailed Student’s t-test). Vertical arrow indicates the time point (3.5 months) at which the cohort destined for histological studies was sacrificed.
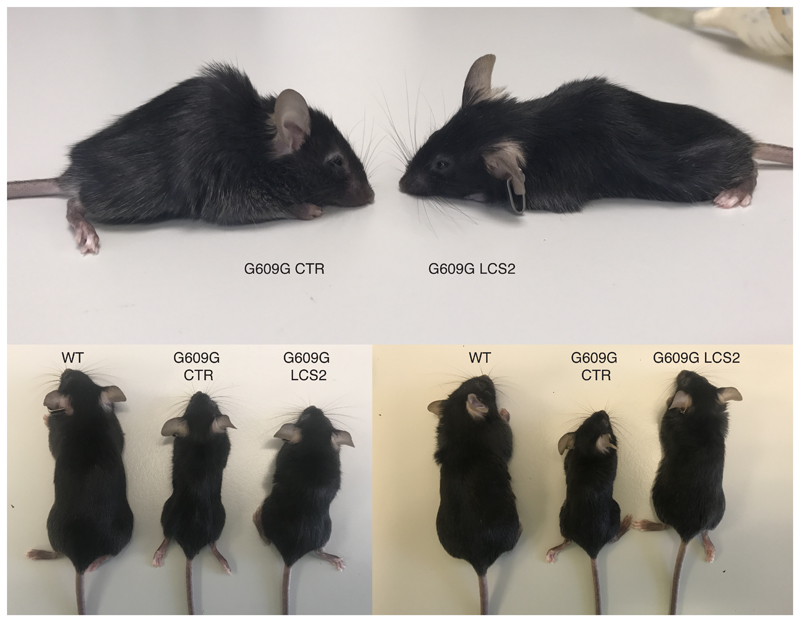
Images of three sex- and age-matched mice transduced with the sgRNA-LCS2 compared to sgRNA-control-transduced animals.
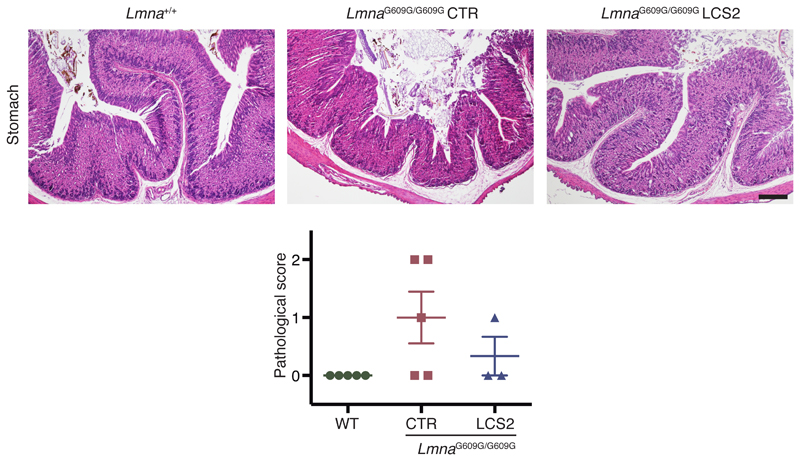
The graph shows atrophy quantification according to a pathological score as described in Methods. Data are mean ± s.e.m. (n = 5 for WT and sgRNA-control-transduced mice; n = 3 for sgRNA-LCS2-transduced mice).
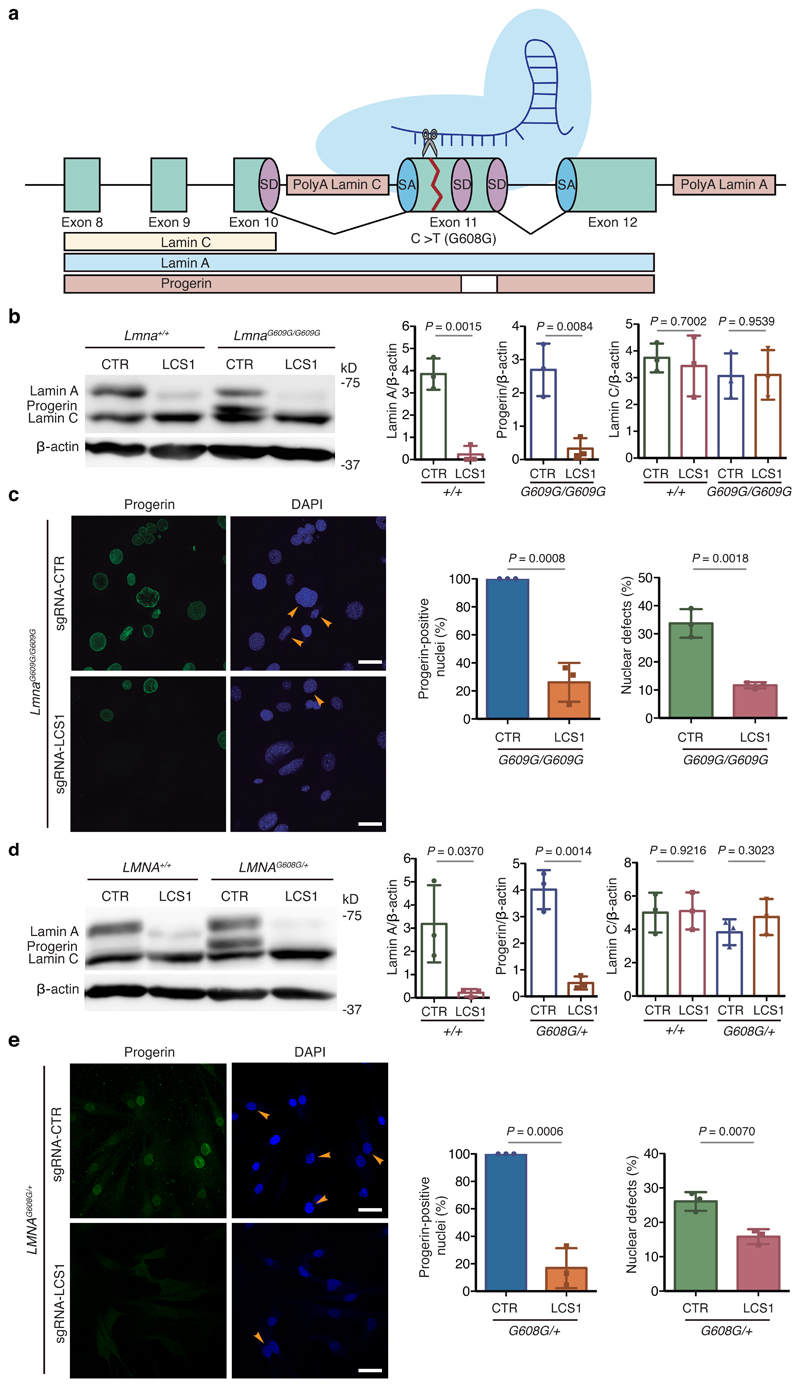
(a) sgRNA-LCS1 directs Cas9 nuclease against exon 11 of LMNA gene upstream of the HGPS mutation, disrupting lamin A and progerin without altering lamin C. (b) Cropped Western blot of lamin A, progerin and lamin C from wild-type and LmnaG609G/G609G mouse embryonic fibroblasts (MEFs) transduced with sgRNA-control or sgRNA-LCS1 (n=3 independent infections and MEF lines; two-tailed Student’s t-test). (c) Immunofluorescence analysis of progerin-positive nuclei and quantification of nuclear alterations by 4′,6-diamidino-2-phenylindole (DAPI) staining (n=3 independent infections and MEF lines; two-tailed Student’s t-test). Arrowheads indicate nuclear aberrations. (d) Cropped Western blot of lamin A, progerin and lamin C from wild-type and LMNAG608G/+ human fibroblasts transduced with sgRNA-control or sgRNA-LCS1 (n=3 independent infections; two-tailed Student’s t-test). (e) Progerin immunofluorescence and analysis of nuclear aberrations by DAPI staining (n=3 independent infections; two-tailed Student’s t-test). Arrowheads indicate blebbings and invaginations. Bar plots represent mean ± SD and individual values are overlaid. Scale bars, 40 μm. Uncropped blots are available as Source Data.
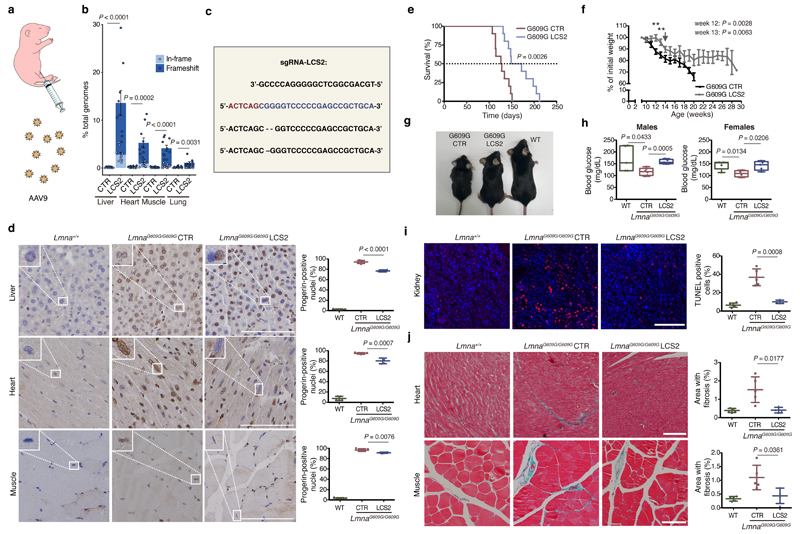
(a) Intraperitoneal injection of AAV9 in P3 mice. (b) Percentage of in-frame and frameshift mutations at the Lmna target region in liver, heart, muscle and lung. Data are mean ± SEM (n=10 tissues per group, except n=9 sgRNA-LCS2-transduced liver; two-tailed Student’s t-test for total indels). (c) Alignment of the most common indels in sgRNA-LCS2-transduced mice. Blue, target sequence; red, PAM sequence. (d) Progerin immunohistochemistry of liver, heart and muscle from wild-type and LmnaG609G/G609G sgRNA-control-transduced or sgRNA-LCS2-transduced mice. Data are mean ± SD (n=5 wild-type and sgRNA-control-transduced mice; n=4 sgRNA-LCS2-transduced mice; two-tailed Student’s t-test). Insets, digital magnification of a selected area. (e) Kaplan-Meier survival plot of sgRNA-control- versus sgRNA-LCS2-transduced LmnaG609G/G609G mice (n=10 mice per group; two-sided Log-rank test). (f) Progression of body weight of mice transduced with sgRNA-control or sgRNA-LCS2, expressed as percentage of weight at 9 weeks. Vertical arrow, time point (3.5 months) at which the cohort destined for histological studies (4-5 mice per group) was sacrificed. Mean values ± SEM are represented (initial n=15 sgRNA-control-transduced mice; n=14 sgRNA-LCS2-transduced mice; two-tailed Student’s t-test). (g) Representative image of LmnaG609G/G609G sgRNA-control-transduced, sgRNA-LCS2-transduced and wild-type female mice at 3.5 months of age. (h) Glycemia in wild-type (males n=5; females n=5), sgRNA-control-transduced (males n=6; females n=4) and sgRNA-LCS2-transduced LmnaG609G/G609G mice (males, n=5; females, n=5). Data are represented by box plots and whiskers are minimum to maximum values (two-tailed Student’s t-test). (i) TUNEL assay in kidney of 3.5-month-old mice. Data are mean ± SD (n=5 wild-type and sgRNA-control-transduced mice; n=4 sgRNA-LCS2-transduced mice; two-tailed Student’s t-test). (j) Gomori staining in 3.5-month-old mouse tissues showing moderate perivascular and interstitial fibrosis in heart and quadriceps muscle of LmnaG609G/G609G mice (blue areas). Data are mean ± SD (n=5 wild-type and sgRNA-control-transduced mice; n=4 sgRNA-LCS2-transduced mice; two-tailed Student’s t-test). Scale bars, 100 μm (d, i, j).
References
Publication types
MeSH terms
Substances
Grants and funding
LinkOut - more resources
Full Text Sources
Other Literature Sources
Medical
Molecular Biology Databases
Miscellaneous
