. 2019 Mar;20(3):337-349.
doi: 10.1038/s41590-018-0311-z. Epub 2019 Feb 18.

The transcription factor c-Myb regulates CD8+ T cell stemness and antitumor immunity

Affiliations

The transcription factor c-Myb regulates CD8+ T cell stemness and antitumor immunity

Sanjivan Gautam et al. Nat Immunol. 2019 Mar.

Abstract

Stem cells are maintained by transcriptional programs that promote self-renewal and repress differentiation. Here, we found that the transcription factor c-Myb was essential for generating and maintaining stem cells in the CD8+ T cell memory compartment. Following viral infection, CD8+ T cells lacking Myb underwent terminal differentiation and generated fewer stem cell-like central memory cells than did Myb-sufficient T cells. c-Myb acted both as a transcriptional activator of Tcf7 (which encodes the transcription factor Tcf1) to enhance memory development and as a repressor of Zeb2 (which encodes the transcription factor Zeb2) to hinder effector differentiation. Domain-mutagenesis experiments revealed that the transactivation domain of c-Myb was necessary for restraining differentiation, whereas its negative regulatory domain was critical for cell survival. Myb overexpression enhanced CD8+ T cell memory formation, polyfunctionality and recall responses that promoted curative antitumor immunity after adoptive transfer. These findings identify c-Myb as a pivotal regulator of CD8+ T cell stemness and highlight its therapeutic potential.


Conflict of interest statement

COMPETING FINANCIAL INTERESTS

P.B and B.W.H. are full-time employees of MedImmune and have stock in AstraZeneca. S.G., Y.J. and L.G. have a pending patent on c-Myb technology. Other authors have no competing interests.

Figures
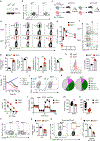
Figure 1.
Figure 1.. c-Myb promotes the formation stem cell-like TCM cells by restraining terminal differentiation.
(a) Immunoblot showing c-Myb in naïve CD8+ T cells from pmel-1 Mybfl/fl Cre- ERT2 mice 5d after i.p. treatment with tamoxifen or vehicle. GAPDH served as control. (b) Flow cytometry of pmel-1 Mybfl/fl and MybΔ/Δ CD8+ T cells after naïve T cell enrichment. (c) Experimental design testing c-Myb impact on pmel-1 CD8+ T cell primary and secondary immune responses. gp100-VV, vaccinia virus encoding human gp100; gp100-adV, adenovirus type 2 encoding human gp-100. (d,e) Flow cytometry of splenic CD8+ T cells (d) and numbers of pmel-1 T cells (e) after transfer of 105 pmel-1 Thy1.1 Mybfl/fl or pmel-1 Thy1.1 MybΔ/Δ CD8+ T cells into wild-type mice infected with gp100-VV, assessed 0–30 d after infection (n = 3 mice per group per time point). (f) Flow cytometry of pmel-1 T cells 5d after transfer as in d,e. (g) Percentages (left) and numbers (right) of CD62L KLRG1+ and CD62L+ KLRG1 pmel-1 T cells 5d after transfer as in d,e. (h) Flow cytometry (left) and geometric Mean Fluorescence Intensity (right) of pmel-1 T cells 5d after transfer as described in d. (i) Cell index (top) and percentage of lysis (bottom) of B16-hgp100 melanoma after co-culture with pmel-1 Myb+/+ or pmel-1 MybΔ/Δ CD8+ T cells (n = 6 technical replicates) (j,k) Intracellular cytokine staining (j) and combinatorial cytokine production (k) by pmel-1 T cells 5d after transfer as in d,e. (l) Oxygen consumption rate (OCR) of pmel-1 Myb+/+ and pmel-1 MybΔ/Δ CD8+ T cells activated in vitro with anti-CD3 and anti-CD28 antibodies in the presence of IL-2. Data are shown under basal condition and in response to the indicated molecules (n = 5 technical replicates). FCCP, Carbonyl cyanide 4-(trifluoromethoxy)phenylhydrazone; Ant, Antimycin; Rot, Rotenone. (m, n) Basal OCR (m) and SRC (n) of pmel-1 T cells generated as in l (n = 15 technical replicates; 5 replicates x 3 time points). SRC, spare respiratory capacity. (o) Flow cytometry of pmel-1 T cells in the lymph nodes 30d after transfer as in d,e. (p) Percentage of KLRG1CD62L+ pmel1 T cells in the lymph nodes 30d after transfer as in d,e. (q,r) Flow cytometry of splenocytes (q) and numbers of splenic pmel-1 T cells (r) 5d after the transfer of 5 × 10⁴ pmel-1 Ly5.2 Mybfl/fl and pmel-1 Ly5.2 MybΔ/Δ primary memory CD8+ T cells followed by secondary infection with gp100-adV (n = 3). Data are representative of at least two independent experiments. Data are shown after gating on live CD8+ (b, d), CD8+ Thy1.1+ cells (f, h, j, o) and CD8+ Ly5.2+ (q). Data in e, g, h, j, i, l, m, n, p and r are shown as mean ± s.e.m.; shapes represent individual mouse (g, h, p and r) or technical replicates (i, m, n). *= P < 0.05, **= P < 0.01, ***= P < 0.001 and ****= P < 0.0001, ns=non-significant (unpaired two-tailed Student’s t-test).
Figure 2.
Figure 2.. c-Myb is indispensable for CD8+ T cell stemness.
(a) Experimental design assessing c-Myb function in long-term memory. (b) Flow cytometry of splenic CD8+ T cells after transfer of 3×10⁵ pmel-1 Thy1.1 Mybfl/fl or pmel-1 Thy1.1 MybΔ/Δ CD8+ T cells into wild-type mice infected with gp100-VV, assessed 90d after infection (n = 3 mice per group). (c) Numbers of total (left) and CD62L+ KLRG1 (right) pmel-1 T cells after transfer as in b. (d) Experimental design testing c-Myb impact on secondary memory. Middle, flow cytometry exemplifying Thy1.1+ T cell frequencies 45d after transfer as in b. (e, f) Flow cytometry of splenocytes (e) and numbers of splenic pmel-1 Thy1.1 CD8+ T cells (f) after transfer of 5 ×10⁴ primary memory pmel-1 Thy1.1 Mybfl/fl or pmel-1 Thy1.1 MybΔ/Δ CD8+ T cells, assessed 30d after gp100-adV infection (n = 3 mice per group). (g) Flow cytometry of splenic pmel-1 T cells 30d after transfer as in e,f. (h) Numbers of splenic CD62L+ KLRG1 pmel1 T cells obtained as in g. (i) Experimental design evaluating self-renewal of stem cell–like TCM cells. Middle, flow cytometry exemplifying the sorting strategy for isolation of CD62L+ pmel-1 memory T cells from spleens and lymph nodes 45d after transfer of 106 pmel-1 Thy1.1 Mybfl/fl or pmel-1 Thy1.1 MybΔ/Δ CD8+ T cells into wild-type mice infected with gp100-VV. (j) Flow cytometry of pmel-1 Thy1.1 CD8+ T cells 28d after transfer of 105 CFSE-labeled CD62L+ pmel-1 Thy1.1 Mybfl/fl or pmel-1 Thy1.1 MybΔ/Δ CD8+ T cells into sub-lethally irradiated mice (n =2 mice per group, data shown after concatenating). Data are shown after gating on live (e) live, CD8+ (b, d) and live, CD8+ Thy1.1+ cells (g, j). Data in c, f, h are shown as mean ± s.e.m.; shapes represent individual mice (c, f, h). *= P < 0.05, **= P < 0.01 and ***= P < 0.001 (unpaired two-tailed Student’s t-test).
Figure 3.
Figure 3.. c-Myb enhances CD8+ T cell stemness by regulating Tcf7, Bcl2, and Zeb2 expression
(a) Volcano plot showing changes in gene expression between pmel-1 Myb+/+ and pmel-1 MybΔ/Δ T cells. Gene expression was evaluated by RNA-seq of pmel-1 KLRG1CD62L T cells isolated 5 days after transfer of 3 X 10⁵ pmel-1 Thy1.1 Myb+/+ and pmel-1 Thy1.1 MybΔ/Δ CD8+ T cells into wild-type mice infected with gp100-VV (n = 3, each from 2 pooled mice per group). Triangles and squares represent genes enriched in central memory (TCM) and terminal effector (TTE ) T cells, respectively. Red and blue represent genes activated and repressed by c-Myb in promyelocytes, respectively . (b) Gene Set Enrichment Assay showing positive enrichment of genes upregulated in cells lacking Wnt signaling (left) and in Zeb2-sufficient cells (panel) in pmel-1 MybΔ/Δ T cells obtained as in a. (ce). Quantitative RT-PCR of Bcl2 (c), Tcf7 (d) and Zeb2 (e) mRNA in comparison to Myb in naïve, CD62L+ and CD62L pmel-1 T cells sorted 5d after transfer of 105 pmel-1 Myb+/+ CD8+ T cells as in a. Results are relative to Rpl13 (Bcl2, Tcf7 and Zeb2) or Actb (Myb) (n = 3 technical replicates). (fh) Quantitative RT-PCR of Bcl2 (f), Tcf7 (g) and Zeb2 (h) mRNA in pmel-1 CD62L+ T cells sorted 5d after transfer of 105 pmel-1 Thy1.1 Myb+/+, pmel-1 Thy1.1 MybΔ/Δ, pmel-1 Thy1.2+ engineered with Myb-Thy1.1 or Thy1.1 as in a. Results are relative to Rpl13 (n = 3 technical replicates). (i,j) Flow cytometry of pmel-1 T cells 5d after transfer of 105 pmel-1 Thy1.1 Myb+/+, pmel-1 Thy1.1 MybΔ/Δ as in a. Numbers indicate geometric Mean Fluorescence Intensity ± s.e.m. (n = 3 mice per group) (k) ChIP-qPCR of in vitro activated pmel-1 Myb+/+ or pmel-1 MybΔ/Δ CD8+ T cells. Chromatin was precipitated with anti-c-Myb or anti-IgG antibodies and amplified with primers specific to Tcf7 enhancer and Zeb2 promoter regions (n = 3 technical replicates). l, n Flow cytometry of splenic pmel-1 T cells (l) and CD8+ T cells (n) after transfer of 105 pmel-1 Mybfl/fl, pmel-1 MybΔ/Δ or pmel-1 MybΔ/Δ Zeb2+/Δ CD8+ T cells transduced with pMI-GFP or pMI-GFP-Tcf7 10 d after transfer into wild-type mice infected with gp100-VV. m, o Percentage of KLRG1+CD62LGFP+CD8+ T cells (m) and CD8+ GFP+ T cells (o) 10 d after transfer as in l. Data are representative of two independent experiments. Data are shown after gating on live CD8+ Thy1.1+ cells (i, j), live CD8+ GFP+ cells (l) or live CD8+ cells (n). Data in ch, k,m,o are mean ± s.e.m.; each symbol represents an individual mouse (m, o) or technical replicate (ch, k). m, merged data from two independent experiments. *P < 0.05, **P < 0.01, ***P <  0.001 and ****P < 0.0001 (unpaired two-tailed Student’s t-test).
Figure 4.
Figure 4.. Distinct functions of c-Myb domains in the regulation of CD8+ T cell differentiation and survival.
(a) Truncated and mutated versions of c-Myb employed for complementation studies. (b) Flow cytometry of splenic pmel-1 Thy1.1 CD8+ T cells 5d after transfer of 105 pmel-1 MybΔ/Δ CD8+ T cells, transduced with MSGV-Thy1.1 encoding wild-type or mutated c-Myb forms, into Ly5.1 mice infected with gp100-VV. pmel-1 Myb+/+ and pmel-1 MybΔ/Δ CD8+ T cells transduced with Thy1.1 served as control (n = 3 mice per group). (c) Percentage of KLRG1+ CD62L pmel-1 T cells 5d after transfer as in b. Quantitative RT-PCR of Tcf7 (d) and Zeb2 (e) mRNA in pmel-1 T cells sorted 5d after transfer as in b. Results are relative to Rpl13 (n = 3 technical replicates). (f) Flow cytometry of CD8+ T cells 5d after transfer as described in b. (g) Percentage of splenic CD8+ Thy1.1+ T cells 5d after transfer as described in b. Data are representative of at least two independent experiments. Data are shown after gating on live CD8+ Thy1.1+ cells (b), and live CD8+ cells (f). Data in ce, and g are shown as the mean ± s.e.m.; shapes represent individual mice (c and g) or technical replicates (d,e). **= P < 0.01, ***= P < 0.001 and ****= P < 0.0001; ns, non-significant (unpaired two-tailed Student’s t-test).
Figure 5.
Figure 5.. Myb overexpression enhances CD8+ T cell memory and polyfunctionality.
(a) Experimental design evaluating the impact of Myb overexpression in CD8+ T cell memory formation. Left, immunoblot of c-Myb in Thy1.1 and Myb-Thy1.1 overexpressing cells. Right, flow cytometry of the 1:1 mixture of Thy1.1 and Myb-Thy1.1 CD8+ T cells before transfer into mice. gp100-VV, vaccinia virus encoding human gp100 (b,c) Flow cytometry of splenic CD8+ T cells (b) and numbers of pmel-1 T cells (c) after co-transfer of 5 × 10⁴ pmel-1-Thy1.1 and 5 × 10⁴ pmel-1 Ly5.1 Myb-Thy1.1 CD8+ T cells into wild-type mice infected with gp100-VV. Assessed 0–32d after transfer (n = 3 mice per group per time point). (d) Flow cytometry analysis of splenic pmel-1 T cells after transfer as in b,c. (e) Percentage of KLRG1CD62L+ (upper panel) and KLRG1+ CD62L (lower panel) splenic pmel-1 T cells after transfer as in b,c. (f) Percentage of cytokine producing pmel-1 T cells after transfer as described in b,c. (g, h) Intracellular cytokine staining (g) and combinatorial cytokine production (h) by splenic pmel-1 T cells 5d after transfer as in b,c. Data are representative of two independent experiments. Data are shown after gating on live CD8+ cells (b), and live CD8+ Thy1.1+ (d, g). Data in c, e, and f are shown as the mean ± s.e.m.; shapes represent individual mice. *= P < 0.05, **= P < 0.01, ***= P < 0.001 and ****= P < 0.0001 (unpaired two-tailed Student’s t-test).
Figure 6.
Figure 6.. Myb overexpression enhances CD8+ T recall responses.
(a) Experimental design testing the impact of Myb overexpression on CD8+ T cell secondary responses. gp100-VV, vaccinia virus encoding human gp100; gp100-adV, adenovirus type 2 encoding gp-100. (b, c) Flow cytometry of splenic CD8+ T cells (b) and numbers of pmel-1 CD8+ T cells (c) after co-transfer of 5 × 10⁴ pmel-1-Thy1.1 and 5 × 10⁴ pmel-1 Ly5.1 Myb-Thy1.1 CD8+ T cells into wild-type mice infected with gp100-VV, assessed 5d after secondary infection with gp100-adV (n = 3 mice per group). (df) Flow cytometry of pmel-1 T cells in the spleen (d), lungs (e) and lymph nodes (f) 5d after secondary infection as in b,c. (gi) Percentage of KLRG1CD62L+ and KLRG1+ CD62L pmel-1 T cells in the spleen (g), lungs (h) and lymph nodes (i) 5d after secondary infection as in b,c. (j) Percentage of cytokine+ splenic pmel-1 T cells 5d after secondary infection as in b,c. (k, l) Intracellular cytokine staining (k) and combinatorial cytokine production (l) by splenic pmel-1 T cells 5d after secondary infection as in b,c. Data are representative of two independent experiments. Data are shown after gating on live CD8+ cells (b), and live CD8+ Thy1.1+ (df, k). Data in c, and gj, are shown as the mean ± s.e.m.; shapes represent individual mice. *= P < 0.05, **= P < 0.01; ns, non-significant (unpaired two-tailed Student’s t-test).
Figure 7.
Figure 7.. Enforced expression of Myb enhances CD8+ T cell antitumor immunity.
(a) Fold expansion of pmel-1 CD8+ T cells transduced with Thy1.1 or Myb-Thy1.1 cells after priming with anti-CD3 anti-CD28 antibodies and re-stimulation with the same antibodies 5d later. Cells were grown in the presence of IL-2 throughout the culture (n = 3 independent experiments). (b, c) Flow cytometry of pmel-1 T cells transduced with Thy1.1 or Myb-Thy1.1 generated as described in a. (d) geometric Mean Fluorescence Intensity (gMFI) of mitotracker staining in pmel-1 T cells generated as in a. (n = 3 technical replicates) (e) Oxygen consumption rate (OCR) of pmel-1 T cells generated as in a., assessed on 10d. Data are shown under basal culture conditions and in response to the indicated molecules (n = 12 technical replicates). FCCP, Carbonyl cyanide 4-(trifluoromethoxy)phenylhydrazone; Ant, Antimycin; Eto, Etomoxir; Rot, Rotenone. (e,f) Spare respiratory capacity (SRC) (g) and reduction of OCR after Eto administration in pmel-1 T cells generated as in a., assessed on 10d (n = 36 technical replicates; 12 replicates x 3 time points) (i) Tumor curve (left panel) and survival (right panel) of wild-type mice bearing subcutaneous hgp100+ B16 melanoma cells after transfer of 5 X 10⁶ pmel-1 T cells generated as in a in conjunction with gp100-VV and IL-2 (n = 5 mice per group). Solid and dashed red curve denotes tumor challenged mice that received no T cell transfer. On 206d post-T cell transfer, mice were re-challenged with 2.5 × 10⁵ hgp100+ B16 melanoma. Data are representative of two independent experiments. Tumor re-challenge after 200d was performed in an individual experiment. Data are shown after gating on live CD8+ cells (b, c) Data in a, dg are shown as the mean ± s.e.m.; each tumor curve represents an individual mouse *= P < 0.05, ***= P < 0.001 (a, unpaired two-tailed Student’s t-test; h, a Log-rank (Mantel-Cox) Test).

References

    1. Simons BD & Clevers H Strategies for homeostatic stem cell self-renewal in adult tissues. Cell 145, 851–862 (2011). - PubMed
    1. Graef P et al. Serial transfer of single-cell-derived immunocompetence reveals stemness of CD8(+) central memory T cells. Immunity 41, 116–126 (2014). - PubMed
    1. Gattinoni L Memory T cells officially join the stem cell club. Immunity 41, 7–9 (2014). - PMC - PubMed
    1. Gattinoni L, Speiser DE, Lichterfeld M & Bonini C T memory stem cells in health and disease. Nature medicine 23, 18–27 (2017). - PMC - PubMed
    1. Gattinoni L, Klebanoff CA & Restifo NP Paths to stemness: building the ultimate antitumour T cell. Nature reviews. Cancer 12, 671–684 (2012). - PMC - PubMed

METHODS-ONLY REFERENCES

    1. Yang Q et al. TCF-1 upregulation identifies early innate lymphoid progenitors in the bone marrow. Nature immunology 16, 1044–1050 (2015). - PMC - PubMed
    1. Eil R et al. Ionic immune suppression within the tumour microenvironment limits T cell effector function. Nature 537, 539–543 (2016). - PMC - PubMed
    1. Kim D et al. TopHat2: accurate alignment of transcriptomes in the presence of insertions, deletions and gene fusions. Genome Biol 14, R36 (2013). - PMC - PubMed
    1. Love MI, Huber W & Anders S Moderated estimation of fold change and dispersion for RNA-seq data with DESeq2. Genome Biol 15, 550 (2014). - PMC - PubMed
    1. Gu Z, Eils R & Schlesner M Complex heatmaps reveal patterns and correlations in multidimensional genomic data. Bioinformatics 32, 2847–2849 (2016). - PubMed

Publication types

MeSH terms

Substances