. 2019 Apr;10(4):249-271.
doi: 10.1007/s13238-019-0608-1. Epub 2019 Feb 18.

Modeling CADASIL vascular pathologies with patient-derived induced pluripotent stem cells

Affiliations

Modeling CADASIL vascular pathologies with patient-derived induced pluripotent stem cells

Chen Ling et al. Protein Cell. 2019 Apr.

Erratum in

Abstract

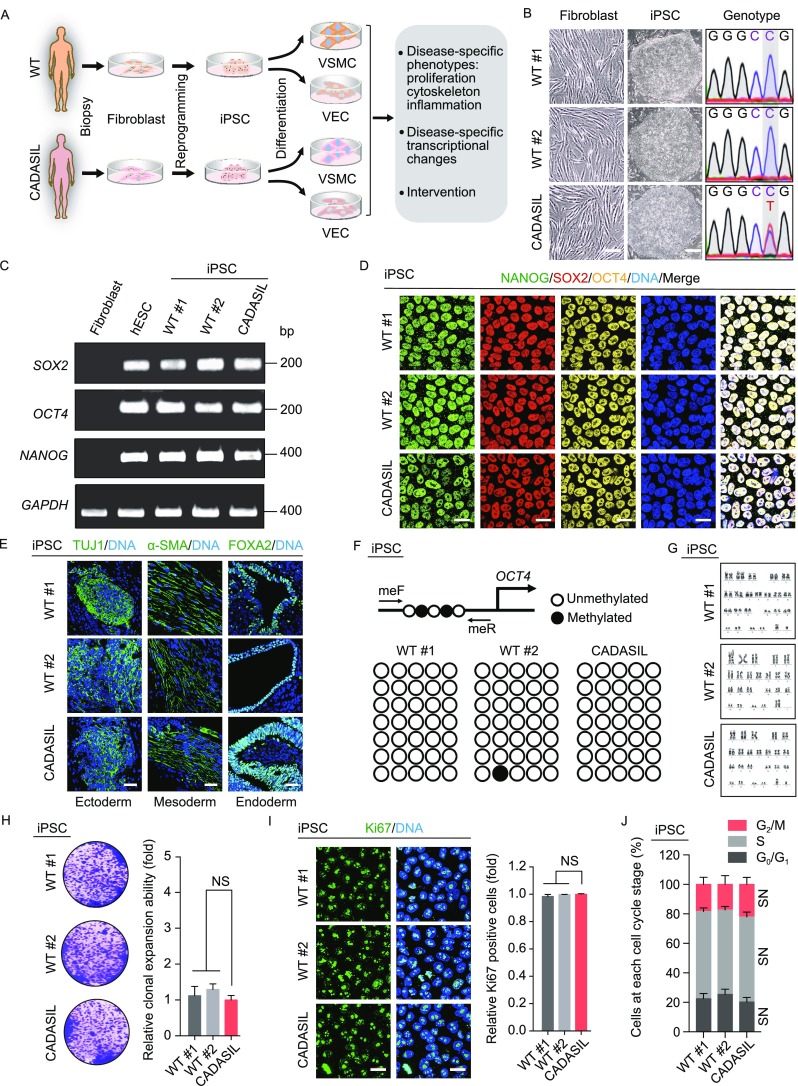
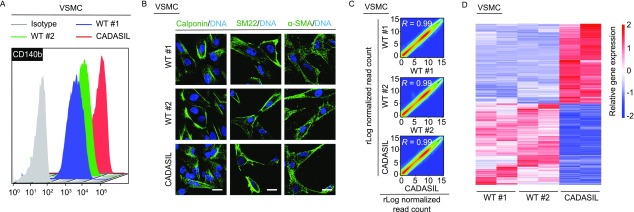
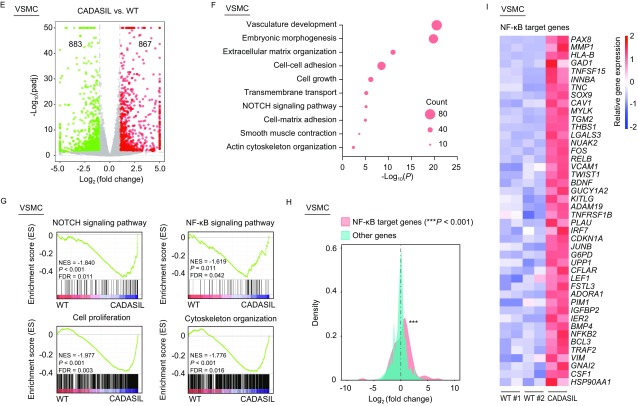
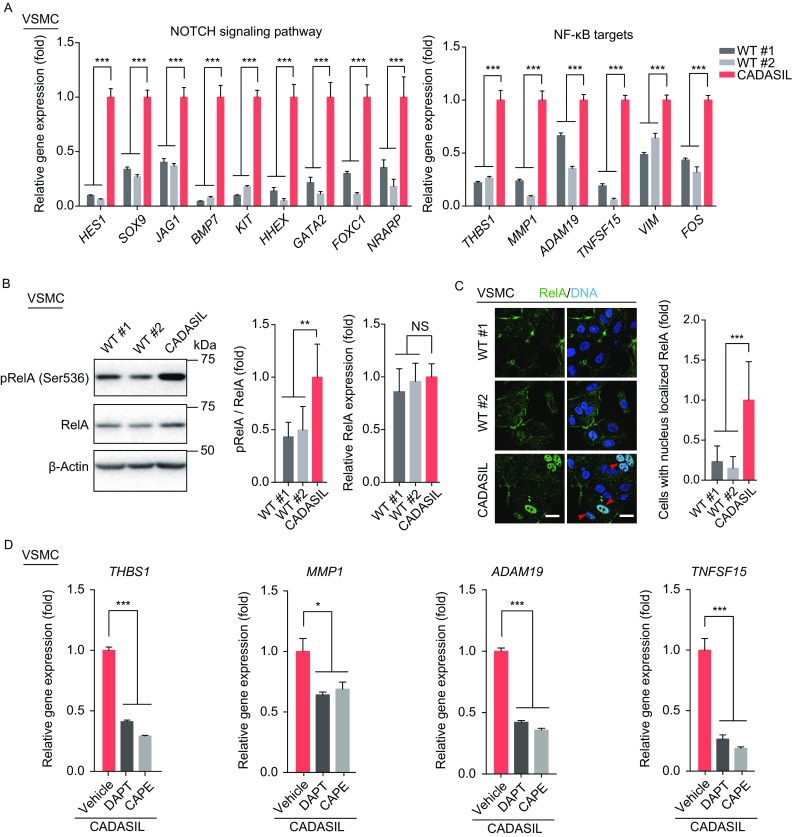
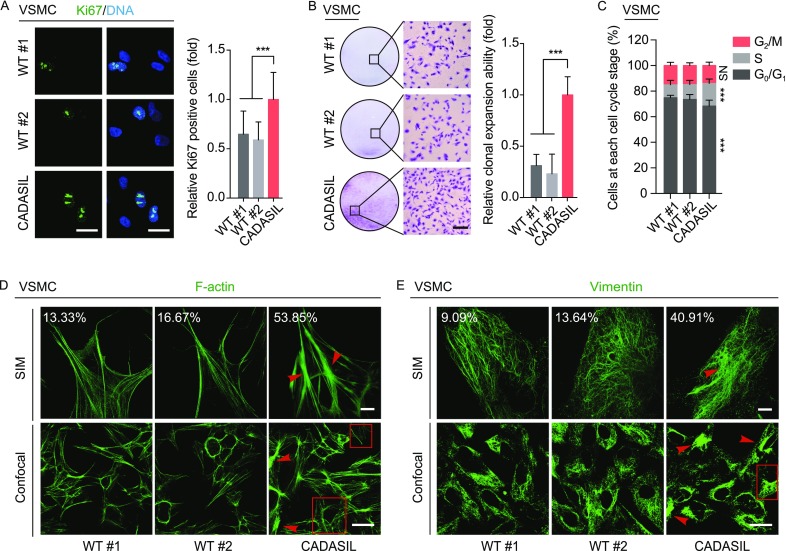
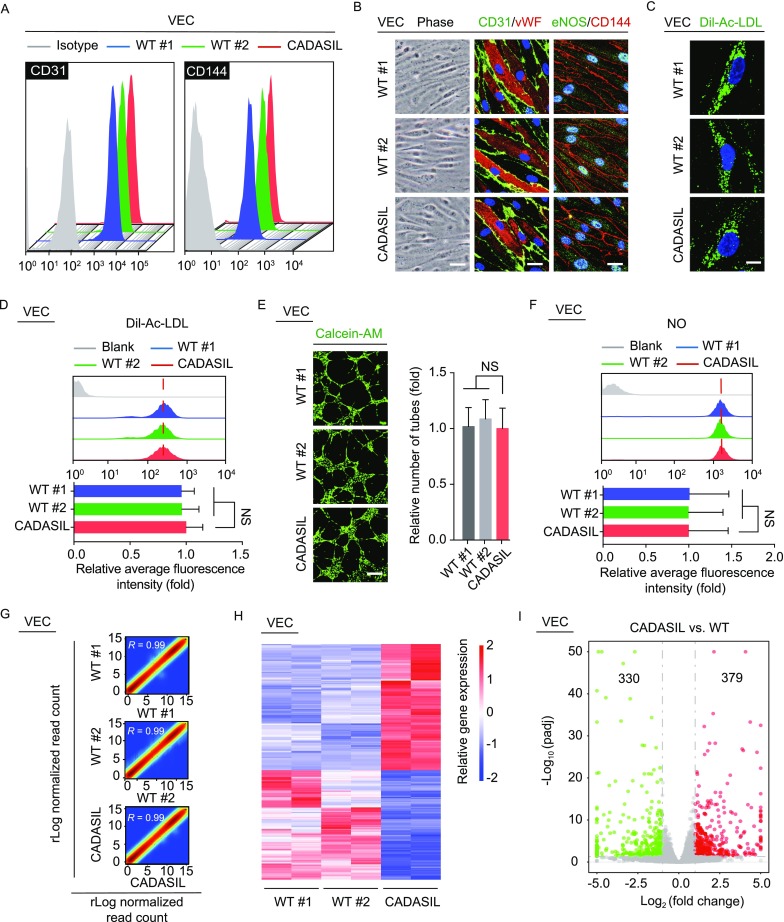
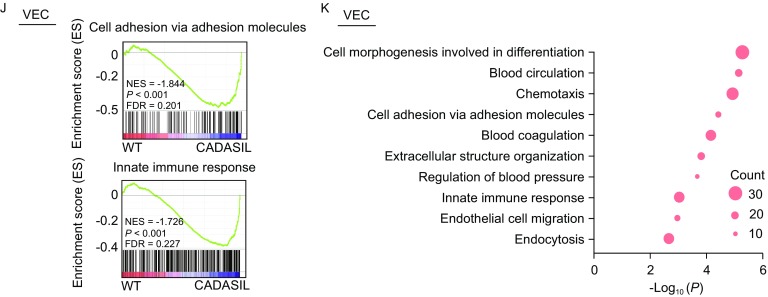
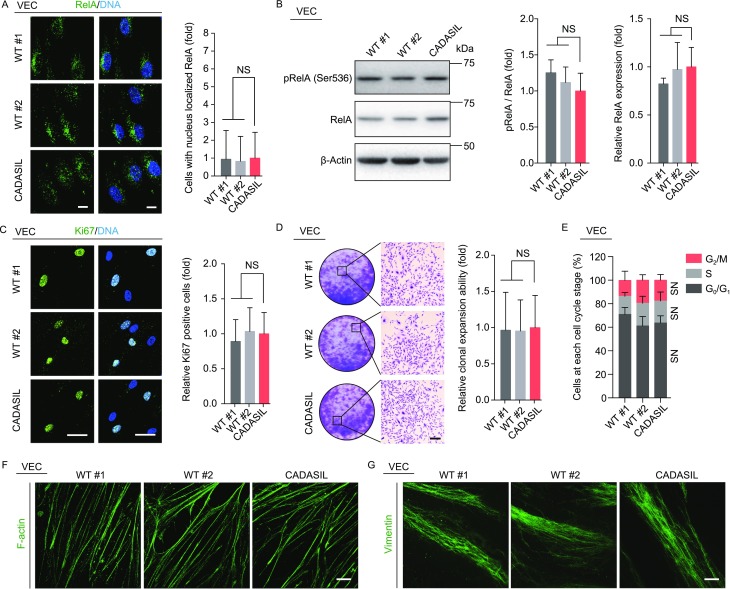
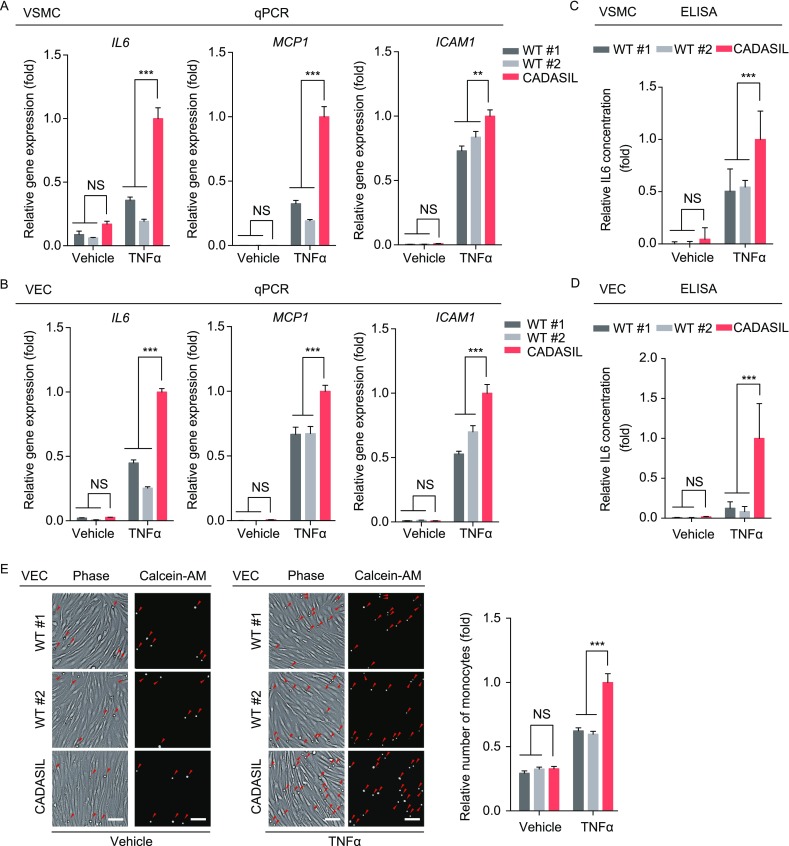
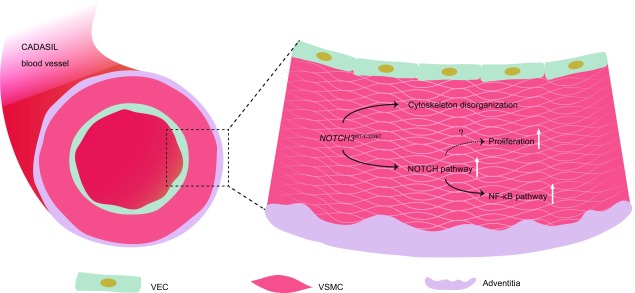
Cerebral autosomal dominant arteriopathy with subcortical infarcts and leukoencephalopathy (CADASIL) is a rare hereditary cerebrovascular disease caused by a NOTCH3 mutation. However, the underlying cellular and molecular mechanisms remain unidentified. Here, we generated non-integrative induced pluripotent stem cells (iPSCs) from fibroblasts of a CADASIL patient harboring a heterozygous NOTCH3 mutation (c.3226C>T, p.R1076C). Vascular smooth muscle cells (VSMCs) differentiated from CADASIL-specific iPSCs showed gene expression changes associated with disease phenotypes, including activation of the NOTCH and NF-κB signaling pathway, cytoskeleton disorganization, and excessive cell proliferation. In comparison, these abnormalities were not observed in vascular endothelial cells (VECs) derived from the patient's iPSCs. Importantly, the abnormal upregulation of NF-κB target genes in CADASIL VSMCs was diminished by a NOTCH pathway inhibitor, providing a potential therapeutic strategy for CADASIL. Overall, using this iPSC-based disease model, our study identified clues for studying the pathogenic mechanisms of CADASIL and developing treatment strategies for this disease.

Keywords: CADASIL; NF-κB; NOTCH; iPSC; vascular smooth muscle.


Figures

Figure 1
Figure 1
Generation and characterization of WT iPSCs and CADASIL iPSCs. (A) Schematic procedures for establishing iPSC-based CADASIL disease model. Fibroblasts obtained from one CADASIL patient and two healthy controls were reprogrammed into iPSCs. The iPSCs were then differentiated to generate VSMCs and VECs. Changes in disease-associated transcriptional profiling and cellular phenotypes were analyzed. (B) Confirmation of the heterozygous mutation of NOTCH3 (c.3226C>T, p.R1076C) in CADASIL iPSCs by DNA sequencing (right). Phase-contrast images of fibroblasts (left) and fibroblast-derived iPSCs (middle). Scale bar of fibroblasts, 50 μm; Scale bar of iPSCs, 100 μm. (C) RT-PCR of pluripotency markers, SOX2, OCT4, and NANOG. Human ESCs (hESCs) were used as positive controls and human fibroblasts as negative controls. (D) Immunofluorescence staining of pluripotency markers, NANOG, SOX2, and OCT4. Nuclei were stained with Hoechst 33342. Scale bar, 25 μm. (E) Immunofluorescence staining of TUJ1 (ectoderm), α-SMA (mesoderm), and FOXA2 (endoderm) in teratomas derived from WT and CADASIL iPSCs. Nuclei were stained with Hoechst 33342. Scale bar, 50 μm. (F) DNA methylation analysis of the OCT4 promoter in WT and CADASIL iPSCs. Open and closed circles indicate unmethylated and methylated CpG dinucleotides, respectively (n = 7). (G) Karyotyping analysis of WT and CADASIL iPSCs. (H) Clonal expansion analysis of WT and CADASIL iPSCs. Representative images of crystal violet staining are shown to the left. The statistical analyses of relative clonal expansion abilities are shown to the right (CADASIL was taken as reference). Data are presented as mean ± SD, n = 3. NS, not significant. (I) Immunofluorescence staining of Ki67 in WT and CADASIL iPSCs. Nuclei were stained with Hoechst 33342. Scale bar, 25 μm. The relative percentages of Ki67-positive cells are shown to the right (CADASIL was taken as reference). Data are presented as mean ± SD, n = 3. NS, not significant. (J) Cell cycle analysis of WT and CADASIL iPSCs. Data are presented as mean ± SD, n = 3. NS, not significant
Figure 2
Figure 2
Transcriptional profiling changes in CADASIL VSMCs. (A) Flow cytometry analysis of VSMC-specific marker CD140b in WT and CADASIL VSMCs. (B) Immunofluorescence staining of VSMC-specific markers, Calponin, SM22 and α-SMA. Nuclei were stained with Hoechst 33342. Scale bar, 25 μm. (C) Scatter plots showing the correlation between replicates of WT and CADASIL VSMCs. (D) Heatmap illustrating differentially expressed genes in WT and CADASIL VSMCs. (E) Volcano plot showing the number of upregulated (red dot) and downregulated (green dot) genes in CADASIL VSMCs. (F) GO enrichment analysis of upregulated genes in CADASIL VSMCs. (G) Gene set enrichment analysis (GSEA) plots showing representative GO-BP terms enriched in CADASIL VSMCs. (H) Density plot showing Log2(fold change) of mRNA expression levels between WT and CADASIL VSMCs for NF-κB target genes. A rightward shift (***P < 0.001) indicates increased frequency of genes upregulated in CADASIL VSMCs. (I) Heatmap showing upregulated NF-κB target genes in CADASIL VSMCs
Figure 2
Figure 2
Transcriptional profiling changes in CADASIL VSMCs. (A) Flow cytometry analysis of VSMC-specific marker CD140b in WT and CADASIL VSMCs. (B) Immunofluorescence staining of VSMC-specific markers, Calponin, SM22 and α-SMA. Nuclei were stained with Hoechst 33342. Scale bar, 25 μm. (C) Scatter plots showing the correlation between replicates of WT and CADASIL VSMCs. (D) Heatmap illustrating differentially expressed genes in WT and CADASIL VSMCs. (E) Volcano plot showing the number of upregulated (red dot) and downregulated (green dot) genes in CADASIL VSMCs. (F) GO enrichment analysis of upregulated genes in CADASIL VSMCs. (G) Gene set enrichment analysis (GSEA) plots showing representative GO-BP terms enriched in CADASIL VSMCs. (H) Density plot showing Log2(fold change) of mRNA expression levels between WT and CADASIL VSMCs for NF-κB target genes. A rightward shift (***P < 0.001) indicates increased frequency of genes upregulated in CADASIL VSMCs. (I) Heatmap showing upregulated NF-κB target genes in CADASIL VSMCs
Figure 3
Figure 3
Activation of NF-κB in CADASIL VSMCs was related to NOTCH pathway upregulation. (A) Verification of upregulated NOTCH pathway genes and NF-κB target genes in CADASIL VSMCs by RT-qPCR. CADASIL was taken as reference. Data are presented as mean ± SEM, n = 4. ***P < 0.001. (B) Western blot analysis of NF-κB P65 (RelA) and phosphorylated RelA (Ser536) expression levels in WT and CADASIL VSMCs. β-Actin was used as the loading control. Data are presented as mean ± SD, n = 5. NS, not significant. **P < 0.01. (C) Immunofluorescence staining of NF-κB P65 (RelA) in WT and CADASIL VSMCs. Nuclei were stained with Hoechst 33342. Scale bar, 25 μm. The relative percentages of cells with nucleus localized RelA are shown to the right (CADASIL was taken as reference). Data are presented as mean ± SD, n = 3. ***P < 0.001. (D) RT-qPCR analysis of NF-κB target genes in CADASIL VSMCs. CADASIL VSMCs were treated with 20 μmol/L DAPT (GSI-IX) (Selleck, S2215) and 50 μmol/L Caffeic Acid Phenethyl Ester (CAPE) (Selleck, S7414) for 18 hours respectively. Vehicle was taken as reference. Data are presented as mean ± SEM, n = 4. *P < 0.05, ***P < 0.001
Figure 4
Figure 4
CADASIL VSMCs exhibited hyperproliferation and abnormal cytoskeleton structure. (A) Immunofluorescence staining of Ki67 in WT and CADASIL VSMCs. Nuclei were stained with Hoechst 33342. Scale bar, 25 μm. The relative percentages of Ki67-positive cells (CADASIL was taken as reference) are shown to the right. Data are presented as mean ± SD, n = 8. ***P < 0.001. (B) Clonal expansion analysis of WT and CADASIL VSMCs. Representative images of crystal violet staining are shown to the left, Scale bar, 100 μm. The statistical analyses of relative clonal expansion abilities are shown to the right (CADASIL was taken as reference). Data are shown as mean ± SD, n = 3. ***P < 0.001. (C) Cell cycle analysis of WT and CADASIL VSMCs. Data are shown as mean ± SD, n = 3. ***P < 0.001; NS, not significant. (D) 3D-SIM (top) and confocal microscope images (bottom) of F-actin showing increased aggregation of parallel microfilaments and scattered nodes (arrow heads) in CADASIL VSMCs. Inside the red rectangle is a substantially normal cell. Scale bar of 3D-SIM images, 5 μm. Scale bar of confocal microscope images, 50 μm. The percentages of cells with abnormal F-actin in SIM images are shown. (E) 3D-SIM (top) and confocal microscope images (bottom) showing increased percentage of cells with aggregated vimentin (arrow heads) in CADASIL VSMCs. Inside the red rectangle is a substantially normal cell. Scale bar of 3D-SIM images, 5 μm. Scale bar of confocal microscope images, 25 μm. The percentages of cells with abnormal vimentin in SIM images are shown
Figure 5
Figure 5
Transcriptional profiling of CADASIL VECs. (A) Flow cytometry analysis of VEC-specific markers CD31 and CD144 in WT and CADASIL VECs. (B) Phase-contrast images of VECs are shown to the left. Scale bar, 50 μm. Immunofluorescence staining of VEC-specific markers, CD31, vWF, CD144 and eNOS, are shown to the right. Nuclei were stained with Hoechst 33342. Scale bar, 25 μm. (C) Immunofluorescence staining of Dil-Ac-LDL in WT and CADASIL VECs. Nuclei were stained with Hoechst 33342. Scale bar, 10 μm. (D) Flow cytometry analysis of Dil-Ac-LDL uptake abilities in WT and CADASIL VECs. The relative average fluorescence intensities are shown in the bottom (CADASIL was taken as reference). Data are presented as mean ± SD, n = 3. NS, not significant. (E) The abilities of in vitro tube formation in WT and CADASIL VECs. Scale bar, 100 μm. The relative numbers of tubes are shown to the right (CADASIL was taken as reference). Data are presented as mean ± SD, n = 3. NS, not significant. (F) Flow cytometry analysis of nitric oxide (NO) levels in WT and CADASIL VECs. The relative average fluorescence intensities are shown in the bottom (CADASIL was taken as reference). Data are presented as mean ± SD, n = 3. NS, not significant. (G) Scatter plots showing the correlation between replicates of WT and CADASIL VECs. (H) Heatmap illustrating differentially expressed genes in WT and CADASIL VECs. (I) Volcano plot showing the number of upregulated (red dot) and downregulated (green dot) genes in CADASIL VECs. (J) Gene set enrichment analysis (GSEA) plots showing representative GO-BP terms enriched in CADASIL VECs. (K) GO enrichment analysis of upregulated genes in CADASIL VECs
Figure 5
Figure 5
Transcriptional profiling of CADASIL VECs. (A) Flow cytometry analysis of VEC-specific markers CD31 and CD144 in WT and CADASIL VECs. (B) Phase-contrast images of VECs are shown to the left. Scale bar, 50 μm. Immunofluorescence staining of VEC-specific markers, CD31, vWF, CD144 and eNOS, are shown to the right. Nuclei were stained with Hoechst 33342. Scale bar, 25 μm. (C) Immunofluorescence staining of Dil-Ac-LDL in WT and CADASIL VECs. Nuclei were stained with Hoechst 33342. Scale bar, 10 μm. (D) Flow cytometry analysis of Dil-Ac-LDL uptake abilities in WT and CADASIL VECs. The relative average fluorescence intensities are shown in the bottom (CADASIL was taken as reference). Data are presented as mean ± SD, n = 3. NS, not significant. (E) The abilities of in vitro tube formation in WT and CADASIL VECs. Scale bar, 100 μm. The relative numbers of tubes are shown to the right (CADASIL was taken as reference). Data are presented as mean ± SD, n = 3. NS, not significant. (F) Flow cytometry analysis of nitric oxide (NO) levels in WT and CADASIL VECs. The relative average fluorescence intensities are shown in the bottom (CADASIL was taken as reference). Data are presented as mean ± SD, n = 3. NS, not significant. (G) Scatter plots showing the correlation between replicates of WT and CADASIL VECs. (H) Heatmap illustrating differentially expressed genes in WT and CADASIL VECs. (I) Volcano plot showing the number of upregulated (red dot) and downregulated (green dot) genes in CADASIL VECs. (J) Gene set enrichment analysis (GSEA) plots showing representative GO-BP terms enriched in CADASIL VECs. (K) GO enrichment analysis of upregulated genes in CADASIL VECs
Figure 6
Figure 6
Disease-associated phenotypes observed in CADASIL VSMCs were not detected in CADASIL VECs. (A) Immunofluorescence staining of NF-κB P65 (RelA) in CADASIL VECs. Nuclei were stained with Hoechst 33342. Scale bar, 10 μm. The relative percentages of cells with nucleus localized RelA are shown to the right (CADASIL was taken as reference). Data are presented as mean ± SD, n = 3. NS, not significant. (B) Western blot analysis of NF-κB P65 (RelA) and phosphorylated RelA (Ser536) expression levels in WT and CADASIL VECs. β-Actin was used as the loading control. Data are presented as mean ± SD, n = 4. NS, not significant. (C) Immunofluorescence staining of Ki67 in WT and CADASIL VECs. Nuclei were stained with Hoechst 33342. Scale bar, 25 μm. The relative percentages of Ki67-positive cells are shown to the right (CADASIL was taken as reference). Data are presented as mean ± SD, n = 4. NS, not significant. (D) Clonal expansion analysis of WT and CADASIL VECs. Representative images of crystal violet staining are shown to the left, Scale bar, 100 μm. The statistical analyses of relative clonal expansion abilities are shown to the right (CADASIL was taken as reference). Data are presented as mean ± SD, n = 3. NS, not significant. (E) Cell cycle analysis of WT and CADASIL VECs. Data are presented as mean ± SD, n = 3. NS, not significant. (F) 3D-SIM images of F-actin in WT and CADASIL VECs. Scale bar, 5 μm. (G) 3D-SIM images of vimentin in WT and CADASIL VECs. Scale bar, 5 μm
Figure 7
Figure 7
CADASIL VSMCs and VECs were more sensitive to inflammatory stimuli. (A) RT-qPCR analysis showing the expression levels of NF-κB downstream genes, IL6, MCP1, ICAM1, in WT and CADASIL VSMCs under basal and TNFα-induced inflammatory conditions. CADASIL treated with TNFα was taken as reference. Cells were treated with or without 10 ng/mL TNFα for 12 h. Data are shown as mean ± SEM, n = 4. ***P < 0.001; **P < 0.01; NS, not significant. (B) RT-qPCR analysis showing the expression levels of NF-κB downstream genes, IL6, MCP1, ICAM1, in WT and CADASIL VECs under basal and TNFα-induced inflammatory conditions. CADASIL treated with TNFα was taken as reference. Cells were treated with or without 10 ng/mL TNFα for 12 h. Data are shown as mean ± SEM, n = 4. ***P < 0.001; NS, not significant. (C) ELISA assay showing concentration of IL6 in the culture medium of WT and CADASIL VSMCs under basal and 10 ng/mL TNFα-induced inflammatory conditions. The relative concentration of IL6 is shown (CADASIL treated with TNFα was taken as reference). Data are shown as mean ± SD, n = 3. ***P < 0.001; NS, not significant. (D) ELISA assay showing concentration of IL6 in the culture medium of WT and CADASIL VECs under basal and 10 ng/mL TNFα-induced inflammatory conditions. The relative concentration of IL6 is shown (CADASIL treated with TNFα was taken as reference). Data are shown as mean ± SD, n = 3. ***P < 0.001; NS, not significant. (E) Monocyte adhesion to WT and CADASIL VECs under basal and 10 ng/mL TNFα-induced inflammatory conditions. Red arrow heads indicate monocytes. Scale bar, 50 μm. The relative numbers of adhered monocytes are shown to the right (CADASIL treated with TNFα was taken as reference). Data are shown as mean ± SD, n = 3. ***P < 0.001; NS, not significant
Figure 8
Figure 8
Schematic drawing of the major cellular phenotypes observed in CADASIL VSMCs. The heterozygous NOTCH3 mutation (c.3226C>T) of VSMCs resulted in increased proliferation ability, cytoskeleton disorganization, activation of NOTCH pathway and NF-κB pathway. However, these disease-associated phenotypes found in CADASIL VSMCs were not observed in CADASIL VECs

Similar articles

Cited by

References

    1. Agrinier N, Thilly N, Boivin JM, Dousset B, Alla F, Zannad F. Prognostic value of serum PIIINP, MMP1 and TIMP1 levels in hypertensive patients: a community-based prospective cohort study. Fundam Clin Pharmacol. 2013;27:572–580. - PubMed
    1. Anders S, Pyl PT, Huber W. HTSeq—a python framework to work with high-throughput sequencing data. Bioinformatics. 2015;31:166–169. - PMC - PubMed
    1. Andersen P, Uosaki H, Shenje LT, Kwon C. Non-canonical Notch signaling: emerging role and mechanism. Trends Cell Biol. 2012;22:257–265. - PMC - PubMed
    1. Andersson ER, Lendahl U. Therapeutic modulation of Notch signalling–are we there yet? Nat Rev Drug Discov. 2014;13:357–378. - PubMed
    1. Andersson ER, Sandberg R, Lendahl U. Notch signaling: simplicity in design, versatility in function. Development. 2011;138:3593–3612. - PubMed

Publication types