. 2019 Jun;69(6):2636-2651.
doi: 10.1002/hep.30572. Epub 2019 Apr 10.

Predicting Postoperative Liver Dysfunction Based on Blood-Derived MicroRNA Signatures

Affiliations

Predicting Postoperative Liver Dysfunction Based on Blood-Derived MicroRNA Signatures

Patrick Starlinger et al. Hepatology. 2019 Jun.

Abstract

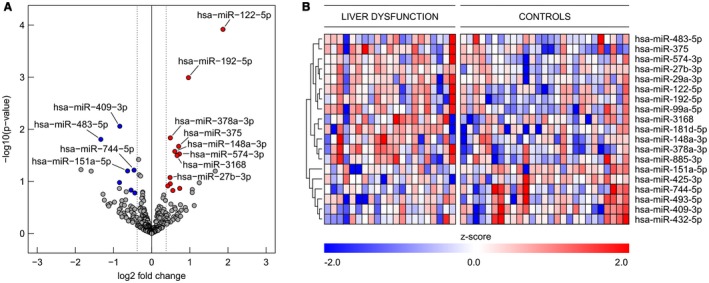
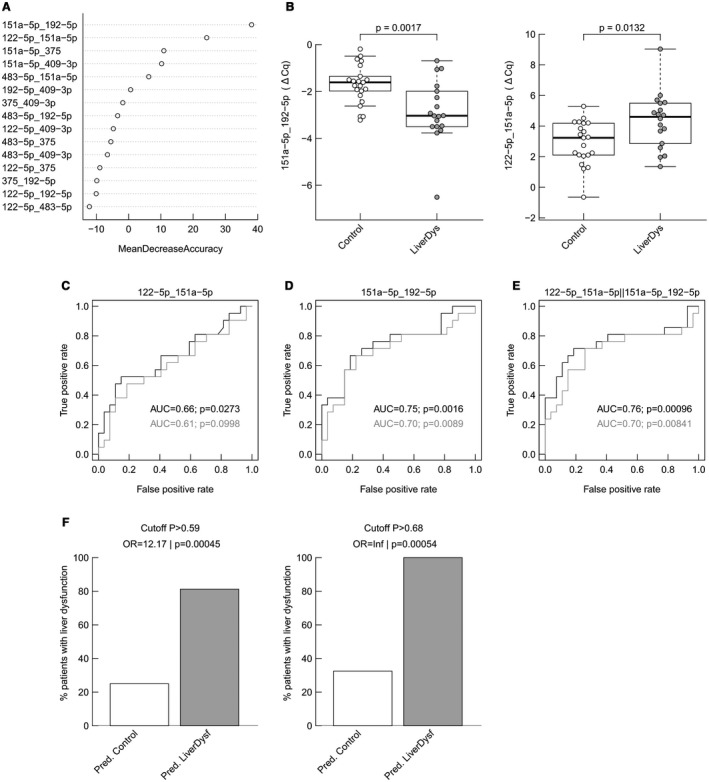
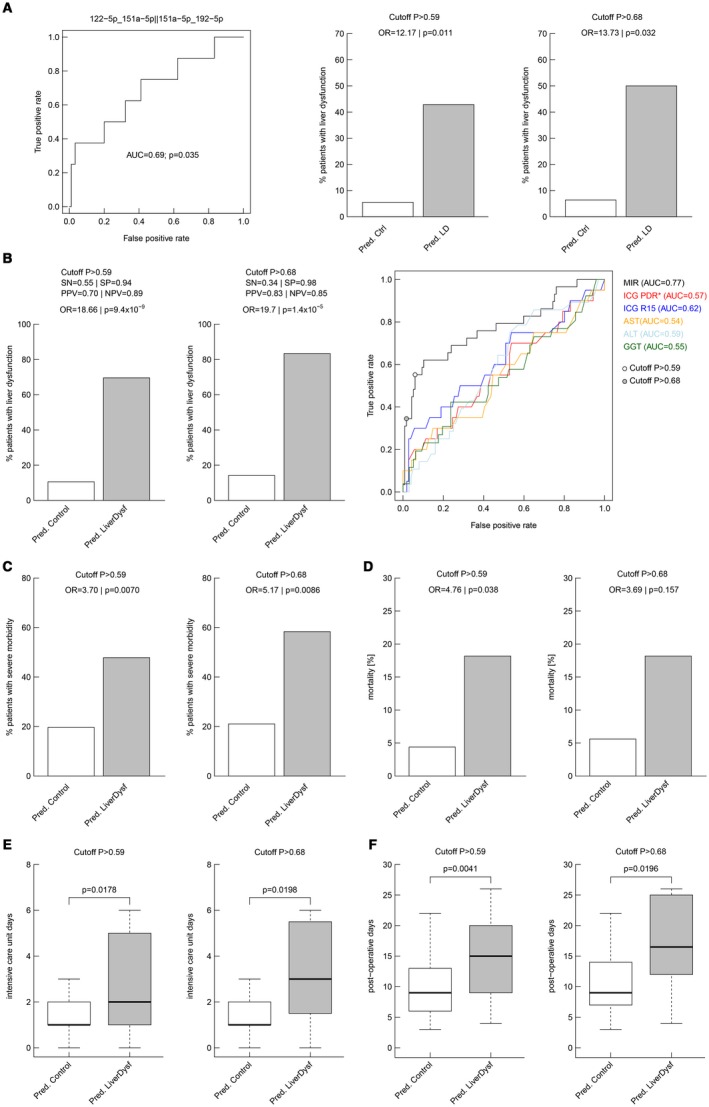
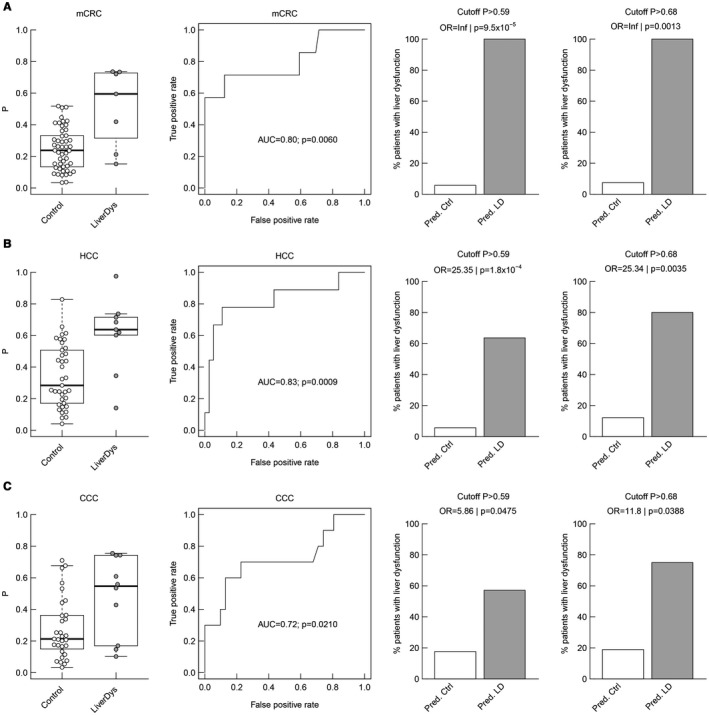
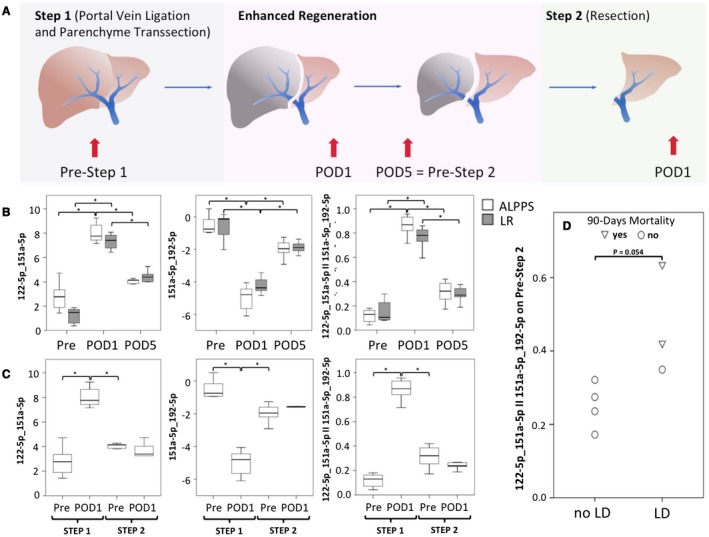
There is an urgent need for an easily assessable preoperative test to predict postoperative liver function recovery and thereby determine the optimal time point of liver resection, specifically as current markers are often expensive, time consuming, and invasive. Emerging evidence suggests that microRNA (miRNA) signatures represent potent diagnostic, prognostic, and treatment-response biomarkers for several diseases. Using next-generation sequencing as an unbiased systematic approach, 554 miRNAs were detected in preoperative plasma of 21 patients suffering from postoperative liver dysfunction (LD) after liver resection and 27 matched controls. Subsequently, we identified a miRNA signature-consisting of miRNAs 151a-5p, 192-5p, and 122-5p-that highly correlated with patients developing postoperative LD after liver resection. The predictive potential for postoperative LD was subsequently confirmed using real-time PCR in an independent validation cohort of 98 patients. Ultimately, a regression model of the two miRNA ratios 151a-5p to 192-5p and 122-5p to 151a-5p was found to reliably predict postoperative LD, severe morbidity, prolonged intensive care unit and hospital stays, and even mortality before an operation with a remarkable accuracy, thereby outperforming established markers of postoperative LD. Ultimately, we documented that miRNA ratios closely followed liver function recovery after partial hepatectomy. Conclusion: Our data demonstrate the clinical utility of an miRNA-based biomarker to support the selection of patients undergoing partial hepatectomy. The dynamical changes during liver function recovery indicate a possible role in individualized patient treatment. Thereby, our data might help to tailor surgical strategies to the specific risk profile of patients.


Figures

Figure 1
Figure 1
Differences in presurgical microRNA patterns in patients undergoing liver resection. (A) Volcano plot of differentially regulated microRNAs in presurgical plasma of patients with LD. To identify biomarker candidates, cutoffs for plasma concentration (average logCPM > 5), effect size (fold change > 1.3), and significance level (raw P < 0.2) were implied. A set of 19 microRNAs, of which 12 were up‐regulated (red) and 7 were down‐regulated (blue), was identified. (B) Expression heat map of regulated miRNAs in plasma of patients (miR‐wise z score of log2 [CPM + 1]); red indicates higher expression than the mean and blue indicates lower expression than the mean, according to the legend at the bottom.
Figure 2
Figure 2
Analysis of the diagnostic performance of miRNA pairs to predict LD. (A) Importance of miRNA pairs in a random forest classification model (the most important ones are at the top with highest mean decrease accuracy). (B) Distribution of ratios measured by qPCR in the discovery cohort for miR151a‐5p/192‐5p (boxplots and P values from two‐sided Wilcoxon rank‐sum test) and for miR122‐5p/151a‐5p. (C) ROC curves for an LR model including miR122‐5p/151a‐5p in the discovery cohort (results from leave‐one‐out cross‐validation are in gray). (D) An LR model including miR151‐5p/192‐5p and (E) an LR model including both miRNA pairs. The performance is described by the AUC, and whether the classification deviates significantly from the random assignment (AUC = 0.5) is indicated by the P value. The percentage of true postoperative LD on predicted controls and predicted LD were analyzed for both model‐defined cutoffs: P > 0.59 and P > 0.68 (F).
Figure 3
Figure 3
Validation of predictive performance of the top two miRNA ratios in an independent cohort and analyses of the complete data set. miRNAs were analyzed by qPCR in 98 subjects of which 8 (8.1%) experienced the adverse outcome postsurgery. (A) The predictive performance of the previously defined multivariate logistic prediction models was validated using ROC analyses. The performance is described by the AUC and whether the classification deviates significantly from the random assignment (AUC = 0.5) is indicated by the P value. The percentage of true postoperative LD on predicted controls and predicted LD were analyzed for both model‐defined cutoffs: P > 0.59 and P > 0.68. The two cutoffs were further analyzed for their performance to predict postoperative LD in the entire cohort (B). Performance was described using SN, SP, PPV, NPV, and the OR, which is the ratio of odds of suffering from postoperative LD associated with a positive test result compared with a negative test result. The low‐stringency cutoff (P = 0.59) yielded PPV and NPV values of 0.70 and 0.89, respectively, whereas the stringent cutoff (P = 0.68) resulted in a PPV of 0.83, with an NPV of 0.85 (B). This means that 83% of the patients who tested positive suffered from postoperative LD, whereas 85% who tested negative did not suffer from postoperative LD. In contrast, 15% who tested negative did in fact suffer from postoperative LD. The ORs for an adverse event were 18.66 (P < 0.0001) and infinite (P < 0.0001), respectively. ROC curve analysis was performed for the microRNA model to compare its performance against that of standard liver function parameters (B). ORs for other adverse postoperative outcomes were analyzed for both model cutoffs: severe morbidity (C) and mortality (D). Postoperative ICU stay (E) and hospitalization (F) were significantly prolonged in our predicted risk groups (boxplots are shown without outliers; P values from two‐sided Wilcoxon rank‐sum test). Abbreviations: PDR, plasma disappearance rate; R15, retention rate at 15 minutes.
Figure 4
Figure 4
Tumor‐specific subgroup analyses of miRNA predictive potential for postoperative LD. Distribution of the combined ratio (miR151a‐5p/192‐5p//miR122‐5p/151a‐5p), ROC curves for an LR model (the performance is described by the AUC and whether the classification deviates significantly from the random assignment [AUC = 0.5] is indicated by the P value), and the percentage of true postoperative LD on predicted controls and predicted LD with respect to both model‐defined cutoffs (P > 0.59 and P > 0.68) are illustrated for the subgroups of patients with mCRC (A), HCC (B), and CCC (C), respectively.
Figure 5
Figure 5
miRNA pairs follow liver function recovery after partial hepatectomy and predict postoperative LD after the second step of ALPPS. Panel (A) illustrates the study design of this additional exploratory study as well as summarizes the procedural algorithm of ALPPS. The ALPPS procedure was described by Schnitzbauer et al. and has been developed to allow for rapid liver regeneration in borderline‐resectable patients with an insufficient liver remnant.50 Briefly, during the first step of the ALPPS procedure, the portal vein branch, feeding the tumor‐bearing liver lobe, is selectively ligated, whereas the arterial as well as bile structures are preserved and the liver parenchyma is further transected during this initial step of operation. This procedure leads to an improved liver regeneration within the time frame of days. Still, after this substantial gain of liver regeneration, a second surgical procedure has to be performed in which the ligated remaining liver lobes need to be removed. Perioperative dynamics of miRNAs were evaluated in a group of 7 patients with regular partial hepatectomy and 8 patients undergoing ALPPS (details are listed in Supporting Table S2) for which longitudinal measurement of miRNAs could be performed on the basis of repeatedly collected plasma samples. Time points of blood collection are given in (A). Perioperative dynamics of miRNA pairs as well as combined pairs are illustrated in (B) (POD 1 vs. pre‐OP, 151a‐5p_192‐5p, ALPPS, P = 0.012, regular major liver resection, P = 0.018; 122‐5p_151a‐5p, ALPPS, P = 0.012, regular major liver resection, P = 0.018, 122‐5p_151a‐5p II 151a‐5p_192‐5p, ALPPS, P = 0.012, regular major liver resection, P = 0.018; POD 5 vs. POD 1, 151a‐5p_192‐5p, ALPPS, P = 0.018, regular major liver resection, P = 0.018; 122‐5p_151a‐5p, ALPPS, P = 0.018, regular major liver resection, P = 0.018, 122‐5p_151a‐5p II 151a‐5p_192‐5p, ALPPS, P = 0.018, regular major liver resection, P = 0.018). As during the second step of ALPPS, only the atrophic liver lobe is removed; we further analyzed miRNA pairs after the second step of ALPPS as illustrated in (C), showing an almost vanished increase in miRNA ratios after this second operation. Ultimately, (D) illustrates the predictive potential of the combined miRNA pairs before the second step of ALPPS as stratified according to postoperative LD and mortality after the removal of the atrophic lobe. *P < 0.05, **P < 0.005.
Figure 6
Figure 6
Study overview. In the discovery phase, plasma of 48 patients (21 with LD matched with 27 patients without LD after liver resection) was analyzed before operation to determine if miRNA signatures can serve as predictive markers. Using RNA sequencing, 19 microRNAs of interest were discovered and subjected to qPCR confirmation. In‐depth analysis predicted a marker potential for the miRNA pairs miR‐122‐5p/miR151a and miR‐151a/miR192‐5p (silver box). In the validation phase, the two miRNA pairs were reevaluated in an independent cohort consisting of 98 patients (8 with LD and 90 without LD after liver resection) (golden box). For performance evaluation, the combined data set was used to evaluate SN, SP, PPV, NPV, and ORs and compare them to previously used clinical markers (platinum box).

Comment in

References

    1. Forbes SJ, Newsome PN. Liver regeneration—mechanisms and models to clinical application. Nat Rev Gastroenterol Hepatol 2016;13:473‐485. - PubMed
    1. Lafaro K, Buettner S, Maqsood H, Wagner D, Bagante F, Spolverato G, et al. Defining post hepatectomy liver insufficiency: where do we stand? J Gastrointest Surg 2015;19:2079‐2092. - PubMed
    1. Qadan M, Garden OJ, Corvera CU, Visser BC. Management of postoperative hepatic failure. J Am Coll Surg 2016;222:195‐208. - PubMed
    1. Hackl M, Heilmeier U, Weilner S, Grillari J. Circulating microRNAs as novel biomarkers for bone diseases—complex signatures for multifactorial diseases? Mol Cell Endocrinol 2016;432:83‐95. - PubMed
    1. Bartel DP. MicroRNAs: genomics, biogenesis, mechanism, and function. Cell 2004;116:281‐297. - PubMed

Publication types

MeSH terms