. 2019 Apr;191(4):342-351.
doi: 10.1667/RR15243.1. Epub 2019 Feb 19.

Automated Triage Radiation Biodosimetry: Integrating Imaging Flow Cytometry with High-Throughput Robotics to Perform the Cytokinesis-Block Micronucleus Assay

Affiliations

Automated Triage Radiation Biodosimetry: Integrating Imaging Flow Cytometry with High-Throughput Robotics to Perform the Cytokinesis-Block Micronucleus Assay

Qi Wang et al. Radiat Res. 2019 Apr.

Abstract

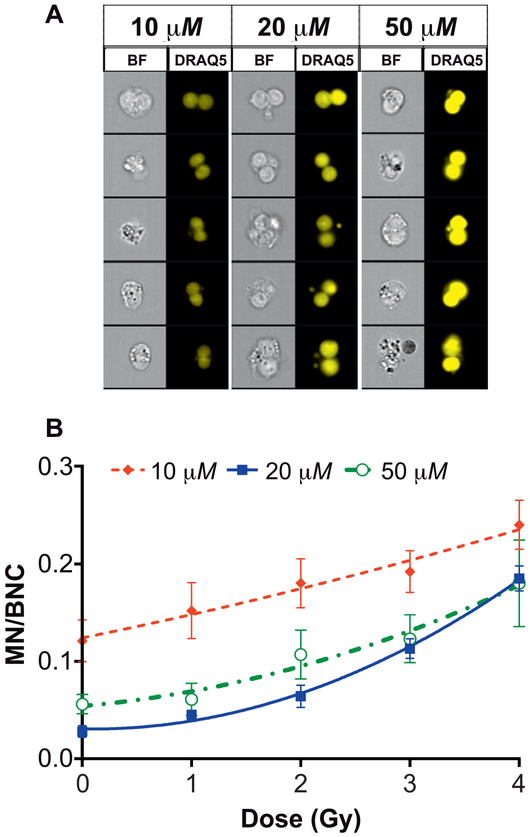
The cytokinesis-block micronucleus (CBMN) assay has become a fully-validated and standardized method for radiation biodosimetry. The assay is typically performed using microscopy, which is labor intensive, time consuming and impractical after a large-scale radiological/nuclear event. Imaging flow cytometry (IFC), which combines the statistical power of traditional flow cytometry with the sensitivity and specificity of microscopy, has been recently used to perform the CBMN assay. Since this technology is capable of automated sample acquisition and multi-file analysis, we have integrated IFC into our Rapid Automated Biodosimetry Technology (RABiT-II). Assay development and optimization studies were designed to increase the yield of binucleated cells (BNCs), and improve data acquisition and analysis templates to increase the speed and accuracy of image analysis. Human peripheral blood samples were exposed ex vivo with up to 4 Gy of c rays at a dose rate of 0.73 Gy/min. After irradiation, samples were transferred to microtubes (total volume of 1 ml including blood and media) and organized into a standard 8 × 12 plate format. Sample processing methods were modified by increasing the blood-to-media ratio, adding hypotonic solution prior to cell fixation and optimizing nuclear DRAQ5 staining, leading to an increase of 81% in BNC yield. Modification of the imaging processing algorithms within IFC software also improved BNC and MN identification, and reduced the average time of image analysis by 78%. Finally, 50 ll of irradiated whole blood was cultured with 200 ll of media in 96-well plates. All sample processing steps were performed automatically using the RABiT-II cell: :explorer robotic system adopting the optimized IFC-CBMN assay protocol. The results presented here detail a novel, high-throughput RABiT-IFC CBMN assay that possesses the potential to increase capacity for triage biodosimetry during a large-scale radiological/nuclear event.


Figures

FIG. 1.
FIG. 1.
Dose-response calibration curve representing the average rate of micronuclei (MN) per binucleated cell (BNC) in lymphocytes from 100-μl whole blood samples, which were collected from four healthy donors and ex vivo exposed to 0 to 4 Gy. Error bars represent the standard error of the mean.
FIG. 2.
FIG. 2.
Optimization of blood-to-media ratio. Panel A: Dose-response calibration curves indicating a similar increase in MN frequency for both the 1:9 and 2:8 blood-to-media ratios. Panel B: The average number of BNCs scored for the 1:9 and 2:8 blood-to-media ratios. All data points represent the average of four donors and error bars represent the standard error of the mean. Statistical significance of BNCs between the two groups was examined by the Wilcoxon signed rank test (*P < 0.05).
FIG. 3.
FIG. 3.
Improvements to the BNC images and dose-response calibration curves through the addition of hypotonic solution (75 mM KCl). Panel A: More spatially separated nuclei and MN, with more uniform DRAQ5 staining intensity was observed with the use of KCl. Panel B: The dose-response calibration curves representing the average of four donors showing the rate of MN/BNC using sample processing protocols with or without the use of KCl. Error bars represent the standard error of the mean.
FIG. 4.
FIG. 4.
Improvement in the MN and BNC images through the optimization of DRAQ5 concentration. Panel A: At 20 μM of DRAQ5, the BNC images demonstrate optimal signal-to-noise ratio. Panel B: Average dose-response calibration curves for four different donors using either 10, 20 or 50 μM as the final concentration of DRAQ5. Error bars represent the standard error of the mean.
FIG. 5.
FIG. 5.
Data acquisition template used to collect only single, highly-focused, DNA-positive cells. Panel A: Bivariate plot of BF aspect ratio versus BF area, allowing for the selection of single cells and the removal of doublets and small and large debris. Panel B: Bivariate plot of DRAQ5 gradient RMS versus BF gradient RMS enabling the selection of sharply-focused cells while eliminating blurry cells. Panel C: Histogram of DRAQ5 intensity allows for the selection of DNA positive cells and the elimination of very dimly stained cells.
FIG. 6.
FIG. 6.
Elimination of false positive artifacts. Panel A: Use of the cytoplasm mask to identify false-positive MN residing outside of the cytoplasm (top image) and the skeleton mask to identify artifacts residing between the two nuclei that are incorrectly identified as MN (middle image). Panel B: Use of the aspect ratio of the MN mask to identify elongated false-positive MN and the ratio of the median pixel intensity of the MN and BNC images to eliminate dim artifacts.
FIG. 7.
FIG. 7.
Automated CBMN assay combining the RABiT-II and ISX systems using 50 μl-whole blood samples. Panel A: Final protocol for sample processing. Panel B: Individual dose-response curves showing the rate of MN per BNC in γ-ray irradiated human lymphocytes. Dashed lines represent the rate of MN per BNC versus dose of each individual donor. The solid line represents average rate of MN per BNC versus dose from all six healthy donors. Each curve was fitted with a separate liner-quadratic function.

Similar articles

Cited by

References

    1. Fenech M, Morley AA. Measurement of micronuclei in lymphocytes. Mutat Res 1985; 147:29–36. - PubMed
    1. Fenech M Cytokinesis-block micronucleus cytome assay. Nat Protoc 2007; 2:1084–104. - PubMed
    1. Fenech M, Morley AA. Cytokinesis-block micronucleus method in human lymphocytes: effect of in vivo ageing and low dose X-irradiation. Mutat Res 1986; 161:193–8. - PubMed
    1. Fenech M The lymphocyte cytokinesis-block micronucleus cytome assay and its application in radiation biodosimetry. Health Phys 2010; 98:234–43. - PubMed
    1. Fenech M The in vitro micronucleus technique. Mutat Res Fund Mol Mech Mut 2000; 455:81–95. - PubMed

Publication types