. 2019 Apr 4;4(7):e126140.
doi: 10.1172/jci.insight.126140.

Chromatin remodeler HELLS maintains glioma stem cells through E2F3 and MYC

Affiliations

Chromatin remodeler HELLS maintains glioma stem cells through E2F3 and MYC

Guoxin Zhang et al. JCI Insight. .

Abstract

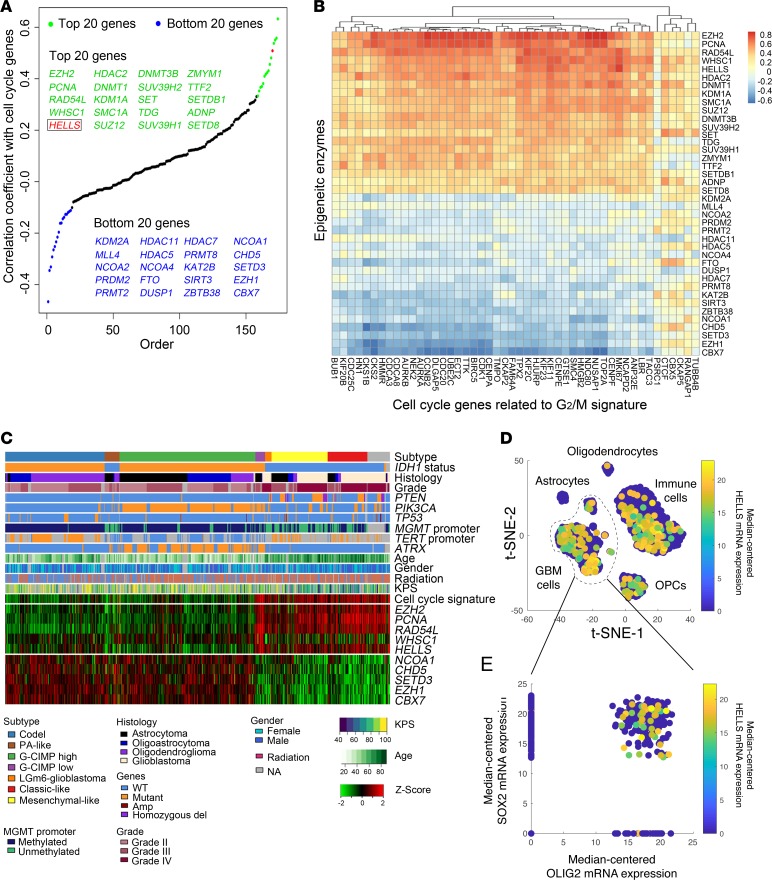
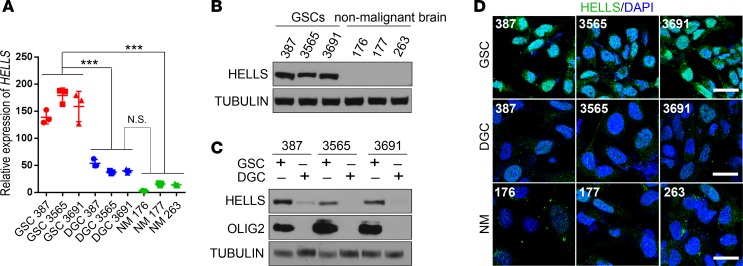
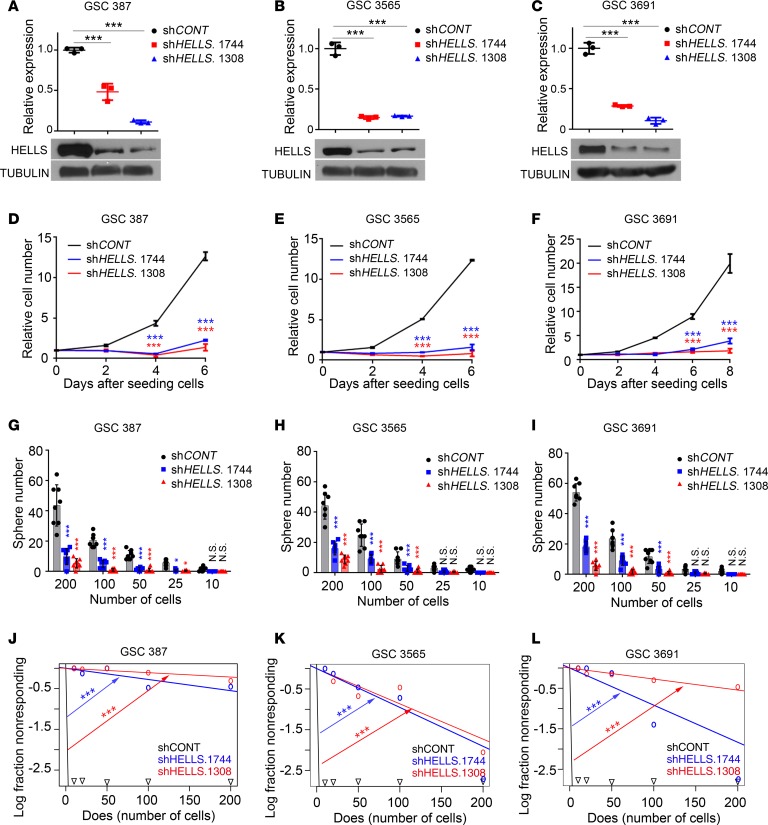
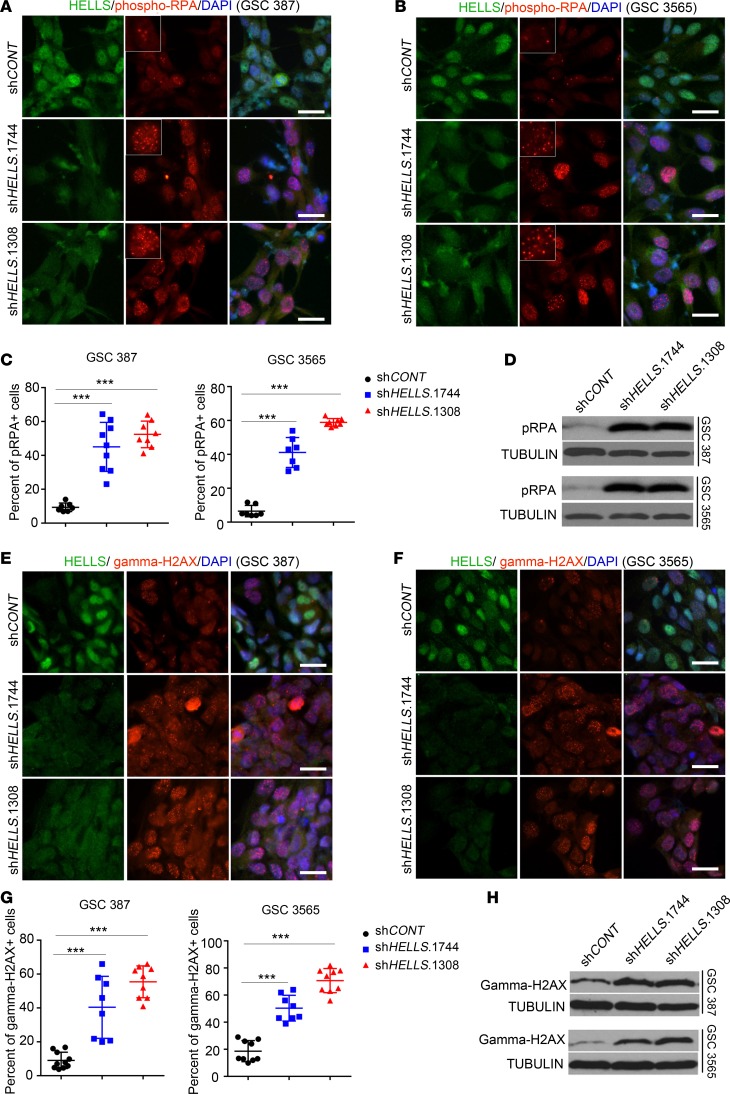
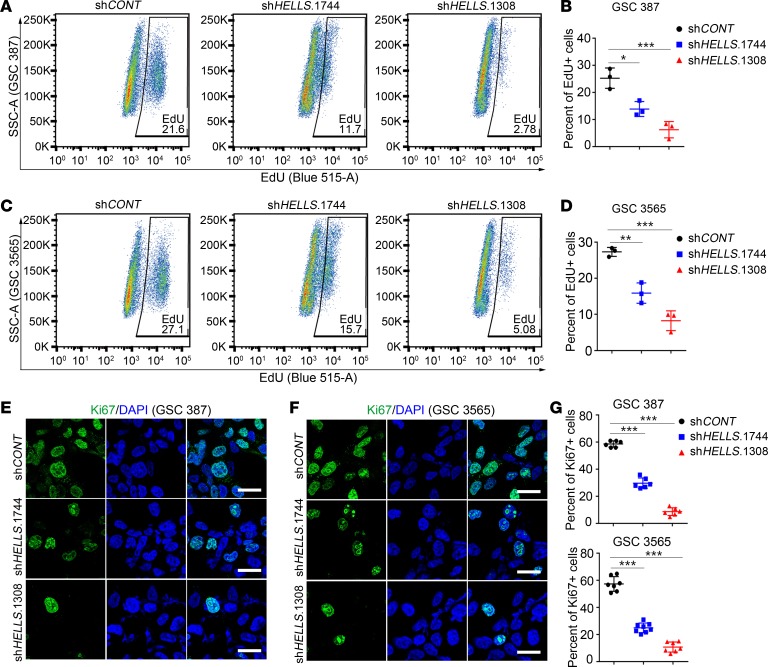
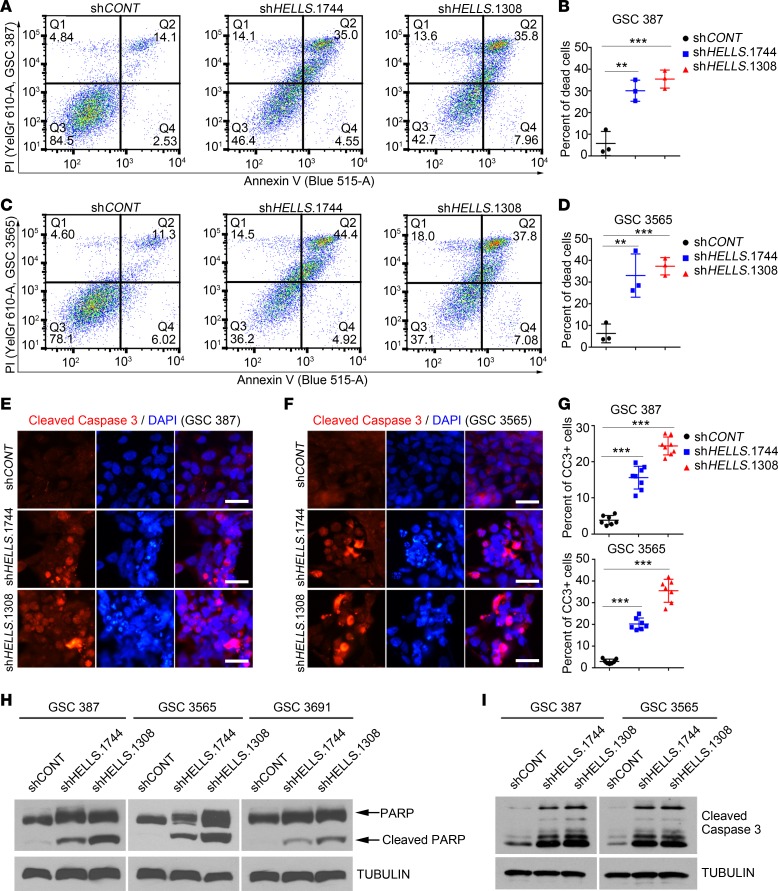
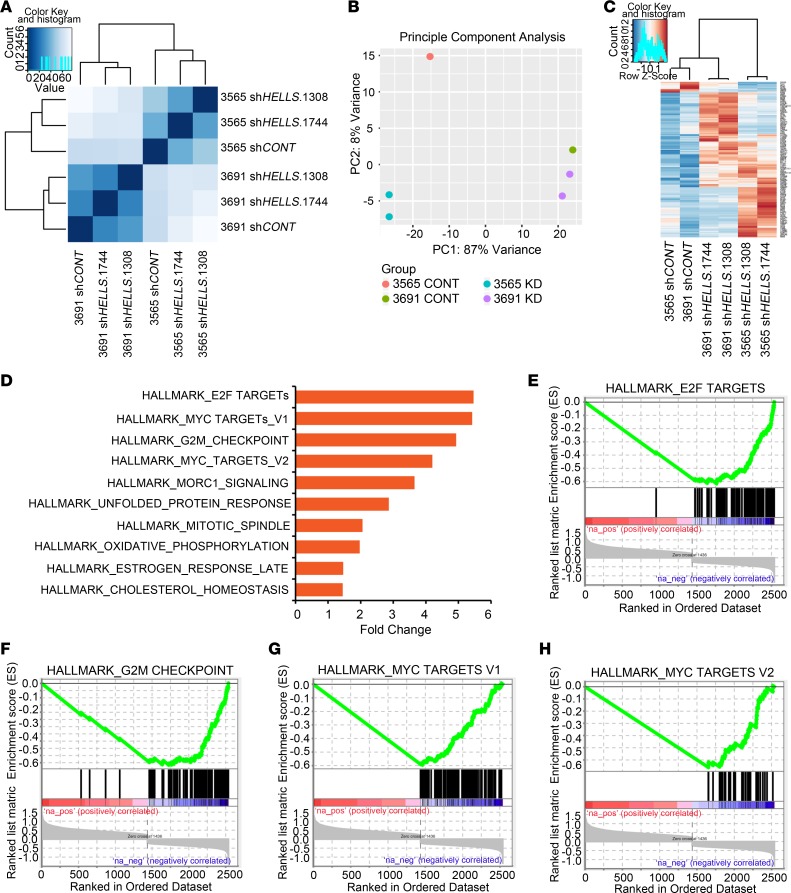
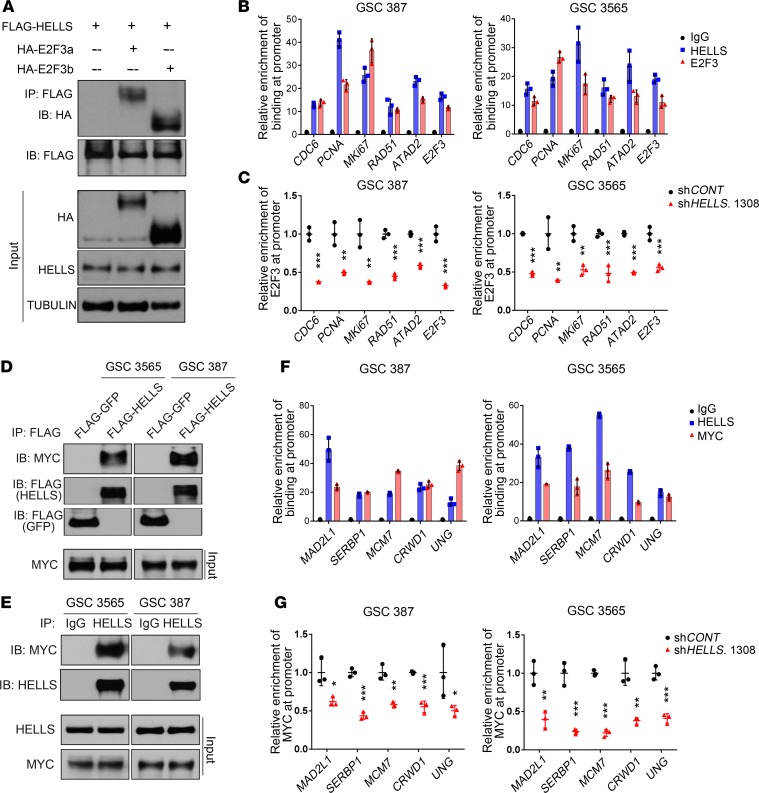
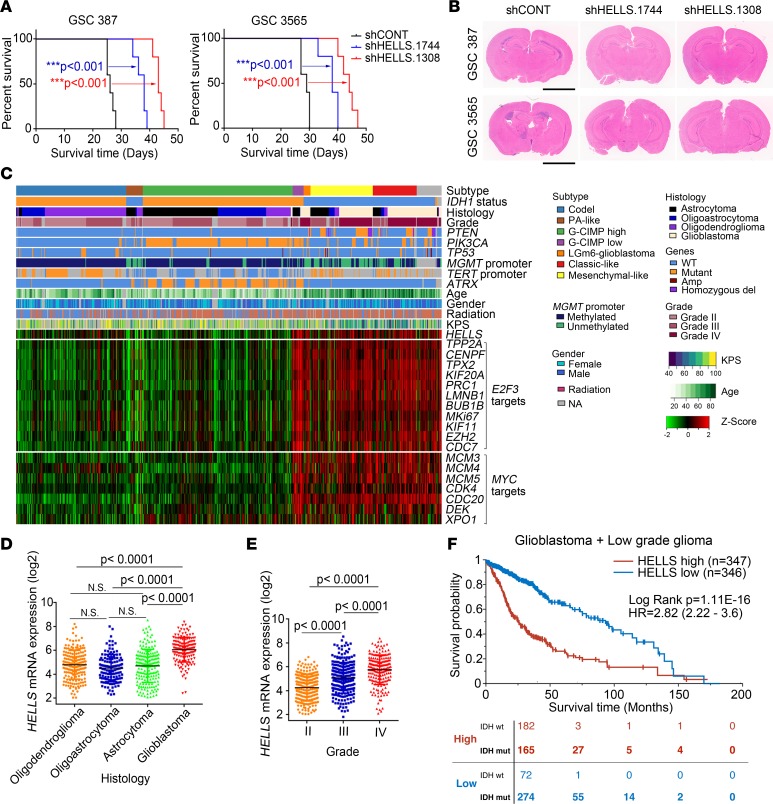
Glioblastomas, which contain stem cell-like glioblastoma stem cells (GSCs), are universally lethal cancers. While neural stem cells (NSCs) are usually quiescent, single-cell studies suggest that proliferating glioblastoma cells reside in the GSC population. Interrogating in silico glioma databases for epigenetic regulators that correlate with cell cycle regulation, we identified the chromatin remodeler HELLS as a potential target in glioblastoma. GSCs preferentially expressed HELLS compared with their differentiated tumor progeny and nonmalignant brain cells. Targeting HELLS disrupted GSC proliferation, survival, and self-renewal with induction of replication stress and DNA damage. Investigating potential molecular mechanisms downstream of HELLS revealed that HELLS interacted with the core oncogenic transcription factors, E2F3 and MYC, to regulate gene expression critical to GSC proliferation and maintenance. Supporting the interaction, HELLS expression strongly correlated with targets of E2F3 and MYC transcriptional activity in glioblastoma patients. The potential clinical significance of HELLS was reinforced by improved survival of tumor-bearing mice upon targeting HELLS and poor prognosis of glioma patients with elevated HELLS expression. Collectively, targeting HELLS may permit the functional disruption of the relatively undruggable MYC and E2F3 transcription factors and serve as a novel therapeutic paradigm for glioblastoma.

Keywords: Brain cancer; Oncology; Stem cells.


Conflict of interest statement

Conflict of interest: The authors have declared that no conflict of interest exists.

Figures

Figure 1
Figure 1. Proliferating glioma cells express HELLS.
(A) Correlation between mRNA expression levels of chromatin regulators and G2/M cell cycle signature in glioblastoma patients. The top 20 (green) and bottom 20 (blue) epigenetic regulators are listed. HELLS is labeled in red. (B) Heatmap displaying correlations between epigenetic regulators and individual G2/M signature gene expression in glioblastoma patients. The top 20 and bottom 20 chromatin regulators are displayed. (C) RNA-seq, whole exome, and clinical phenotype data were aggregated from TCGA glioblastoma (GBM) and low-grade glioma (LGG) data set to visualize the expression patterns of top 5 and bottom 5 epigenetic regulators identified in A. “Codel,” codeletion of chromosomes 1p and 19q; PA-like, pilocytic astrocytoma–like; CIMP, glioma-CpG island methylator phenotype; LGm6-GBM, a subgroup of glioma enriched for histologic low-grade gliomas that also contains a subset of tumors with GBM-defining histologic criteria; KPS, Karnofsky performance status. (D and E) HELLS expression is enriched in SOX2+ glioblastoma cells in bulk tumor single-cell RNA-seq data sets. (D) t-Distributed stochastic neighbor embedding (t-SNE) plot of combined single-cell RNA-seq data from 4 glioblastoma tumors. Each dot represents a single cell with HELLS mRNA expression denoted by the color map. (E) Scatter plot of SOX2 and OLIG2 mRNA expression among glioblastoma tumor cells. Each dot represents a single cell with HELLS mRNA expression denoted by the color map.
Figure 2
Figure 2. GSCs preferentially express HELLS.
(A) qPCR analysis of HELLS mRNA levels in matched GSCs and DGCs (387, 3565, and 3691) and nonmalignant brain cultures (176, 177, and 263). At least 3 independent experiments were performed. Data are presented as mean ± SD. **P < 0.01, ***P < 0.001, by 1-way ANOVA with Tukey’s multiple comparisons test. (B) Western blot for HELLS protein in GSCs (387, 3565, and 3691) and nonmalignant brain cultures (176, 177, and 263). Tubulin was used as a loading control. Three independent experiments were performed. (C) Western blot for HELLS protein in matched GSCs and DGCs (387, 3565, and 3691) and nonmalignant brain cultures (176, 177, and 263). OLIG2 was used as a GSC marker. Tubulin was used as a loading control. Three independent experiments were performed. (D) Immunofluorescent staining of HELLS in matched GSCs and DGCs (387, 3565, and 3691) and nonmalignant brain cultures (176, 177, and 263). HELLS signals are shown as green, and DAPI as blue. Three independent experiments were performed. Scale bars: 20 μm.
Figure 3
Figure 3. HELLS maintains GSC proliferation and self-renewal.
(AC) qPCR analysis of HELLS mRNA and immunoblot for HELLS protein levels after shRNA-mediated HELLS knockdown in GSC 387 (A), 3565 (B), and 3691 (C). Three independent experiments were performed. Data are presented as mean ± SD. ***P < 0.001, by 1-way ANOVA with Tukey’s multiple comparison test. (D–F) CellTiter-Glo assay after HELLS knockdown in GSC 387 (D), 3565 (E), and 3691 (F). Three independent experiments were performed. Data are presented as mean ± SD. ***P < 0.001, by 2-way ANOVA with Tukey’s multiple comparisons test. (GI) Sphere numbers of GSC 387 (G), 3565 (H), and 3691 (I) after HELLS knockdown. Three independent experiments were performed. Data are presented as mean ± SD. *P < 0.05, ***P < 0.001, by 2-way ANOVA with Tukey’s multiple comparisons test. (JL) Limited dilution assay after HELLS knockdown in GSC 387 (J), 3565 (K), and 3691 (L). Three independent experiments were performed. Data are presented as mean ± SD. ***P < 0.001, by χ2 test for pair-wise differences.
Figure 4
Figure 4. Targeting HELLS induces replication stress and DNA damage.
(A and B) Immunofluorescent staining of HELLS and phosphorylated RPA32/RPA2 (pRPA) in GSC 387 (A) and 3565 (B) after knocking down HELLS expression. HELLS signals are shown as green and pRPA as red. DAPI is shown as blue. Three independent experiments were performed. Scale bars: 20 μm. (C) Quantification of cells with ≥5 foci of phosphorylated RPA32/RPA2 foci in GSC model 387 and 3565 after HELLS knockdown. Data are presented as mean ± SD. ***P < 0.001, by 1-way ANOVA with Tukey’s multiple comparisons test. shCONT, n = 7; shHELLS.1744, n = 9; shHELLS.1308, n = 8. (D) Immunoblot for phosphorylated RPA32/RPA2 in GSC 387 and 3565 after HELLS knockdown. Tubulin was used as input. Three independent experiments were performed. (E and F) Immunofluorescent staining for HELLS and γH2AX in GSC 387 (E) and 3565 (F) after knocking down HELLS expression. HELLS signals are shown as green and γH2AX as red. DAPI was used for nucleus staining and is shown as blue. Three independent experiments were performed. Scale bars: 20 μm. (G) Quantification of cells with ≥5 foci of H2AX foci in GSC model 387 and 3565 after HELLS knockdown. Data are presented as mean ± SD. ***P < 0.001, by 1-way ANOVA with Tukey’s multiple comparisons test. shCONT, n = 7; shHELLS.1744, n = 7; shHELLS.1308, n = 8. (H)Immunoblot for γH2AX in GSC 387 and 3565 after HELLS knockdown. Tubulin was used as input. Three independent experiments were performed.
Figure 5
Figure 5. Targeting HELLS reduces GSC cell cycle progression.
(A) Flow cytometry of EdU incorporation after 2-hour incubation with 10 μM EdU in GSC 387 analyzed 48 hours after HELLS knockdown. The y axis was gated by SSC, and the x axis was gated by EdU signals. Three independent experiments were performed. (B) Quantification of EdU+ cells from A. Data are presented as mean ± SD. *P < 0.05, ***P < 0.001, by 1-way ANOVA with Tukey’s multiple comparisons test. Three biologic replicates were used. (C) Flow cytometry of EdU incorporation assays after 2-hour incubation with 10 μM EdU in GSC 3565 analyzed 48 hours after HELLS knockdown. The y axis was gated by SSC, and the x axis was gated by EdU signals. Three independent experiments were performed. (D) Quantification of EdU+ cells from C. Data are presented as mean ± SD. **P < 0.01, ***P < 0.001, by 1-way ANOVA with Tukey’s comparison test. Three biologic replicates were used. (E and F) Ki67 staining in GSC 387 (E) and 3565 (F) after HELLS knockdown. Ki67 signals are shown as green and DAPI as blue. Three independent experiments were performed. Scale bars: 20 μm. (G)Quantification of Ki67+ cells in GSC 387 (top) and 3565 (bottom) after HELLS knockdown. Data are presented as mean ± SD. ***P < 0.001, by 1-way ANOVA with Tukey’s multiple comparisons test. For GSC 387: shCONT, n = 6; shHELLS.1744, n = 6; shHELLS.1308, n = 6. For GSC 3565: shCONT, n = 7; shHELLS.1744, n = 8; shHELLS.1308, n = 7.
Figure 6
Figure 6. Disruption of HELLS expression induces GSC apoptosis.
(A) Flow cytometry of annexin V/propidium iodide (annexin V/PI) staining in GSC 387 analyzed 48 hours after HELLS knockdown. Signals from PI are shown on the y axis, and those from annexin V are shown on the x axis. Three independent experiments were performed. (B) Quantification of annexin V/PI double-positive populations from A. Three independent experiments were performed. Data are presented as mean ± SD. **P < 0.01, ***P < 0.001, by 1-way ANOVA with Tukey’s multiple comparisons test. (C) Flow cytometry of annexin V/PI staining in GSC 3565 analyzed 48 hours after HELLS knockdown. Signals from PI are shown on the y axis, and those from annexin V are shown in x axis. Three independent experiments were performed. (D) Quantification of annexin V/PI double-positive populations from C. Three independent experiments were performed. Data are presented as mean ± SD. **P < 0.01, ***P < 0.001, by 1-way ANOVA with Tukey’s multiple comparisons test. (E and F) Cleaved caspase-3 staining in GSC 387 (E) and 3565 (F) after HELLS knockdown. Three independent experiments were performed. Cleaved caspase-3 signals are shown as red and DAPI as blue. Scale bars: 20 μm. (G) Quantification of cleaved caspase-3+ cells in GSC 387 (top) and 3565 (bottom) after HELLS knockdown. Data are presented as mean ± SD. ***P < 0.001, by 1-way ANOVA with Tukey’s multiple comparisons test. For GSC 387: shCONT, n = 7; shHELLS.1744, n = 8; shHELLS.1308, n = 8. For GSC 3565: shCONT, n = 7; shHELLS.1744, n = 7; shHELLS.1308, n = 7. (H and I) Immunoblot for cleavage of PARP (H) and caspase-3 (I) in GSC 387, 3565, and 3691 after HELLS knockdown. Three independent experiments were performed.
Figure 7
Figure 7. HELLS expression correlates with expression of E2F3 and MYC mRNA and downstream targets.
(A) GSC 3565 and 3691 were transduced with either shCONT or 1 of 2 nonoverlapping sHELLS; they then underwent expression analysis by RNA-seq. Unbiased clustering is shown. (B) Principal component analysis of RNA-seq data from A in GSC 3565 and 3691 after HELLS knockdown. (C) Heatmap of the differentially expressed genes in GSC 3565 and 3691 after HELLS knockdown in A. (D) GSEA for the differentially expressed genes obtained from GSC models 3565 and 3691 after HELLS knockdown in A. (E–H) Enrichment plots for E2F targets (E), G2/M checkpoint (F), and MYC targets (G and H) derived from RNA-seq data in A.
Figure 8
Figure 8. HELLS interacts with E2F3 and MYC to regulate gene expression.
(A) GSC 3565 cells were transduced with FLAG-HELLS and either HA-E2F3a or HA-E2F3b and then underwent whole cell lysis. Immunoprecipitation for HELLS was performed on the lysates with an anti-FLAG antibody, which were then resolved by SDS-PAGE, and immunoblotting was performed with an anti-HA antibody. Inputs are indicated. Results are typical of 3 independent experiments. (B) GSC 387 and 3565 underwent ChIP followed by PCR (ChIP-qPCR) using antibodies for IgG control, HELLS, or E2F3. Primers specific for previously described E2F3 targets were used (ref. 32). Data are presented as mean ± SD. Three independent experiments were performed. (C) ChIP-qPCR analysis for binding of E2F3 to its targets gene in GSC 387 and 3565 after HELLS knockdown. Data are presented as mean ± SD. **P < 0.01, ***P < 0.001, by t test. Three independent experiments were performed. (D) GSC 387 and 3565 were transduced with either FLAG-HELLS or FLAG-GFP and then lysed. An anti-FLAG antibody was used for immunoprecipitation, and immunoblotting was performed with an anti-MYC antibody. Inputs are indicated. Three independent experiments were performed. (E) Endogenous coimmunoprecipitation experiments to consider HELLS and MYC binding were performed in GSC 387 and 3565. Whole cell lysates were collected and subjected to immunoprecipitation with an anti-HELLS or IgG control antibody and then immunoblotting was performed with an anti-MYC antibody. Inputs are indicated. Three independent experiments were performed. (F) ChIP-qPCR analysis for binding of HELLS and MYC in GSC 387 and 3565. Primers specific for MYC targets were used (ref. 32). IgG was used as control. Data are presented as mean ± SD. Three independent experiments were performed. (G) ChIP-qPCR analysis for binding of MYC to its targets gene in GSC 387 and 3565 after HELLS knockdown. Data are presented as mean ± SD. *P < 0.05, **P < 0.01, ***P < 0.001, by t test. Three independent experiments were performed.
Figure 9
Figure 9. HELLS is required for in vivo glioblastoma growth and informs prognosis.
(A) Kaplan-Meier survival curves of immunocompromised mice bearing intracranial GSC 387 and 3565 transduced with either 1 of 2 shRNAs targeting HELLS or nontargeting control. ***P < 0.001, by Mantel-Cox log-rank test. n = 5. (B) Representative images of H&E-stained brain sections 20 days after transplanting GSC 387 and 3565 transduced with either 1 of 2 shRNAs targeting HELLS or nontargeting control. Scale bars: 3 mm. (C) RNA-seq, whole exome, and clinical phenotype data were aggregated from TCGA glioblastoma (GBM) and low-grade glioma (LGG) data sets to visualize the expression patterns of HELLS, E2F3 targets, and MYC targets across glioma. “Codel,” codeletion of chromosomes 1p and 19q; PA-like, pilocytic astrocytoma–like; CIMP, glioma-CpG island methylator phenotype; LGm6-GBM, a subgroup of glioma enriched for histologic low-grade gliomas that also contains a subset of tumors with GBM-defining histologic criteria; KPS, Karnofsky performance status. (D) HELLS expression in patients with oligodendroglioma, oligoastrocytoma, astrocytoma, and glioblastoma. Data are presented as mean ± SD. P values were determined by 1-way ANOVA with Tukey’s multiple comparisons test. (E) HELLS expression across glioma tumor grades. Data are presented as mean ± SD. P values were determined by 1-way ANOVA with Tukey’s multiple comparisons test. (F) Survival curves of glioma patients with higher and lower HELLS expression. Significance was determined by Mantel-Cox log-rank testing. The distribution of IDH WT and mutant patients in both the HELLShi (red) and the HELLSlo (blue) group at the indicated time points is listed at bottom.

Similar articles

Cited by

References

    1. Weller M, et al. Glioma. Nat Rev Dis Primers. 2015;1:15017. - PubMed
    1. Ostrom QT, et al. CBTRUS Statistical Report: Primary brain and other central nervous system tumors diagnosed in the United States in 2010-2014. Neuro-oncology. 2017;19(suppl_5):v1–v88. doi: 10.1093/neuonc/nox158. - DOI - PMC - PubMed
    1. Stupp R, et al. Effects of radiotherapy with concomitant and adjuvant temozolomide versus radiotherapy alone on survival in glioblastoma in a randomised phase III study: 5-year analysis of the EORTC-NCIC trial. Lancet Oncol. 2009;10(5):459–466. doi: 10.1016/S1470-2045(09)70025-7. - DOI - PubMed
    1. Stupp R, et al. Radiotherapy plus concomitant and adjuvant temozolomide for glioblastoma. N Engl J Med. 2005;352(10):987–996. doi: 10.1056/NEJMoa043330. - DOI - PubMed
    1. Darmanis S, et al. Single-cell RNA-seq analysis of infiltrating neoplastic cells at the migrating front of human glioblastoma. Cell Rep. 2017;21(5):1399–1410. doi: 10.1016/j.celrep.2017.10.030. - DOI - PMC - PubMed

Publication types

MeSH terms