. 2019 Feb 19;15(2):e1006784.
doi: 10.1371/journal.pcbi.1006784. eCollection 2019 Feb.

Multi-modality in gene regulatory networks with slow promoter kinetics

Affiliations

Multi-modality in gene regulatory networks with slow promoter kinetics

M Ali Al-Radhawi et al. PLoS Comput Biol. .

Abstract

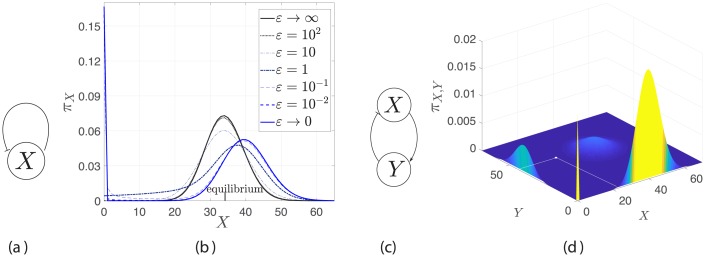
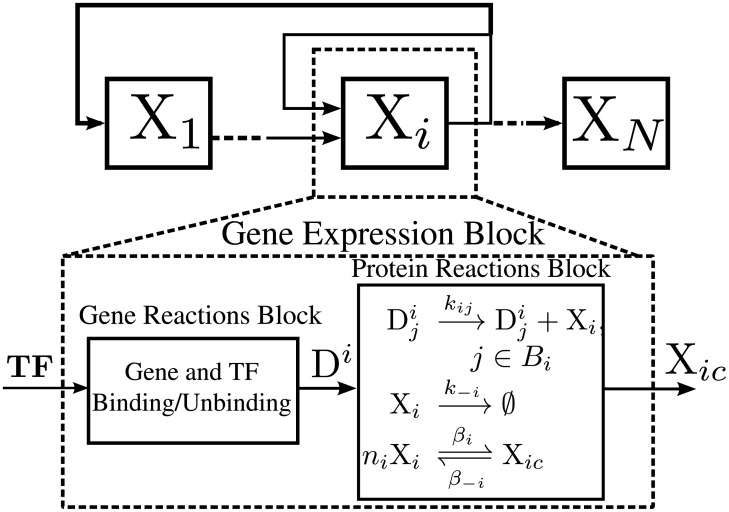
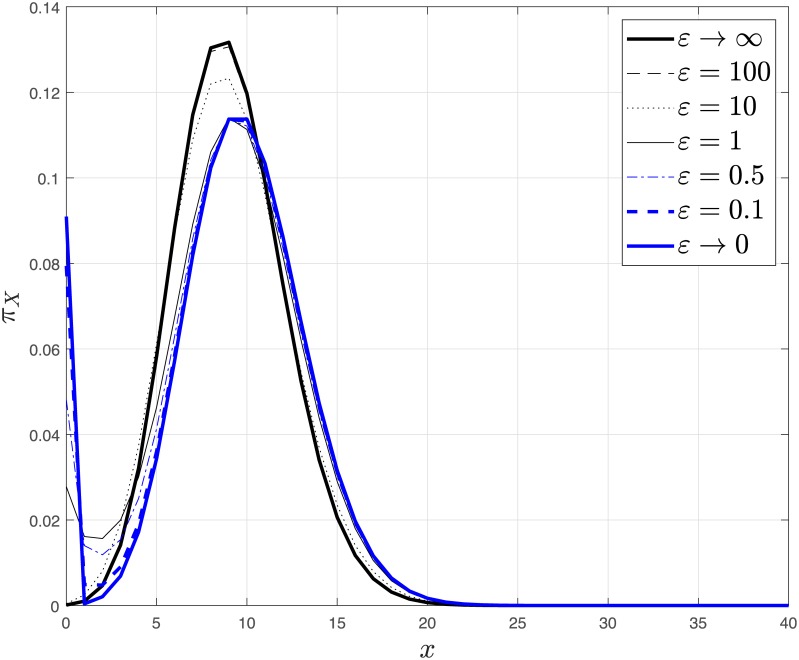
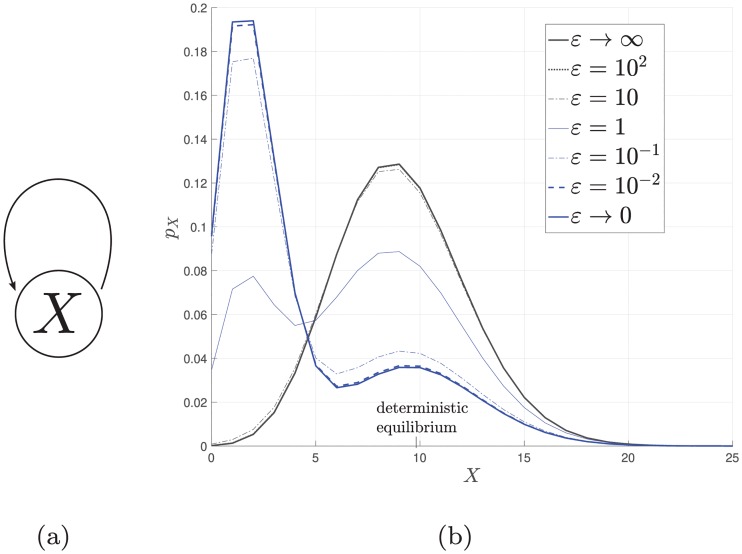
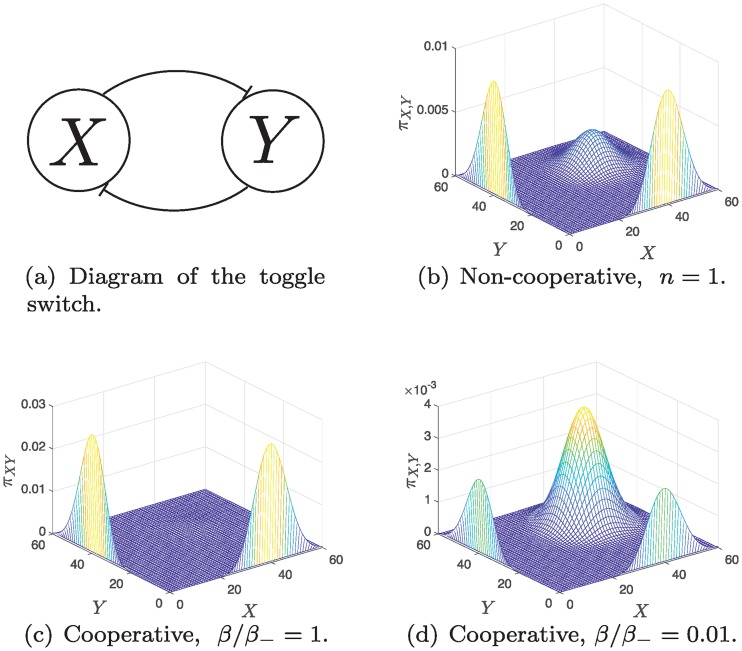
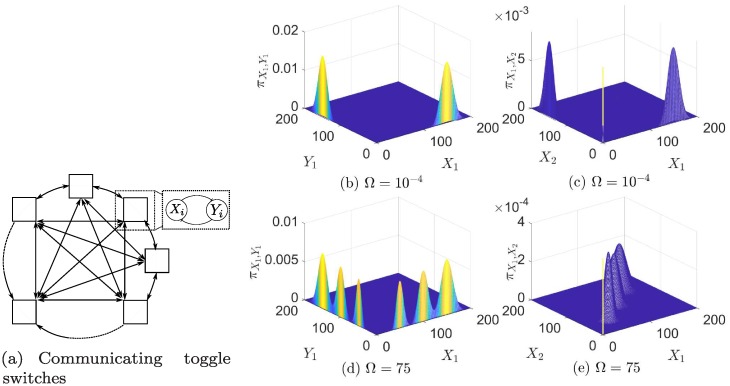
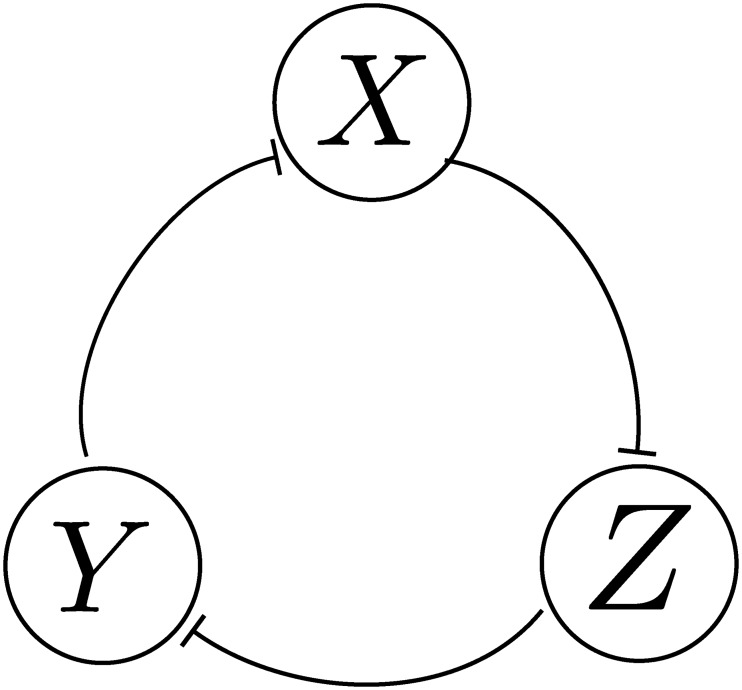
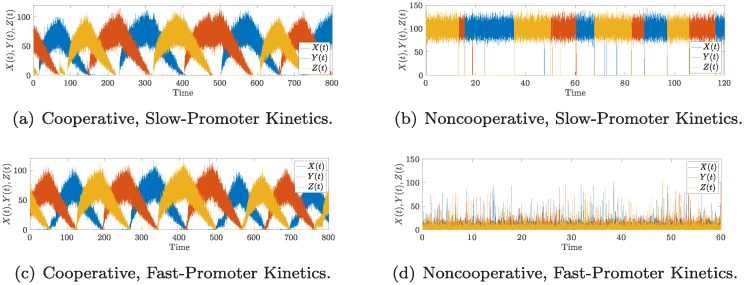
Phenotypical variability in the absence of genetic variation often reflects complex energetic landscapes associated with underlying gene regulatory networks (GRNs). In this view, different phenotypes are associated with alternative states of complex nonlinear systems: stable attractors in deterministic models or modes of stationary distributions in stochastic descriptions. We provide theoretical and practical characterizations of these landscapes, specifically focusing on stochastic Slow Promoter Kinetics (SPK), a time scale relevant when transcription factor binding and unbinding are affected by epigenetic processes like DNA methylation and chromatin remodeling. In this case, largely unexplored except for numerical simulations, adiabatic approximations of promoter kinetics are not appropriate. In contrast to the existing literature, we provide rigorous analytic characterizations of multiple modes. A general formal approach gives insight into the influence of parameters and the prediction of how changes in GRN wiring, for example through mutations or artificial interventions, impact the possible number, location, and likelihood of alternative states. We adapt tools from the mathematical field of singular perturbation theory to represent stationary distributions of Chemical Master Equations for GRNs as mixtures of Poisson distributions and obtain explicit formulas for the locations and probabilities of metastable states as a function of the parameters describing the system. As illustrations, the theory is used to tease out the role of cooperative binding in stochastic models in comparison to deterministic models, and applications are given to various model systems, such as toggle switches in isolation or in communicating populations, a synthetic oscillator, and a trans-differentiation network.


Conflict of interest statement

The authors have declared that no competing interests exist.

Figures

Fig 1
Fig 1. Emergence of multi-modality due to SPK.
(a) A diagram of a self-repressing gene, where ε is a parameter that multiplies the kinetic rates of all gene reactions (b) The stationary PMF for different ε which is showing transition from fast promoter kinetics, i.e., ε → ∞, to SPK, i.e., ε → 0, in a non-cooperative self-repressing gene. The stationary PMF is bimodal for small ε and unimodal for large ε. The deterministic equilibrium coincides with the fast kinetics mode. Refer to S1 Text §6.1. (c) A diagram of a repression-activation two-node network. (d) SPK gives rise to four modes while the deterministic model admits a unique stable equilibrium which is marked as a white point, refer to S1 Text §6.2. The surface is plotted using (10).
Fig 2
Fig 2. A gene expression block.
A GRN that consists of gene expression blocks. A block consists of a gene reactions block and a protein reactions block. The gene reactions are described in the text. TF is a vector of TFs which can be monomers, dimers, or higher order multimers. Di is a vector whose components consist of the Dji’s. The dimension of TF is equal to the number of binding sites of the gene.
Fig 3
Fig 3. The stationary probability distribution for different ε which shows the transition from fast promoter kinetics, i.e., ε → ∞, to slow promoter kinetics, i.e., ε → 0, in a single unregulated gene.
The stationary distribution is bimodal for small ε, i.e. ε ≤ 1, and unimodal for large ε. The deterministic equilibrium coincides with the fast kinetics mode at αα+αkk. The slow kinetic limit is calculated via Corollary 4, the fast kinetics limit is a Poisson centered at the deterministic equilibrium, while the remaining curves are computed by evaluating the exact solution given in [64]. The parameters are α = 0.1, α = 1, k = 2, k = 20.
Fig 4
Fig 4
More modes emerge due to SPK in cooperative self-activating gene (a) A self-activating gene. (b) The stationary PMF for different ε which shows the transition from fast promoter kinetics to SPK in a leaky cooperative self-activation of a gene with cooperativity index 2. The slow kinetic limit is calculated via (10), while the remaining curves are computed by a finite projection solution [57] of the CME. The parameters are α = α_ = ε, k0 = 20, k1 = 100, k_ = 10, β = 10, β_ = 50.]
Fig 5
Fig 5. Cooperativity enables tuning of modes’ weights.
Comparison of the stationary PMF between non-cooperative and cooperative binding. For all cases: α/α_ = 1/200, k0/k_ = 40. (a) Diagram of the toggle switch. (b) The stationary PMF for the non-cooperative case. (c) The stationary PMF for the cooperative case with n = 2, β/β_ = 1. (d) The stationary PMF for the cooperative case β/β_ = 0.01. All surfaces are plotted using (10).
Fig 6
Fig 6
SPK lead to the emergence of a multi- modal toggle switch (a) A diagram of population of toggle switches. Arrows between blocks represent reversible diffusion reactions. Each block contains a toggle switch. The remaining subfigures show stationary PMFs for a population of three identical cooperative toggle switches. Due to the symmetries we plot joint PMFs of X1, Y1 and X1, X2 only. Subplots (b), (c) depict the uncoupled toggle switches. Note that X1 and X2 are not synchronized. Subplots (d), (e) depict a high diffusion case. The toggle switches synchronize into a multi-modal toggle switch. More details are given S1 Text §6.4.
Fig 7
Fig 7. A diagram of the repressilator.
Fig 8
Fig 8. The noncooperative repressilator oscillates.
(a) A time-series for the cooperative repressilator with cooperativity index 2, and slow promoter kinetics. (b) A time-series for the cooperative repressilator with cooperativity index 2, and fast promoter kinetics. (c) A time-series for the noncooperative repressilator, and slow promoter kinetics. (d) A time-series for the noncooperative repressilator, and fast promoter kinetics. The plots were generated by stochastic simulation via the Gillespie algorithm. For all the figures, the parameters are: α = 5ε, α_ = 1ε, k = 2000, k_ = 20, β± = 1, where ε = 0.1 for slow kinetics, and ε = 1000 for fast kinetics.
Fig 9
Fig 9. The cell-fate decision network with SPK has more modes than what a deterministic model predicts.
(a) A diagram of a generic cell-fate circuit that can describe the networks considered, (b) The PMF of the first cell-fate circuit computed using Theorem 3. (c) The PMF of the PU.1/GATA.1 circuit, where X denotes PU.1 and Y denotes GATA.1. Three modes can be seen. Details are given in S1 Text §6.5.

References

    1. Alon U. An Introduction to Systems Biology. CRC press; 2006.
    1. Karlebach G, Shamir R. Modelling and analysis of gene regulatory networks. Nature Reviews Molecular Cell Biology. 2008;9(10):770–780. 10.1038/nrm2503 - DOI - PubMed
    1. Del Vecchio D, Murray RM. Biomolecular Feedback Systems. Princeton Univ Press; 2015.
    1. Munsky B, Neuert G, van Oudenaarden A. Using gene expression noise to understand gene regulation. Science. 2012;336(6078):183–187. 10.1126/science.1216379 - DOI - PMC - PubMed
    1. Zhou JX, Huang S. Understanding gene circuits at cell-fate branch points for rational cell reprogramming. Trends in Genetics. 2011;27(2):55–62. 10.1016/j.tig.2010.11.002 - DOI - PubMed

Publication types