

A component overlapping attribute clustering (COAC) algorithm for single-cell RNA sequencing data analysis and potential pathobiological implications
- PMID: 30779739
- PMCID: PMC6396937
- DOI: 10.1371/journal.pcbi.1006772
A component overlapping attribute clustering (COAC) algorithm for single-cell RNA sequencing data analysis and potential pathobiological implications
Abstract
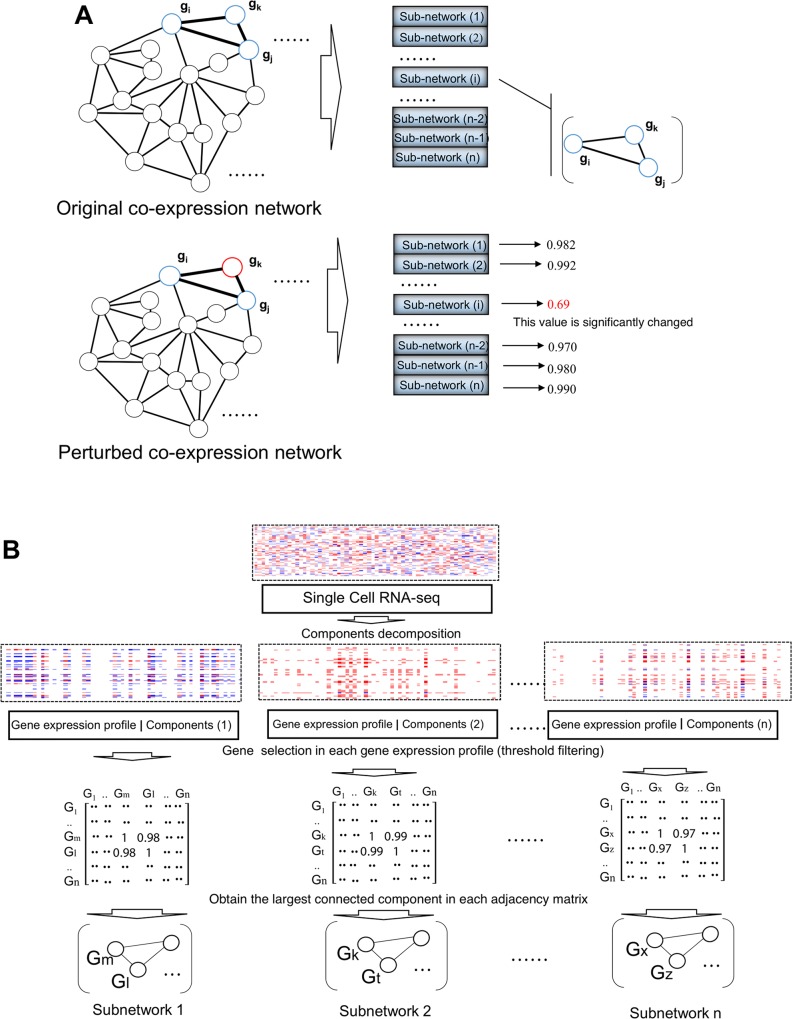
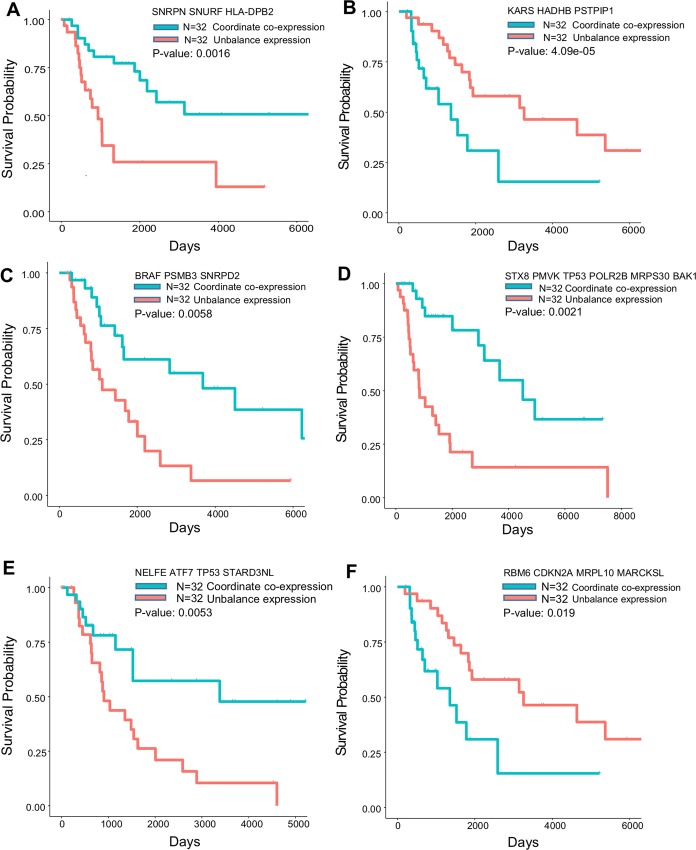
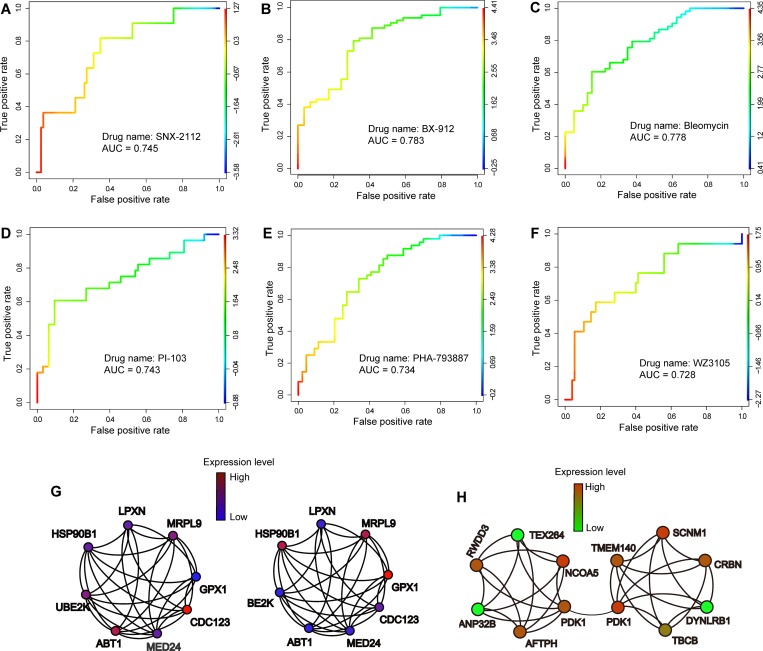
Recent advances in next-generation sequencing and computational technologies have enabled routine analysis of large-scale single-cell ribonucleic acid sequencing (scRNA-seq) data. However, scRNA-seq technologies have suffered from several technical challenges, including low mean expression levels in most genes and higher frequencies of missing data than bulk population sequencing technologies. Identifying functional gene sets and their regulatory networks that link specific cell types to human diseases and therapeutics from scRNA-seq profiles are daunting tasks. In this study, we developed a Component Overlapping Attribute Clustering (COAC) algorithm to perform the localized (cell subpopulation) gene co-expression network analysis from large-scale scRNA-seq profiles. Gene subnetworks that represent specific gene co-expression patterns are inferred from the components of a decomposed matrix of scRNA-seq profiles. We showed that single-cell gene subnetworks identified by COAC from multiple time points within cell phases can be used for cell type identification with high accuracy (83%). In addition, COAC-inferred subnetworks from melanoma patients' scRNA-seq profiles are highly correlated with survival rate from The Cancer Genome Atlas (TCGA). Moreover, the localized gene subnetworks identified by COAC from individual patients' scRNA-seq data can be used as pharmacogenomics biomarkers to predict drug responses (The area under the receiver operating characteristic curves ranges from 0.728 to 0.783) in cancer cell lines from the Genomics of Drug Sensitivity in Cancer (GDSC) database. In summary, COAC offers a powerful tool to identify potential network-based diagnostic and pharmacogenomics biomarkers from large-scale scRNA-seq profiles. COAC is freely available at https://github.com/ChengF-Lab/COAC.
Conflict of interest statement
The content of this publication does not necessarily reflect the views or policies of the Department of Health and Human Services, nor does mention of trade names, commercial products or organizations imply endorsement by the US Government. The authors have declared that no competing interests exist.
Figures
Similar articles
-
Exploring the single-cell RNA-seq analysis landscape with the scRNA-tools database.PLoS Comput Biol. 2018 Jun 25;14(6):e1006245. doi: 10.1371/journal.pcbi.1006245. eCollection 2018 Jun. PLoS Comput Biol. 2018. PMID: 29939984 Free PMC article.
-
scBGEDA: deep single-cell clustering analysis via a dual denoising autoencoder with bipartite graph ensemble clustering.Bioinformatics. 2023 Feb 14;39(2):btad075. doi: 10.1093/bioinformatics/btad075. Bioinformatics. 2023. PMID: 36734596 Free PMC article.
-
Machine learning and statistical methods for clustering single-cell RNA-sequencing data.Brief Bioinform. 2020 Jul 15;21(4):1209-1223. doi: 10.1093/bib/bbz063. Brief Bioinform. 2020. PMID: 31243426 Review.
-
scNPF: an integrative framework assisted by network propagation and network fusion for preprocessing of single-cell RNA-seq data.BMC Genomics. 2019 May 8;20(1):347. doi: 10.1186/s12864-019-5747-5. BMC Genomics. 2019. PMID: 31068142 Free PMC article.
-
Identifying cell types to interpret scRNA-seq data: how, why and more possibilities.Brief Funct Genomics. 2020 Jul 29;19(4):286-291. doi: 10.1093/bfgp/elaa003. Brief Funct Genomics. 2020. PMID: 32232401 Review.
Cited by
-
Prioritizing Autism Risk Genes using Personalized Graphical Models Estimated from Single Cell RNA-seq Data.J Am Stat Assoc. 2022;117(537):38-51. doi: 10.1080/01621459.2021.1933495. Epub 2021 Jul 21. J Am Stat Assoc. 2022. PMID: 35529781 Free PMC article.
-
Single-Cell Techniques and Deep Learning in Predicting Drug Response.Trends Pharmacol Sci. 2020 Dec;41(12):1050-1065. doi: 10.1016/j.tips.2020.10.004. Epub 2020 Nov 2. Trends Pharmacol Sci. 2020. PMID: 33153777 Free PMC article. Review.
-
Single-cell RNA-seq clustering: datasets, models, and algorithms.RNA Biol. 2020 Jun;17(6):765-783. doi: 10.1080/15476286.2020.1728961. Epub 2020 Mar 1. RNA Biol. 2020. PMID: 32116127 Free PMC article.
-
Pharmacogenomic Analysis of Combined Therapies against Glioblastoma Based on Cell Markers from Single-Cell Sequencing.Pharmaceuticals (Basel). 2023 Oct 30;16(11):1533. doi: 10.3390/ph16111533. Pharmaceuticals (Basel). 2023. PMID: 38004399 Free PMC article.
-
How can same-gene mutations promote both cancer and developmental disorders?Sci Adv. 2022 Jan 14;8(2):eabm2059. doi: 10.1126/sciadv.abm2059. Epub 2022 Jan 14. Sci Adv. 2022. PMID: 35030014 Free PMC article.
References
Publication types
MeSH terms
Substances
Grants and funding
LinkOut - more resources
Full Text Sources
Molecular Biology Databases
Miscellaneous
