. 2019 Feb 15;11(2):412.
doi: 10.3390/nu11020412.

(-)-Oleocanthal Combined with Lapatinib Treatment Synergized against HER-2 Positive Breast Cancer In Vitro and In Vivo

Affiliations

(-)-Oleocanthal Combined with Lapatinib Treatment Synergized against HER-2 Positive Breast Cancer In Vitro and In Vivo

Abu Bakar Siddique et al. Nutrients. .

Abstract

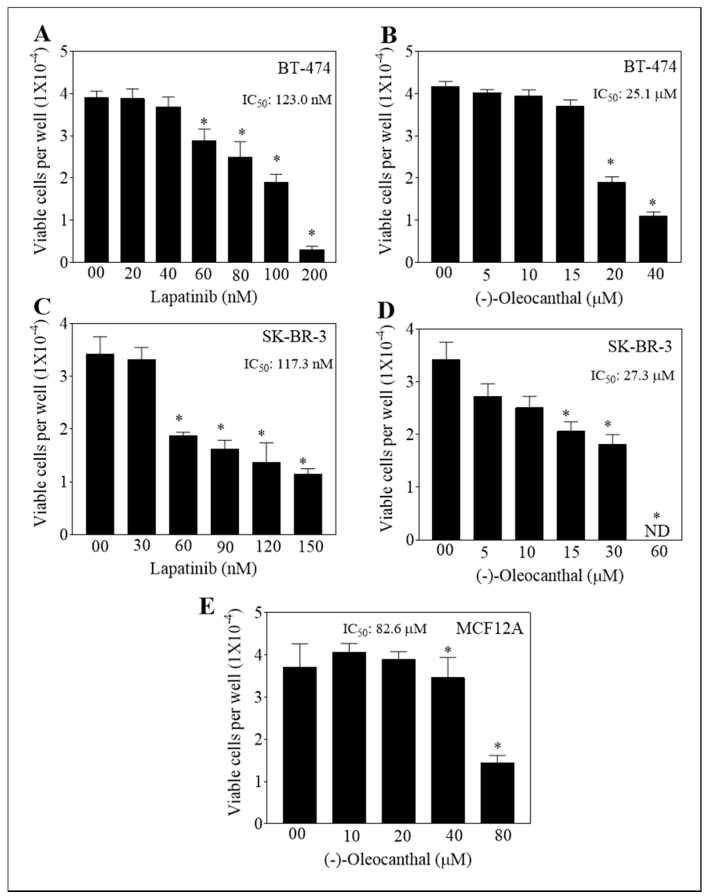
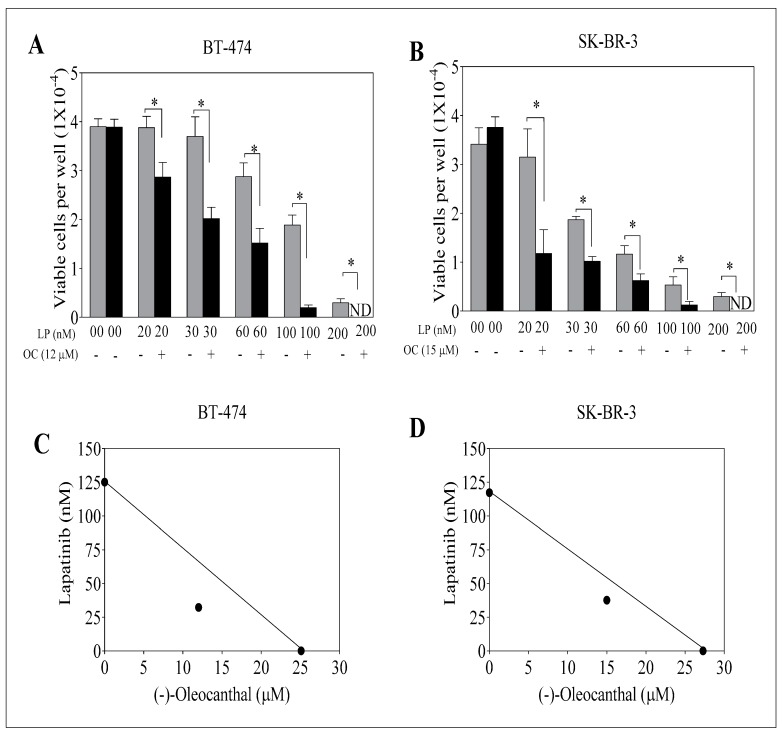
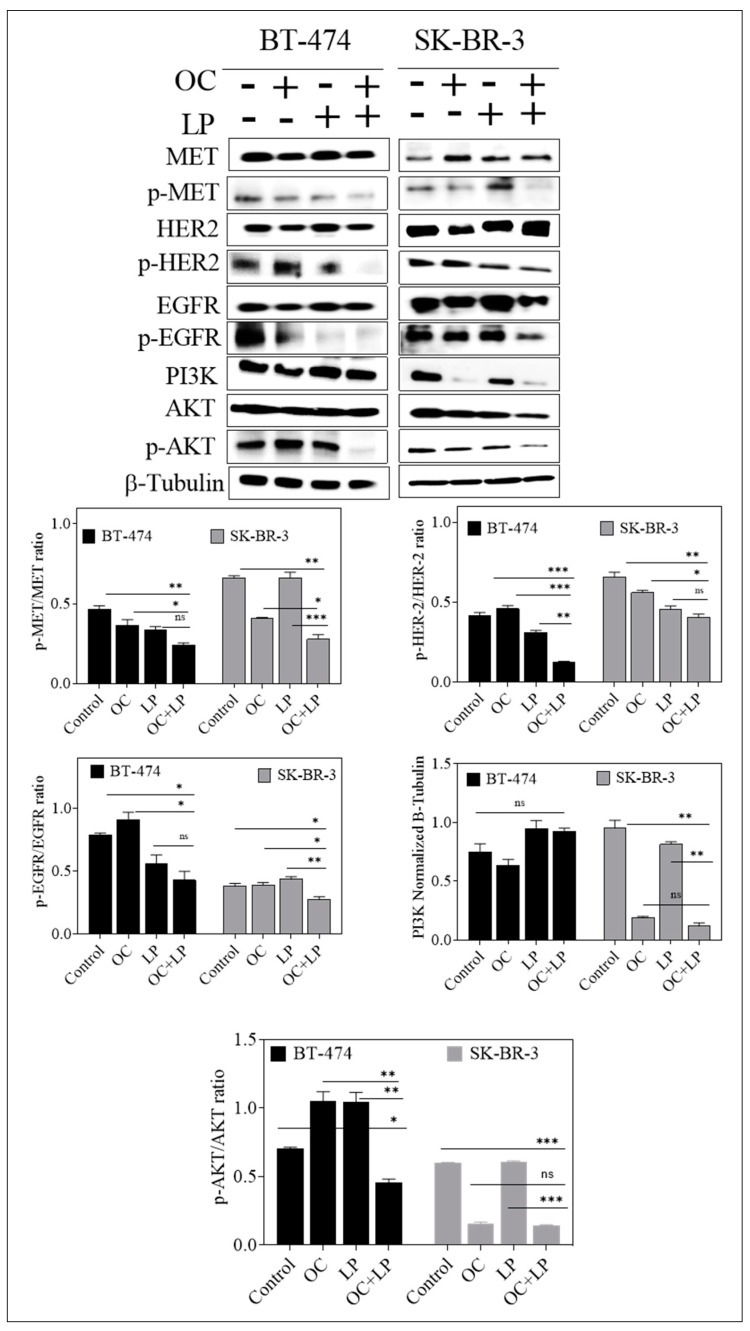
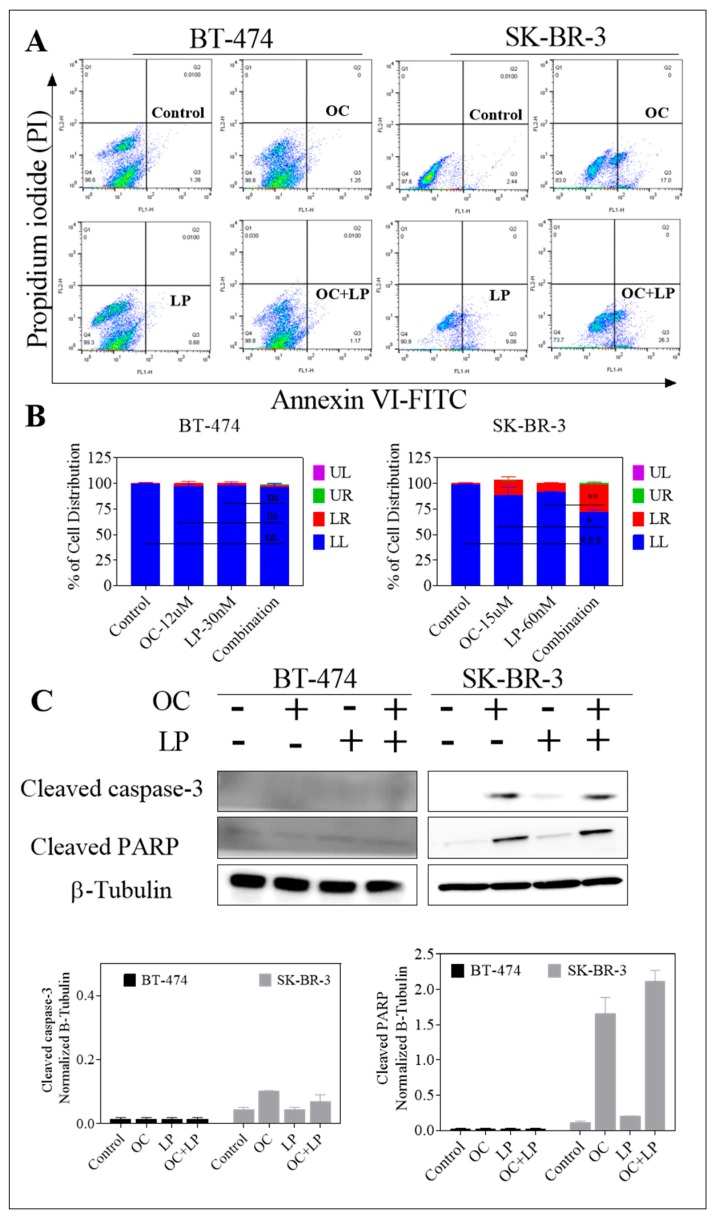
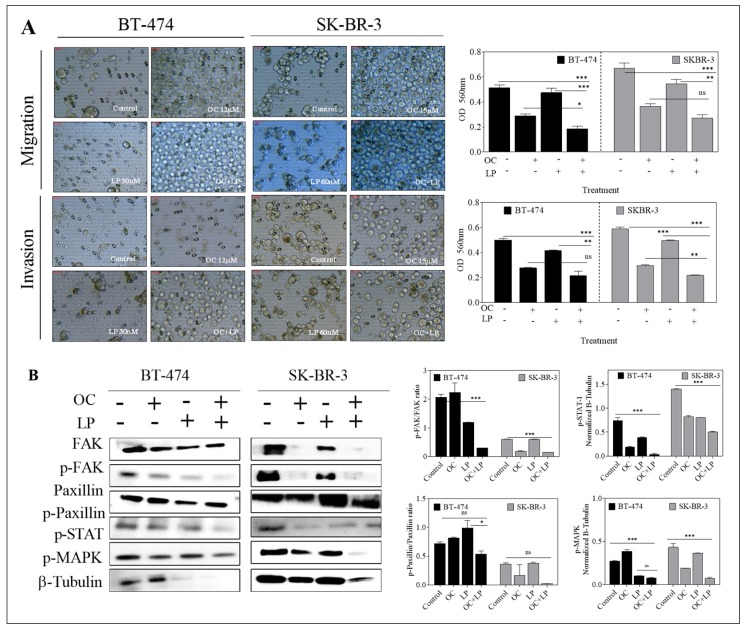
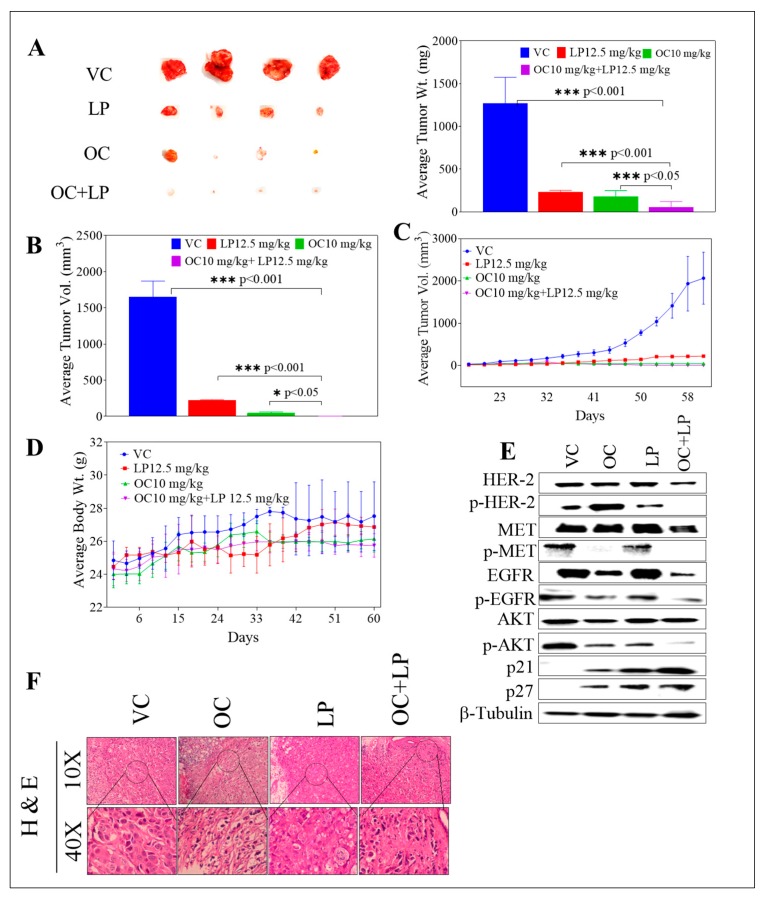
Dysregulation of epidermal growth factor receptor (EGFR)/human epidermal growth factor-2 (HER2) family is a hallmark of aggressive breast cancer. Small-molecule tyrosine kinase inhibitors are among the most effective cancer targeted treatments. (-)-Oleocanthal (OC) is a naturally occurring phenolic secoiridoid lead from extra-virgin olive oil with documented anti-cancer activities via targeting mesenchymal epithelial transition factor (c-Met). Dysregulation of c-Met promotes aggressiveness to breast cancer-targeted therapies. Lapatinib (LP) is an FDA-approved dual EGFR/HER2 inhibitor for HER2-amplified breast cancer. HER2-Positive tumor cells can escape targeted therapies like LP effects by overexpressing c-Met. Combined OC-LP treatment is hypothesized to be mechanistically synergistic against HER2-overexpressing breast cancer. Combined sub-effective treatments of OC-LP resulted in synergistic anti-proliferative effects against the HER2-positive BT-474 and SK-BR-3 breast cancer cell lines, compared to OC or LP monotherapy. Antibody array and Western blot analysis showed that combined OC-LP treatment significantly inhibited EGFR, HER2, and c-Met receptor activation, as well as multiple downstream signaling proteins, compared to individual OC or LP treatment. OC-LP Combination significantly inhibited invasion and migration of breast cancer cells through reduced activation of focal adhesion kinase (FAK) and paxillin. Combined treatment of OC-10 mg/kg with LP-12.5 mg/kg suppressed more than 90% of BT-474 tumor cells growth in a nude mouse xenograft model, compared to individual OC or LP treatment. Activated c-Met, EGFR, HER2, and protein kinase B (AKT) were significantly suppressed in combination-treated mice tumors, compared to OC or LP monotherapy. This study reveals the OC future potential as combination therapy to sensitize HER2-overexpressing breast cancers and significantly reduce required doses of targeted HER family therapeutics.

Keywords: (−)-Oleocanthal; HER2/neu; breast cancer; c-Met; combination; lapatinib.


Conflict of interest statement

K. El Sayed is a Medicinal Chemistry Chief Scientific Officer without compensation in the Shreveport, Louisiana-based Oleolive.

Figures

Figure 1
Figure 1
Effect of (−)-Oleocanthal (OC) and Lapatinib (LP) treatment on the growth of HER2-overexpressing BC cells. (A,B) Effect of LP or OC treatment on the growth of BT-474 cells after 48 h culture period. (C,D) Effect of LP or OC treatment the on growth of SK-BR-3 cells after 48 h culture period. (E) Effect of OC treatment on the growth of MCF-12A cells after 48 h culture period. In these assays, cells were plated at a density of 1 × 10⁴ cells/well in 96-well plates and maintained in media supplemented with 10 % FBS and allowed to adhere overnight. Cells then treated with vehicle-control or increasing concentrations of OC or LP in serum-free media containing hepatocyte growth factor (HGF) and Epidermar growth factor (EGF) 40 ng/mL as mitogens for 48 h. At the end of treatment, viable cell number determined by the MTT colorimetric assay. Vertical bars indicate mean cell count ± SEM (n = 6) in each treatment group. * p < 0.05 as compared with vehicle-treated controls. ND, not detectable.
Figure 2
Figure 2
Effect of combined OC and LP treatments on growth of HER2-overexpressing BC cells. (A) Effect of sub-effective OC and LP combined treatment on BT-474 cells after 48 h culture period. (B) Effect of sub-effective OC and LP combined treatment on SK-BR-3 cells after 48 h culture period. Cells were plated at a density of 1 × 10⁴ cells/well in 96-well plates and maintained in media supplemented with 10% FBS and allowed to adhere overnight. Next day, cells were treated with vehicle-control or sub-µM dose of OC or nM dose of LP either alone or combined in serum-free media containing HGF and EGF 40 ng/mL as mitogens for 48 h. At the end of treatment, viable cell number determined by the MTT colorimetric assay. Vertical bars indicate the mean cell count ± SEM (n = 6) in each treatment group. * p < 0.05 as compared with individual LP treatment. (C,D) Isobolograms of combined OC and LP anti-proliferative effect in BT-474 and SK-BR-3 cells, respectively. IC50 concentrations for OC and LP plotted on the X- and Y-axis, respectively. The solid line connecting these points represents the concentration of each compound required to induce the same relative growth inhibition when used in combination if the interaction between the compounds is additive. The data point on each isobologram represents the actual concentrations of OC and LP, which induced 50% inhibition of cell growth when used in combination. ND; not detectable.
Figure 3
Figure 3
Effect of combined OC and LP treatment on target RTKs and downstream effectors and proliferation markers in HER2-positive BC cells. Western blot analysis for the effect of combined OC and LP treatment on RTKs, and PI3K/AKT signaling pathways. Cells were plated at 1 × 10⁶ cells/100 mm culture plates in RPMI-1640 media supplemented with 10% FBS and allowed to adhere overnight. Next day, cells incubated with respective OC, LP, or combined treatment in serum-free media containing HGF and EGF 40 ng/mL as mitogens for 48 h. At the end of the treatment period, the whole cell lysates were prepared then subjected to polyacrylamide gel electrophoresis and Western blot analysis. β-Tubulin was visualized to ensure equal sample loading in each lane. Image Lab densitometric analysis performed on all blots and the integrated optical density of each band was normalized with the corresponding β-tubulin, as shown under their respective Western blot images. * p < 0.05, *** p < 0.001 as compared with either individual OC or LP treatment or vehicle treatment.
Figure 4
Figure 4
Pro-apoptotic effects of combined OC-LP treatment in HER2-positive BC cells. (A) Flow cytometry analysis for OC combined with LP treatment in BT-474 and SK-BR-3 BC cells. Cells were plated at a density of 5 × 10⁶ cells/100 mm culture plates, allowed to attach overnight. Afterwards, cells were incubated in the respective control, OC, LP, or LP-OC combination in RPMI-1640 medium containing 40 ng/mL HGF and EGF for 24 h. At the end of the experiment, cells in each treatment group were trypsinized, washed then resuspended in ice-cold 1X Annexin V binding buffer. Afterwards, cells treated as described earlier. In the dot plot of double variable flow cytometry, LL quadrant (FITC/PI) shows living cells; LR quadrant (FITC+/PI) represents early apoptotic cells; UR quadrant (FITC+/PI+) stands for late apoptotic cells and UL quadrant (FITC+/PI+) stands for necrotic cells. (B) Western blot analysis of cleaved caspase 3 and cleaved PARP performed after 24 h incubation. Cells analyzed to examine cell death by measuring cleaved caspase 3 and cleaved PARP detected by Western blotting. In all the above experiments, whole cell lysates were prepared for subsequent separation by polyacrylamide gel electrophoresis followed by Western blot analysis. Imaging and analysis performed as described earlier. * p < 0.05, *** p < 0.001 as compared with either individual OC or LP treatment or vehicle treatment.
Figure 5
Figure 5
Effect of combined OC and LP treatment on migration and invasion of HER2-positive BC cells and downstream signaling effectors. (A) Effect of OC and LP treatment on migration and invasion of BT-474 and SK-BR-3 BC cells. Optical density in migration and invasion assay in BT-474 and SK-BR-3 cells. Cells were seeded according to the manufacturer protocol and as described in “Methods”. In both assays, the provided images were taken for the upper surface of the inserts (B) Western blot analysis for the effect of combined OC and LP treatment on total and active levels of proteins controlling cell migration and invasion. Whole cell lysates were prepared for separation by polyacrylamide gel electrophoresis followed by Western blot analysis. Imaging and analysis were performed as mentioned earlier. * p < 0.05, *** p < 0.001 as compared with either individual OC or LP treatment or vehicle treatment. ns, not statistically significant.
Figure 6
Figure 6
Effect of OC-LP combination treatment on tumor growth in BT-474 BC cells xenograft model. (A) Left panel. Representative isolated mice tumors of each experimental group collected at end of the experiment. Top row is the vehicle-treated control group, then the 12.5 mg/kg LP, oral, 5X/week, the 10 mg/kg OC, ip, 3X/week, and finally the bottom row represents the combined 10 mg/kg OC, ip, 3X/week −12.5 mg/kg LP, oral, 5X/week-treated group. Right panel. The mean tumor weight at the end of the experiment vertical bars graph. (B) The mean tumor volume at the end of the experiment vertical bars graph. The tumor volume (V) was calculated as V = (L × W2)/2, where L was the length and W was the width of tumors. Bars ± SEM. *** p < 0.001 as compared with either individual OC or LP treatment or vehicle treatments. (C) Tumor volumes monitoring over the course of the experiment. Points represent the mean tumor volume of several tumors (n = 5) in each experimental group over the treatment period. Error bars indicate SEM for n = 5. (D) Body weight monitoring of mice over the experiment course. Points represent mean body weight for animals in each group (n = 5) over the experiment duration. Error bars indicate SEM for n = 5. (E) Western blot analysis of various experimental groups for the total and active levels of study target RTKs and their downstream signaling proteins. (F) H&E staining of tumor samples in different study groups. Human BC cells BT-474 cultured and suspended in serum-free RPMI medium with (30:30) µL Matrigel. Cell suspensions (5 × 10⁶ cells/60 µL) subcutaneously inoculated into the second mammary gland fat pad just beneath the nipple of each athymic nude mouse to generate orthotropic breast tumor xenografts. One day before tumor cells inoculation, a 0.72-mg 60-day release 17β-estradiol pellet (Innovative Research) surgically implanted into the interscapular region of each mouse. Once the tumor is palpable, ~35 mm3 volume around the 14th day, mice were randomly divided into four groups, n = 5 each: (i) The vehicle-treated control group; (ii) the 10.0 mg/kg OC-treated group; (iii) the 12.5 mg/kg LP-treated group; and (iv) the OC 10.0 mg/kg plus LP 12.5 mg/kg—treated group. Oral treatments, vehicle control (DMSO/saline), OC, LP, and OC-LP combination, started 14 days post-inoculation and continued until the 60th day.

Similar articles

Cited by

References

    1. Konecny G.E., Pegram M.D., Venkatesan N., Finn R., Yang G., Rahmeh M., Untch M., Rusnak D.W., Spehar G., Mullin R.J., et al. Activity of the dual kinase inhibitor lapatinib (GW572016) against HER-2-overexpressing and trastuzumab-treated breast cancer cells. Cancer Res. 2006;66:1630–1639. doi: 10.1158/0008-5472.CAN-05-1182. - DOI - PubMed
    1. Slamon D.J., Clark G.M., Wong S.G., Levin W.J., Ullrich A., McGuire W.L. Human breast cancer: Correlation of relapse and survival with amplification of the HER-2/neu oncogene. Science. 1987;235:177–182. doi: 10.1126/science.3798106. - DOI - PubMed
    1. Liu X., Abdelrahim M., Abudayyeh A., Lei P., Safe S. The nonsteroidal anti-inflammatory drug tolfenamic acid inhibits BT474 and SKBR3 breast cancer cells and tumor growth by repressing erbB2 expression. Mol. Cancer Ther. 2009;8:1207–1217. doi: 10.1158/1535-7163.MCT-08-1097. - DOI - PMC - PubMed
    1. Burstein H.J. The distinctive nature of HER2-positive breast cancers. N. Engl. J. Med. 2005;353:1652–1654. doi: 10.1056/NEJMp058197. - DOI - PubMed
    1. Mitri Z., Constantine T., O’Regan R. The HER2 receptor in breast cancer: Pathophysiology, clinical use, and new advances in therapy. Chemother. Res. Pract. 2012;2012:743193. doi: 10.1155/2012/743193. - DOI - PMC - PubMed

MeSH terms