. 2019 Feb 16;11(2):162.
doi: 10.3390/v11020162.

Integrated MicroRNA and mRNA Profiling in Zika Virus-Infected Neurons

Affiliations

Integrated MicroRNA and mRNA Profiling in Zika Virus-Infected Neurons

Francine Azouz et al. Viruses. .

Abstract

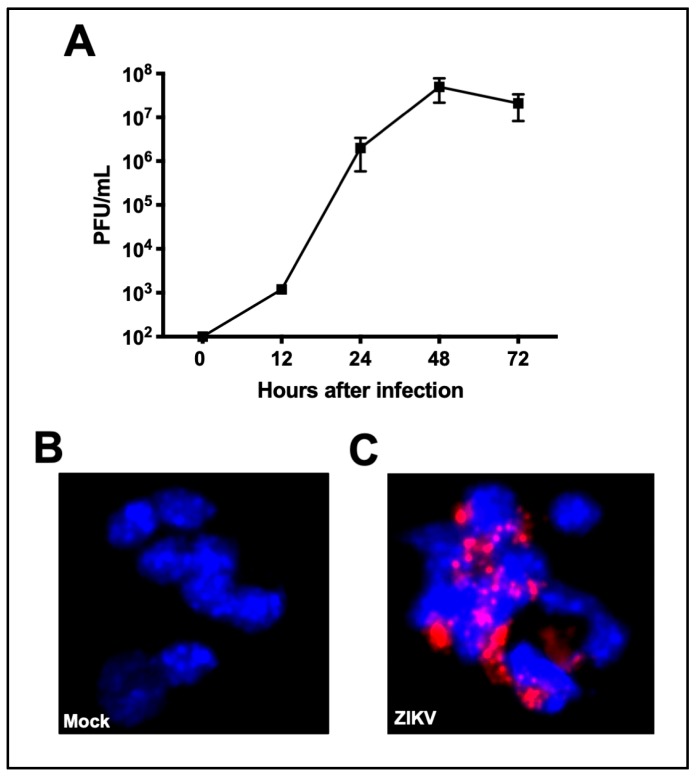
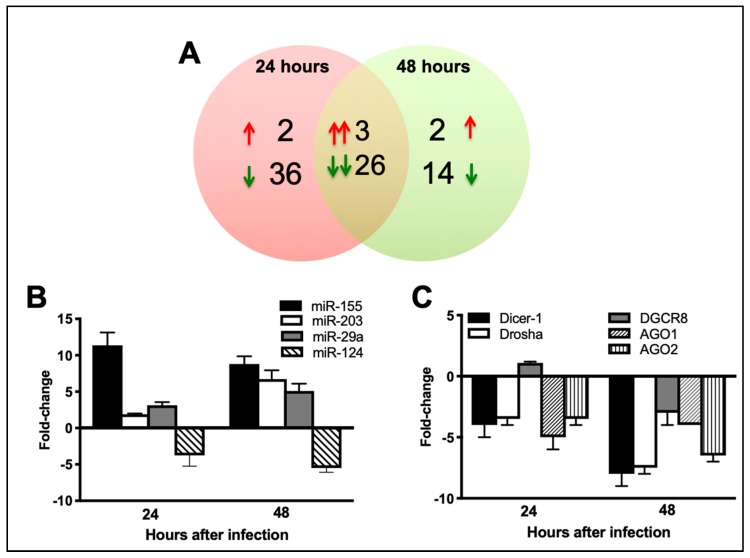
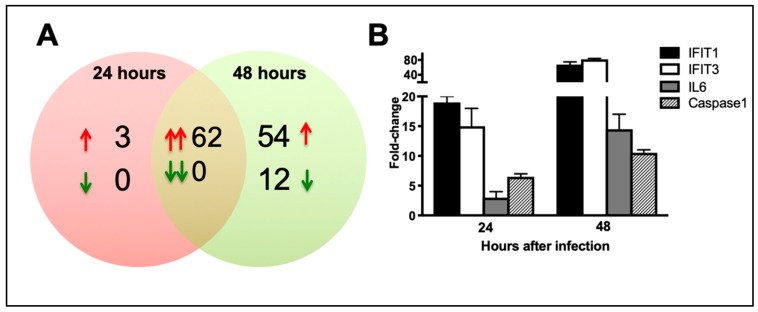
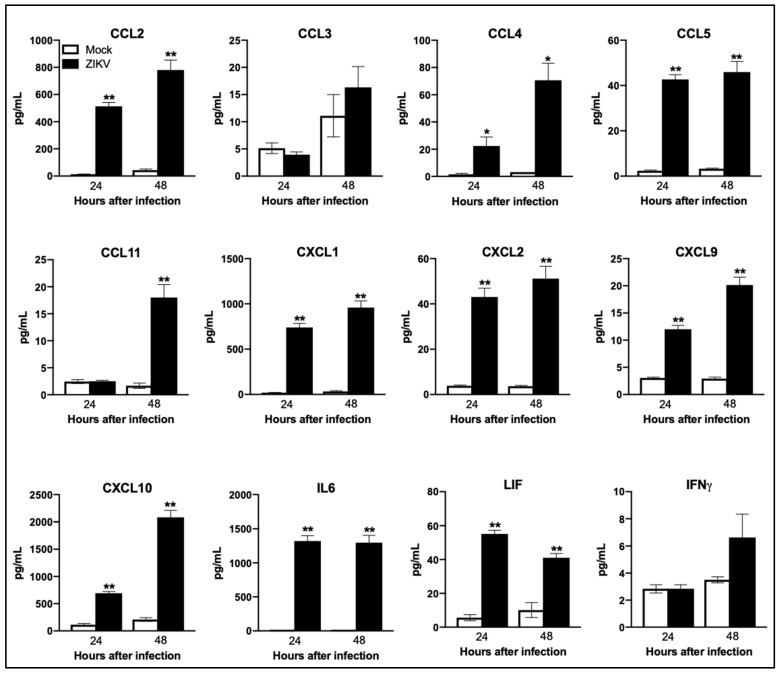
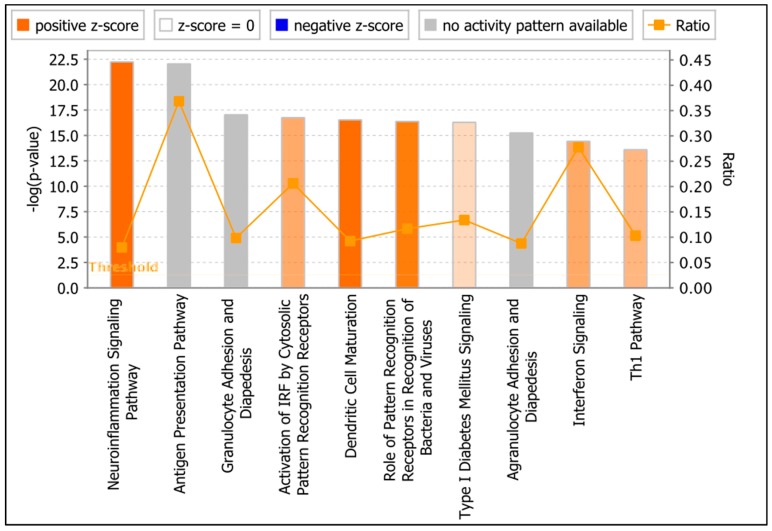
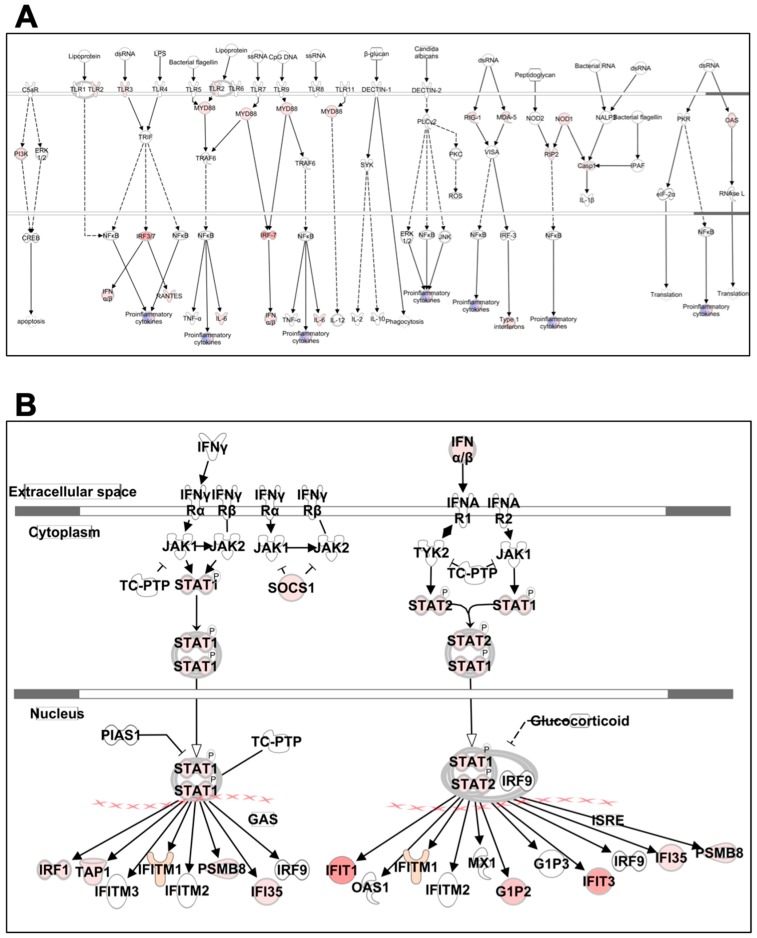
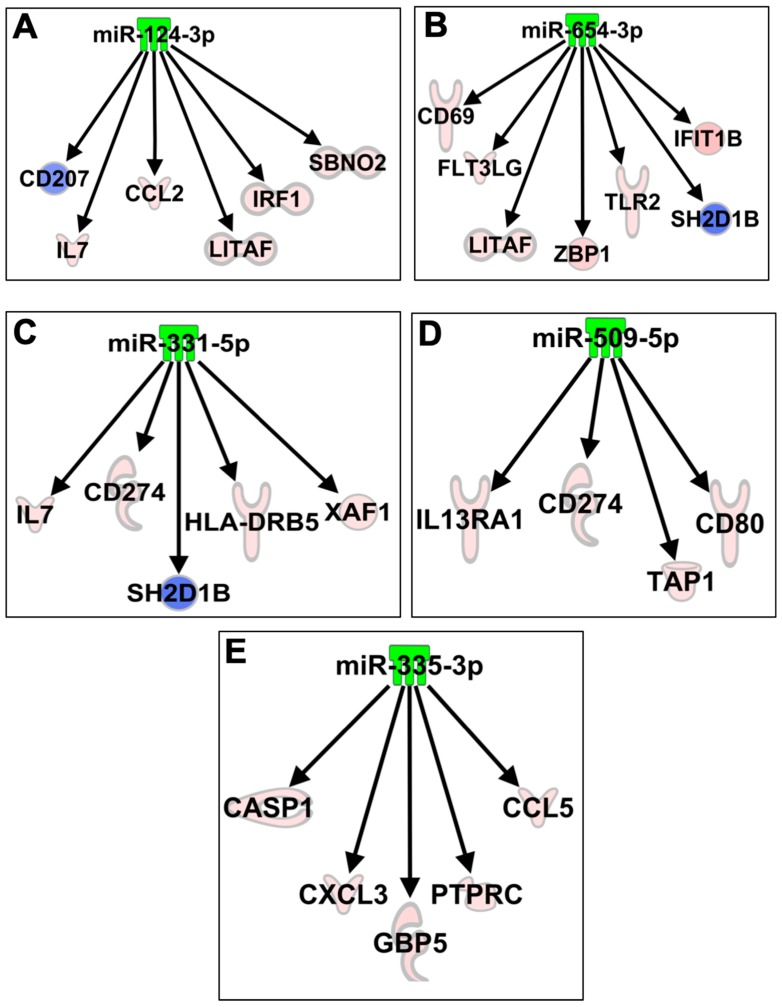
Zika virus (ZIKV) infections have caused a wide spectrum of neurological diseases, such as Guillain-Barré syndrome, myelitis, meningoencephalitis, and congenital microcephaly. No effective therapies currently exist for treating patients infected with ZIKV. MicroRNAs (miRNAs) are a group of small RNAs involved in the regulation of a wide variety of cellular and physiological processes. In this study, we analyzed digital miRNA and mRNA profiles in ZIKV-infected primary mouse neurons using the nCounter technology. A total of 599 miRNAs and 770 mRNAs were examined. We demonstrate that ZIKV infection causes global downregulation of miRNAs with only few upregulated miRNAs. ZIKV-modulated miRNAs including miR-155, miR-203, miR-29a, and miR-124-3p are known to play critical role in flavivirus infection, anti-viral immunity and brain injury. ZIKV infection also results in downregulation of miRNA processing enzymes. In contrast, ZIKV infection induces dramatic upregulation of anti-viral, inflammatory and apoptotic genes. Furthermore, our data demonstrate an inverse correlation between ZIKV-modulated miRNAs and target host mRNAs induced by ZIKV. Biofunctional analysis revealed that ZIKV-modulated miRNAs and mRNAs regulate the pathways related to neurological development and neuroinflammatory responses. Functional studies targeting specific miRNA are warranted to develop therapeutics for the management of ZIKV neurological disease.

Keywords: Zika virus; anti-viral immunity; flavivirus; microRNAs; neuroinflammation; neurons.


Conflict of interest statement

The authors declare no conflict of interest.

Figures

Figure 1
Figure 1
Zika virus (ZIKV) infection of the primary mouse neurons. Mouse cortical neuron cultures were prepared from one-day old pups. Neurons were infected with ZIKV (PRVABC59 strain) or PBS (Mock) at multiplicity of infection (MOI)-1. (A) ZIKV titers in culture supernatant were determined by plaque assay. Viral titers are expressed as plaque forming units (PFU)/mL of supernatant. Data represents the mean ± SEM. Neurons grown and fixed on coverslips at 48 h after infection were stained with anti-dsRNA antibody (red) and counterstained with DAPI (blue). (B) Mock-infected cells. 20× magnification. (C) ZIKV-infected cells demonstrate robust virus staining in the cytoplasm. 20× magnification.
Figure 2
Figure 2
ZIKV infection of the primary mouse neurons causes changes in cellular miRNA expression. Neurons were infected with ZIKV (PRVABC59 strain) or PBS (Mock) at MOI-1. (A) Venn diagram showing the number of differentially expressed miRNAs at 24 and 48 h after infection. Sets of upregulated miRNAs are represented by upward red arrows and sets of downregulated miRNAs are represented by downward green arrows. Pairs of arrows in the intersection refer to the number of miRNAs upregulated (double red arrows) or down regulated (double green arrows) at both 24 and 48 h after infection. (B) qRT-PCR was conducted on RNA extracted from mock and ZIKV-infected neurons to determine fold-change in miR-155, miR-203, miR-29a, and miR-124-3p expression. Changes in the levels of each miRNA were first normalized to the snoRNA and then the fold-change in ZIKV-infected cells was calculated in comparison to corresponding mock-infected cells. Data represents the mean ± SEM. (C) qRT-PCR was conducted on RNA extracted from mock and ZIKV-infected neurons to determine fold-change in Dicer-1, Drosha, DGCR8, AGO1, and AGO2 expression. Changes in the levels of each mRNA were first normalized to the β-actin and then the fold-change in ZIKV-infected cells was calculated in comparison to corresponding mock-infected cells. Data represents the mean ± SEM.
Figure 3
Figure 3
ZIKV infection of the primary mouse neurons causes changes in cellular mRNA expression. Neurons were infected with ZIKV (PRVABC59 strain) or PBS (Mock) at MOI-1. (A) Venn diagram showing the number of differentially expressed mRNAs at 24 and 48 h after infection. Sets of upregulated mRNAs are represented by upward red arrows and sets of downregulated mRNAs are represented by downward green arrows. Pairs of arrows in the intersection refer to the number of mRNAs upregulated (double red arrows) or down regulated (double green arrows) at both 24 and 48 h after infection. (B) qRT-PCR was conducted on RNA extracted from mock and ZIKV-infected neurons to determine fold-change in IFIT1, IFIT3, IL6, and Caspase1 expression. Changes in the levels of each mRNA were first normalized to the β-actin and then the fold-change in ZIKV-infected cells was calculated in comparison to corresponding mock-infected cells. Data represents the mean ± SEM.
Figure 4
Figure 4
Enhanced production of cytokines and chemokines in ZIKV-infected neurons. Mouse cortical neuron cultures were infected with ZIKV (PRVABC59 strain) or PBS (Mock) at MOI-1 and supernatants were collected at 24 and 48 h after infection. Levels of chemokines and cytokines as noted in the figure were measured in cell supernatants using multiplex immunoassay and are expressed as the mean concentration (pg/mL) ± SEM. *p < 0.05, **p < 0.001.
Figure 5
Figure 5
Core functional pathway analysis of ZIKV-modulated mRNAs using IPA. Top canonical signaling pathways regulated by significantly modulated mRNAs. Threshold bar indicates cut-off point of significance p < 0.05, using Fisher’s exact test. Range of activation z-score is also depicted in the figure. The color of the bars indicates predicted pathway activation based on z-score (orange = activation; blue = inhibition; gray = no prediction can be made; white = z-score close to 0). Orange line represents the ratio = number of genes in dataset/total number of genes that compose that pathway.
Figure 6
Figure 6
Pathway analysis for PRR and IFN signaling. Genes associated with (A) PRR and (B) IFN signaling activated by ZIKV infection are shown. Differentially expressed mRNAs are highlighted in color. Color intensity indicates the degree of upregulation (red) relative to the mock-infected neurons. Solid lines represent direct interactions and dashed lines indirect interactions. Shading intensity indicates the degree that each mRNA was upregulated.
Figure 7
Figure 7
Networks of the interactions of the miRNA target genes. IPA tool was used to generate the miRNA-mRNA interaction network of (A) miR-124-3p, (B) miR-654-3p, (C) miR-331-5p, (D) miR-509-5p, and (E) miR-335-3p and mRNAs significantly modulated in neurons after ZIKV infection. Red (increased expression) and green (decreased expression).

Similar articles

Cited by

References

    1. Musso D., Gubler D.J. Zika virus. Clin. Microbiol. Rev. 2016;29:487–524. doi: 10.1128/CMR.00072-15. - DOI - PMC - PubMed
    1. Klase Z.A., Khakhina S., Schneider Ade B., Callahan M.V., Glasspool-Malone J., Malone R. Zika fetal neuropathogenesis: Etiology of a viral syndrome. PLoS Negl. Trop. Dis. 2016;10:e0004877. doi: 10.1371/journal.pntd.0004877. - DOI - PMC - PubMed
    1. Cao-Lormeau V.M., Blake A., Mons S., Lastere S., Roche C., Vanhomwegen J., Dub T., Baudouin L., Teissier A., Larre P., et al. Guillain-Barré syndrome outbreak associated with zika virus infection in french polynesia: A case-control study. Lancet. 2016;387:1531–1539. doi: 10.1016/S0140-6736(16)00562-6. - DOI - PMC - PubMed
    1. Tang H., Hammack C., Ogden S.C., Wen Z., Qian X., Li Y., Yao B., Shin J., Zhang F., Lee E.M., et al. Zika virus infects human cortical neural progenitors and attenuates their growth. Cell Stem Cell. 2016;18:587–590. doi: 10.1016/j.stem.2016.02.016. - DOI - PMC - PubMed
    1. Anfasa F., Siegers J.Y., van der Kroeg M., Mumtaz N., Stalin Raj V., de Vrij F.M.S., Widagdo W., Gabriel G., Salinas S., Simonin Y., et al. Phenotypic differences between asian and african lineage zika viruses in human neural progenitor cells. mSphere. 2017;2 doi: 10.1128/mSphere.00292-17. - DOI - PMC - PubMed

Publication types