. 2019 Feb 18;8(2):171.
doi: 10.3390/cells8020171.

RHOG Activates RAC1 through CDC42 Leading to Tube Formation in Vascular Endothelial Cells

Affiliations

RHOG Activates RAC1 through CDC42 Leading to Tube Formation in Vascular Endothelial Cells

Oula El Atat et al. Cells. .

Abstract

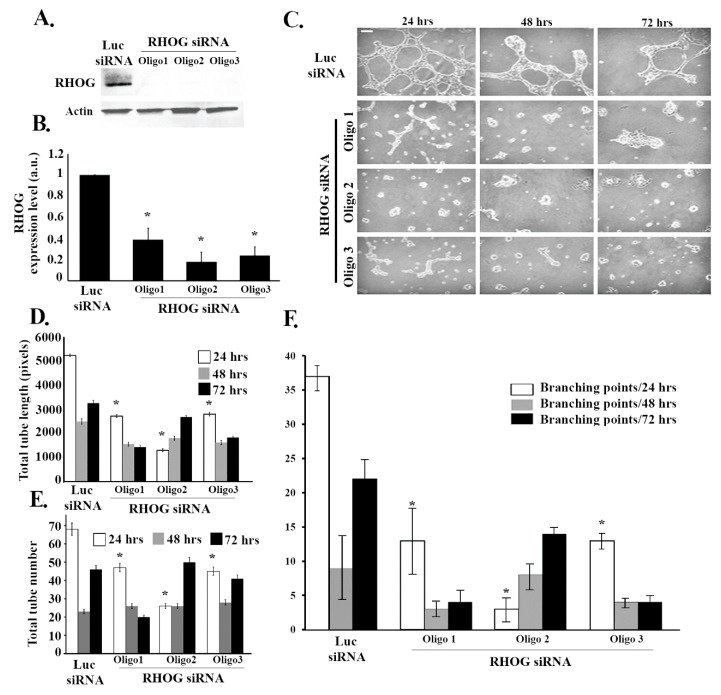
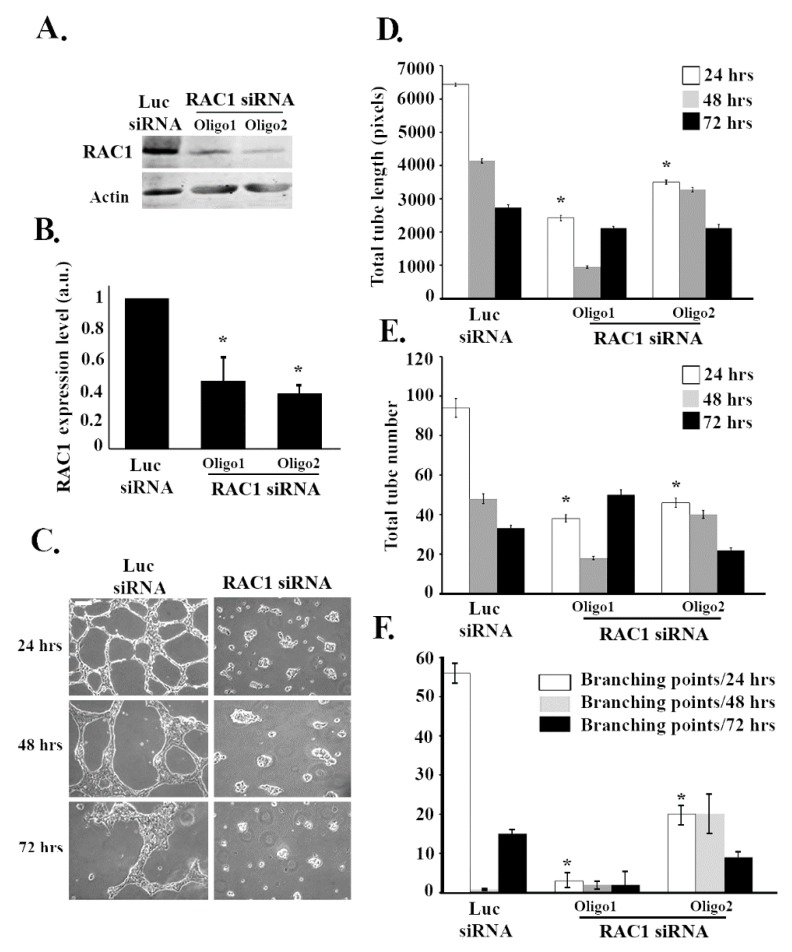
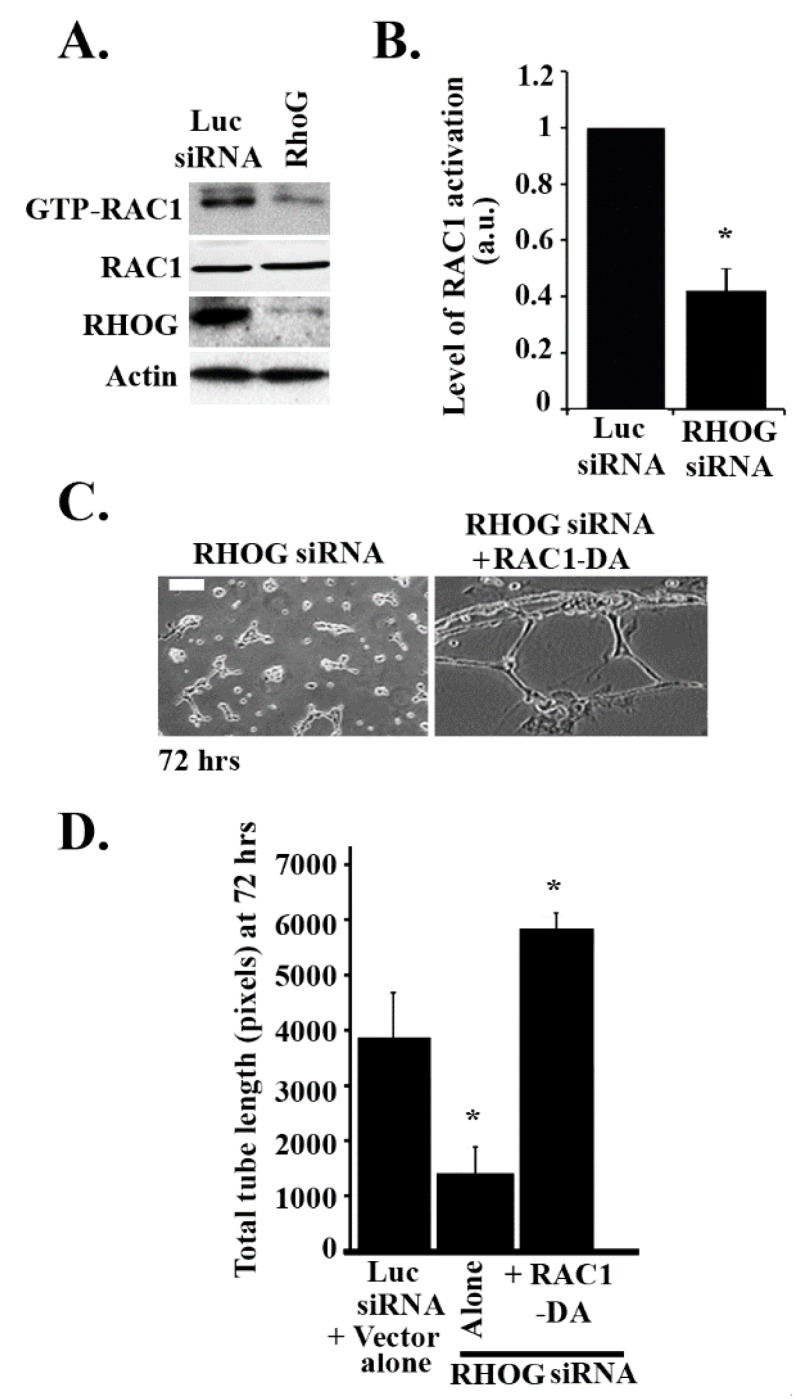
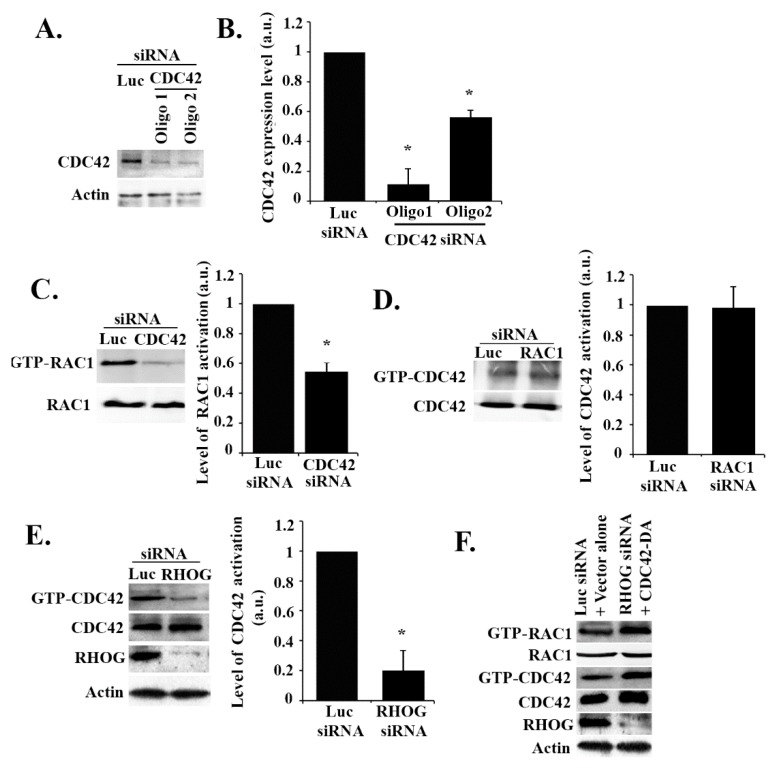
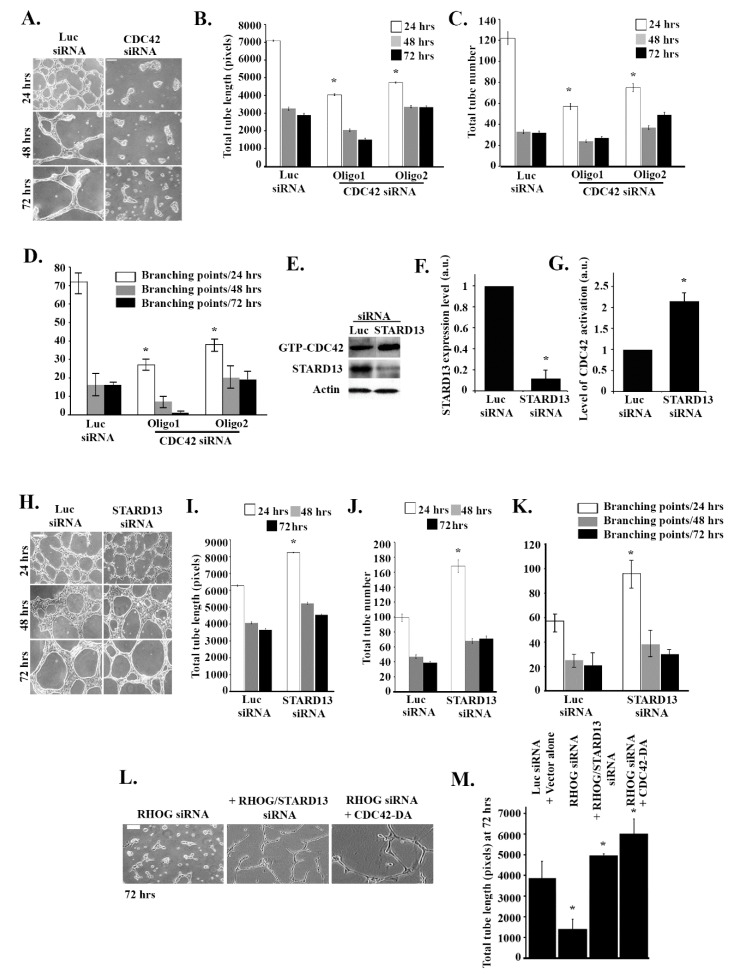
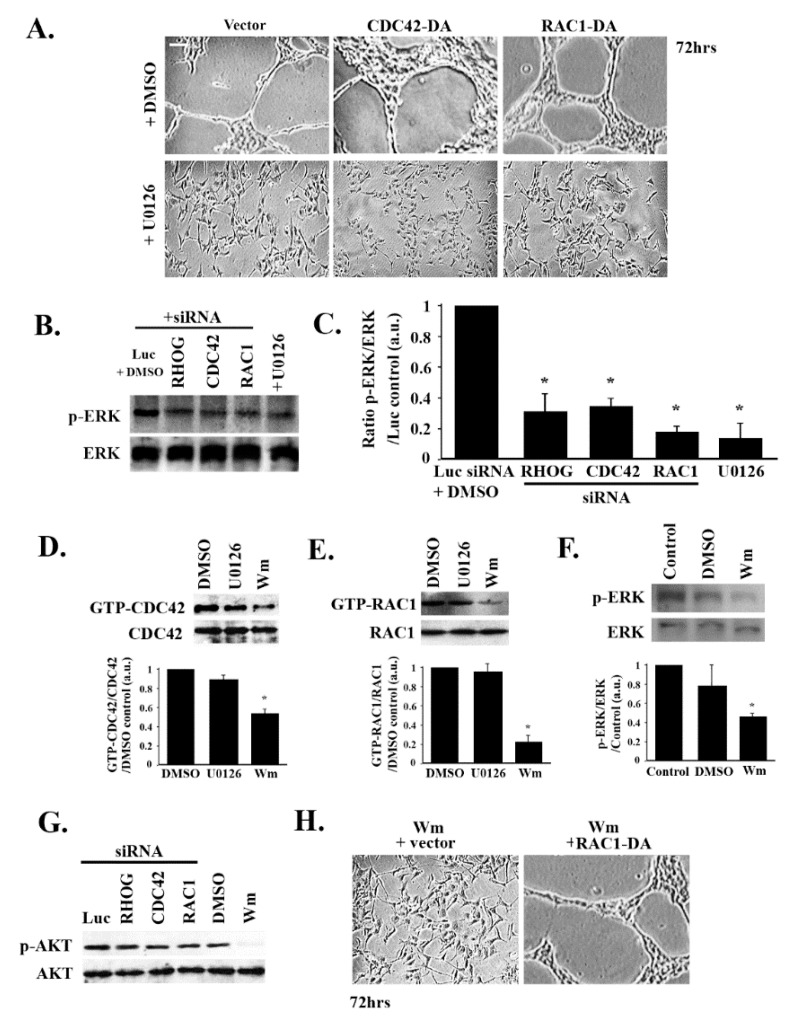
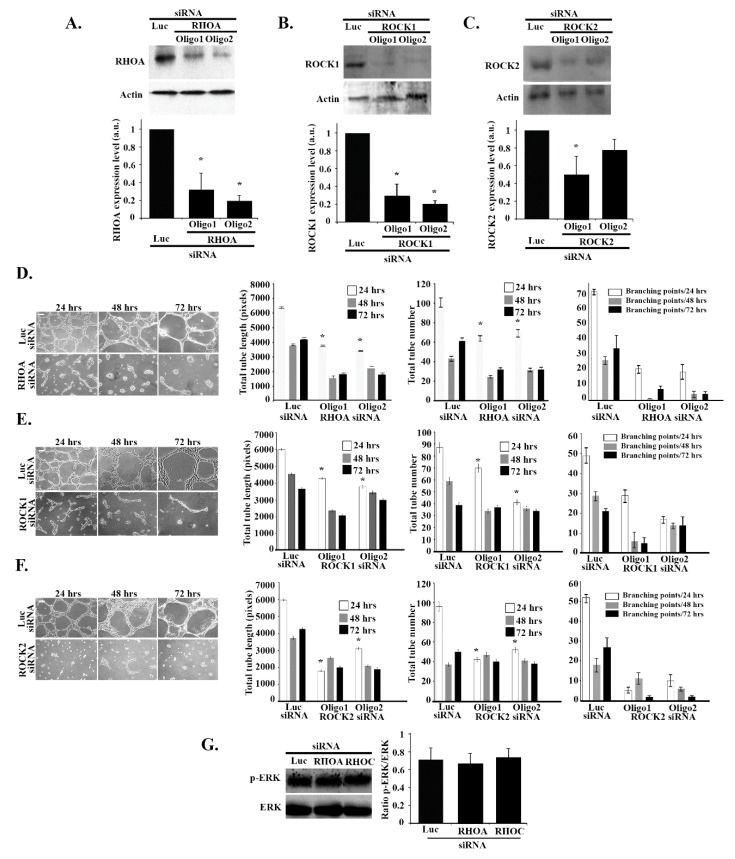
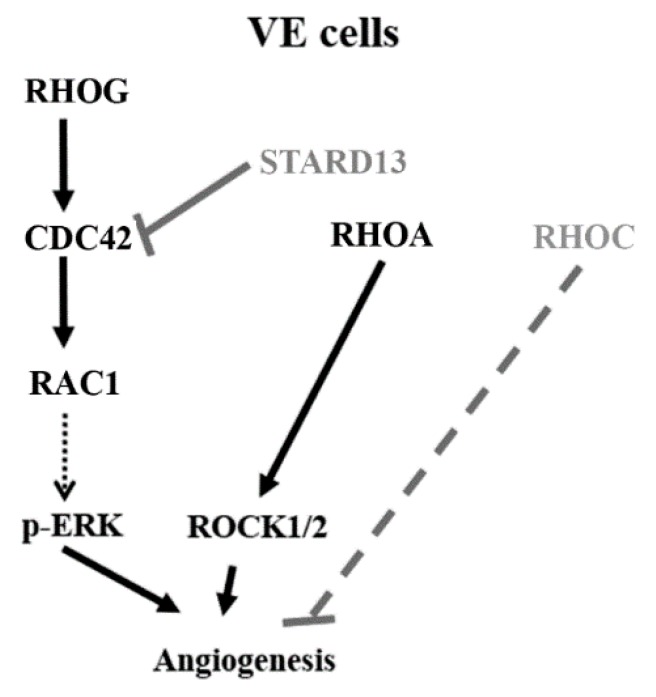
Angiogenesis is a hallmark of cancer cell malignancy. The role of the RHO family GTPase RHOG in angiogenesis in vascular endothelial cells has recently been elucidated. However, the regulation of RHOG during this process, as well as its cross-talk with other RHO GTPases, have yet to be fully examined. In this study, we found that siRNA-mediated depletion of RHOG strongly inhibits tube formation in vascular endothelial cells (ECV cells), an effect reversed by transfecting dominant active constructs of CDC42 or RAC1 in the RHOG-depleted cells. We also found CDC42 to be upstream from RAC1 in these cells. Inhibiting either Phosphatidyl inositol (3) kinase (PI3K) with Wortmannin or the mitogen-activated protein kinase extracellular-regulated kinase (MAPK ERK) with U0126 leads to the inhibition of tube formation. While knocking down either RHO, GTPase did not affect p-AKT levels, and p-ERK decreased in response to the knocking down of RHOG, CDC42 or RAC1. Recovering active RHO GTPases in U0126-treated cells also did not reverse the inhibition of tube formation, placing ERK downstream from PI3K-RHOG-CDC42-RAC1 in vascular endothelial cells. Finally, RHOA and the Rho activated protein kinases ROCK1 and ROCK2 positively regulated tube formation independently of ERK, while RHOC seemed to inhibit the process. Collectively, our data confirmed the essential role of RHOG in angiogenesis, shedding light on a potential new therapeutic target for cancer malignancy and metastasis.

Keywords: CDC42; RAC1; RHO GTPases; RHOG; angiogenesis; vascular endothelial cells.


Conflict of interest statement

The authors declare no conflict of interest.

Figures

Figure 1
Figure 1
RHOG positively regulates tube formation in ECV cells. ECV cells were transfected with luciferase control siRNA or with RHOG siRNA. Three different siRNA oligos against RHOG were used in each experiment. (A) The cells were lysed and immunoblotted using Western blot analysis for RHOG (upper gel) or for actin (lower gel) for the loading control. (B) Western blot bands were quantified using imageJ and normalized to the number of total proteins and expressed as fold decreases from the luciferase control. Data are the mean ± SEM of three independent experiments. * p < 0.05 indicates statistically significant differences. (C) Representative images of the tube formation assay on the growth factor-reduced Matrigel by ECV at 24, 48, and 72 h after plating. (DF) Quantitation of (C) for the total tube length, total tube number, and the number of branching points, respectively. Data are the mean ± SEM of three independent experiments. * p < 0.05 indicates statistically significant differences with the luciferase control. The scale bar is 100 μm.
Figure 2
Figure 2
RAC1 positively regulates tube formation in ECV cells. ECV cells were transfected with the luciferase control siRNA or with RAC1 siRNA. Two different siRNA oligos against RAC1 were used in each experiment. (A) The cells were lysed and immunoblotted using Western blot analysis for RAC1 (upper gel) or for actin (lower gel) for the loading control. (B) Western blot bands were quantified using imageJ and normalized to the number of total proteins and expressed as fold decreases from the luciferase control. Data are the mean ± SEM of three independent experiments. * p < 0.05 indicates statistically significant differences. (C) Representative images of the tube formation assay on the growth factor-reduced Matrigel by ECV after 24, 48, and 72 h after plating. (DF) Quantitation of (C) for the total tube length, total tube number, and the number of branching points, respectively. Data are the mean ± SEM of three independent experiments. * p < 0.05 indicates statistically significant differences with the luciferase control. The scale bar is 100 μm.
Figure 3
Figure 3
RHOG activates RAC1 leading to tube formation in ECV cells. (A) Cells were transfected with either luciferase or RHOG siRNA. Cells were then lysed and incubated with GST-CRIB (CDC42 and RAC interactive binding domain) to pull down the active RAC1. Samples from the pull-down as well as the total lysates were blotted against RAC1. The lower 2 gels are Western blots for RHOG for the knockdown control and actin for the loading control. (B) Quantitation of GTP-RAC1 from (A) normalized to total RAC1 and expressed as a fold decrease from the luciferase control. Data are the mean ± SEM of three independent experiments. * p < 0.05 indicates statistically significant differences. (C) Representative images of the tube formation assay (72 h) of ECV cells treated with RHOG siRNA (left) or RHOG siRNA/RAC1-DA (right). The scale bar is 100 μm. (D) Quantitation of (C) for the total tube length with the luciferase siRNA/vector alone as a control. The data are the mean ± SEM of three independent experiments. * p < 0.05 indicates statistically significant differences.
Figure 4
Figure 4
RHOG activates CDC42 which activates RAC1 in ECV cells. (A) Cells were transfected with either the luciferase control or CDC42 siRNA (2 oligos). The cells were then lysed, and the samples blotted with anti-CDC42 antibody. (B) Quantitation of (A) (knockdown efficiency) normalized to actin and expressed as a fold decrease compared to the luciferase control. Data are the mean ± SEM of three independent experiments. * p < 0.05 indicates statistically significant differences. (C) Cells were transfected with either luciferase or CDC42 siRNA (as in A), lysed, and incubated with GST-CRIB to pull down active RAC1. Samples, as well as total lysates (lower gel), were then blotted with RAC1 antibody. The graph is a quantitation of the gel to the total RAC1 and is expressed as a fold decrease compared to the luciferase control. The data are the mean ± SEM of three independent experiments. * p < 0.05 indicates statistically significant differences. (D) Cells were transfected with either luciferase or RAC1 siRNA lysed and incubated with GST-CRIB to pull down active CDC42. Samples, as well as total lysates (lower gel), were then blotted with the CDC42 antibody. The graph is a quantitation of the gel to total CDC42 and expressed as a fold decrease compared to the luciferase control. Data are the mean ± SEM of three independent experiments. * p < 0.05 indicates statistically significant differences. (E) Cells were transfected with either luciferase or RHOG siRNA lysed and incubated with GST-CRIB to pull down active CDC42. Samples were then blotted with anti-CDC42 and total lysates with anti-CDC42, anti-RHOG (for knockdown efficiency), and anti-actin (for loading control). The graph is a quantitation of GTP-CDC42 ratioed to total CDC42 and expressed as fold decrease compared to luciferase control. Data are the mean ± SEM of three independent experiments. * p < 0.05 indicates statistically significant differences. (F) Cells were transfected with either luciferase control and vector alone or with RHOG siRNA and CDC42-DA. Then, cells were lysed and incubated with GST-CRIB (CDC42 and RAC1 interactive binding domain) (GTP-RAC1 and GTP-CDC42 gels) to pull down active CDC42 and RAC1. Samples were then blotted with RAC1 and CDC42 antibodies. Total cell lysates were also blotted with RAC1, CDC42 antibodies. The lower 2 gels are Western blots for RHOG and actin for knockdown efficiency.
Figure 5
Figure 5
RHOG stimulates tube formation through CDC42 and RAC1. ECV-cells were transfected with the luciferase control, CDC42 (2 oligos) or STARD13 siRNA and plated on growth factor-reduced Matrigel by ECV for 24, 48, or 72 h. (A) Representative images of tube formation assay for the luciferase control and the CDC42 knockdown cells at 24, 48, and 72 h after plating. The scale bar is 100 μm. (BD) Quantitation of (A) for the total tube length, total tube number, and the number of branching points, respectively. Data are the mean ± SEM of three independent experiments. * p < 0.05 indicates statistically significant differences with the luciferase control. (E) Cells were transfected with either luciferase or STARD13 siRNA, and cells were then lysed and incubated with GST-CRIB to pull down active CDC42. The samples were then blotted with CDC42 antibody. Total cell lysates were also blotted with STARD13 for knockdown efficiency and actin for the loading control. (F) Quantitation of STARD13 expression (cells −/+ STARD13 siRNA) in the Western blot bands from (E) normalized to actin (lowest gel) and expressed as a fold change. Data are the mean ± SEM of three independent experiments. * p < 0.05 indicates statistically significant differences. (G) Quantitation of GTP-CDC42 from (E) normalized to total CDC42 and expressed as a fold change from the luciferase control. Data are the mean ± SEM of three independent experiments. * p < 0.05 indicates statistically significant differences. (H) Representative images of the tube formation assay for the luciferase control and the STARD13 knockdown cells at 24, 48, and 72 h after plating. The scale bar is 100 μm. (IK) Quantitation of (H) for the total tube length, total tube number, and the number of branching points, respectively. Data are the mean ± SEM of three independent experiments. * p < 0.05 indicates statistically significant differences with the luciferase control. (L) Representative images of tube formation assay (72 h) of ECV cells treated with RHOG siRNA (left), RHOG/STARD13 siRNA (double knockdown) (middle), or RHOG siRNA/CDC42-DA (left). The scale bar is 100 μm. (M) Quantitation of (L) for total tube length with the luciferase siRNA/vector alone as the control. Data are the mean ± SEM of three independent experiments. * p < 0.05 indicates statistically significant differences.
Figure 6
Figure 6
RHOG/CDC42/RAC1 leads to tube formation through ERK and downstream from PI3K. (A) Representative images of a tube formation assay (72 h after plating) of ECV cells transfected with the vector alone, CDC42-DA, or RAC1-DA, and treated with DMSO or with 10 μM U0126 (24 h before imaging). The scale bar is 100 μm. (B,C) ECV cells were transfected either with luciferase, RHOG, CDC42, or RAC1 siRNA, or transfected with the vector alone, CDC42-DA, or RAC1-DA, and treated with 10 μM U0126 (24 h) or with the carrier (DMSO). (B) Western blot of the lysates from the different conditions mentioned above against p-ERK and ERK as controls. (C) Quantitation of (B) normalized to ERK and expressed as a fold difference from the luciferase control. Data are the mean ± SEM of three independent experiments. * p < 0.05 indicates statistically significant differences. (D) ECV cells were treated with DMSO or 10 μM U0126 or 100 nM Wortmannin (2 h) or left untreated. Cells were then lysed and pull-down assays for CDC42 were performed. Total lysates were also blotted for CDC42 as the control. The graph is a quantitation of the gel normalized to total CDC42 and expressed as a fold change to the DMSO control. Data are the mean ± SEM of three independent experiments. * p < 0.05 indicates statistically significant differences. (E) ECV cells were treated with DMSO, 10 μM U0126, or 100 nM Wortmannin (2 h), or left untreated. Cells were then lysed and pull-down assays for RAC1 were performed. Total lysates were also blotted for RAC1 as a control. The graph is a quantitation of the gel normalized to total RAC1 and expressed as a fold change to the DMSO control. Data are the mean ± SEM of three independent experiments. * p < 0.05 indicates statistically significant differences. (F) Cells were treated with DMSO control, Wortmannin, or left untreated. Cells were then lysed and blotted against p-ERK and ERK for control. The graph is a quantitation of the gel normalized to ERK and expressed as fold change to the control. Data are the mean ± SEM of three independent experiments. * p < 0.05 indicates statistically significant differences. (G) Cells were treated with DMSO or 100 nM Wortmannin (2 h) or were transfected with luciferase, RHOG, CDC42, or RAC1 siRNA (72 h). Cells were then lysed and blotted against p-AKT and AKT for the control. (H) Representative images of a tube formation assay (72 h after plating) of ECV cells transfected with the vector alone or with CDC42-DA and treated with 100 nM Wortmannin (2 h).
Figure 7
Figure 7
RHO/ROCK regulate tube formation in an ERK-independent manner. (AC) ECV cells were transfected with the luciferase control siRNA or with two different RHOA, ROCK 1 and 2 siRNA oligos, respectively. The cells were lysed and immunoblotted by Western blot analysis with anti-RHOA, anti-RHOC, anti-ROCK1, and anti-ROCK2 antibodies, and with anti-actin as the control. The graphs are quantitation of the gels normalized to actin and expressed as fold decreases compared to the luciferase control. Data are the mean ± SEM of three independent experiments. * p < 0.05 indicates statistically significant differences. (DF) Representative images of ECV tube formation assay (Scale bar is 100 μm) and quantitation of total tube length, total tube number, and the number of branching points, respectively, after 24, 48, and 72 h of treatment with RHOA, ROCK 1 and 2 siRNA vs. control. Data are the mean ± SEM of three independent experiments. * p < 0.05 indicates statistically significant differences with the luciferase control. (G) Cells were transfected with luciferase, RHOA, or RHOC siRNA, lysed and blotted against p-ERK and ERK for control. The gels were quantitated, and the level of ERK phosphorylation was expressed as the ratio p-ERK/ERK. Data are the mean ± SEM of three independent experiments. * p < 0.05 indicates statistically significant differences.
Figure 8
Figure 8
Suggested model based on the data presented in this study: RHOG positively regulates tube formation assay in ECV cells through a CDC42-RAC1-ERK. PI3K appears to be an upstream regulator of RHO GTPases leading to tube formation. RHOA and C seem to have different roles in tube formation. While RHOA leads to positive regulation of the process through ROCK1/2 as downstream effectors, RHOC does not seem to be necessary for tube formation. Finally, RHOA, unlike the RHOG-CDC42-RAC1 pathway, does not seem to exert its effect on tube formation through the MAPK pathway.

Similar articles

Cited by

References

    1. Carmeliet P., Jain R.K. Angiogenesis in cancer and other diseases. Nature. 2000;407:249–257. doi: 10.1038/35025220. - DOI - PubMed
    1. Zhao L., Xu G., Zhou J., Xing H., Wang S., Wu M., Lu Y.P., Ma D. The effect of RhoA on human umbilical vein endothelial cell migration and angiogenesis in vitro. Oncol. Rep. 2006;15:1147–1152. doi: 10.3892/or.15.5.1147. - DOI - PubMed
    1. Folkman J. Angiogenesis in cancer, vascular, rheumatoid and other disease. Nat. Med. 1995;1:27–31. doi: 10.1038/nm0195-27. - DOI - PubMed
    1. Gerber H.P., Dixit V., Ferrara N. Vascular endothelial growth factor induces expression of the antiapoptotic proteins Bcl-2 and A1 in vascular endothelial cells. J. Biol. Chem. 1998;273:13313–13316. doi: 10.1074/jbc.273.21.13313. - DOI - PubMed
    1. Nishida N., Yano H., Nishida T., Kamura T., Kojiro M. Angiogenesis in cancer. Vasc. Health Risk Manag. 2006;2:213–219. doi: 10.2147/vhrm.2006.2.3.213. - DOI - PMC - PubMed

Publication types

MeSH terms