. 2019 Feb 18;8(2):172.
doi: 10.3390/cells8020172.

Chronic Hypoxia Enhances β-Oxidation-Dependent Electron Transport via Electron Transferring Flavoproteins

Affiliations

Chronic Hypoxia Enhances β-Oxidation-Dependent Electron Transport via Electron Transferring Flavoproteins

Dominik C Fuhrmann et al. Cells. .

Abstract

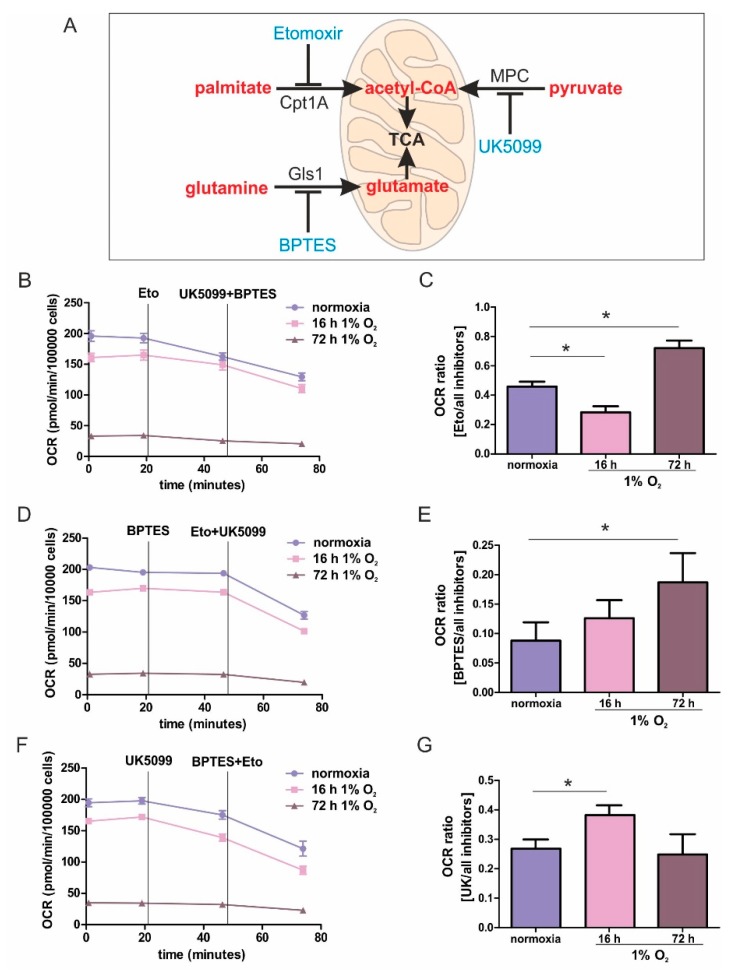
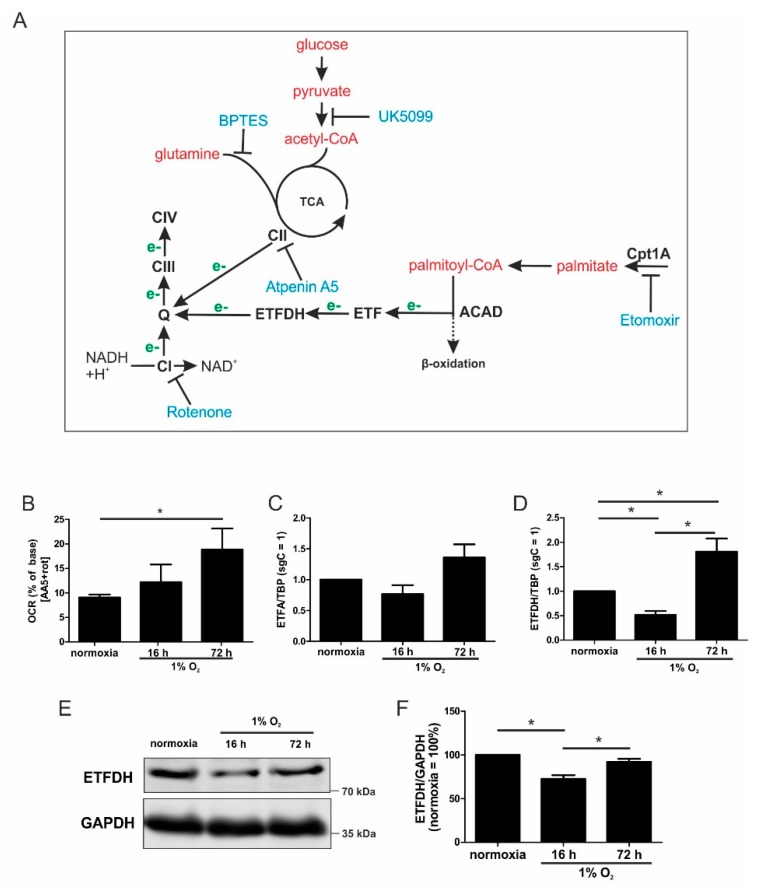
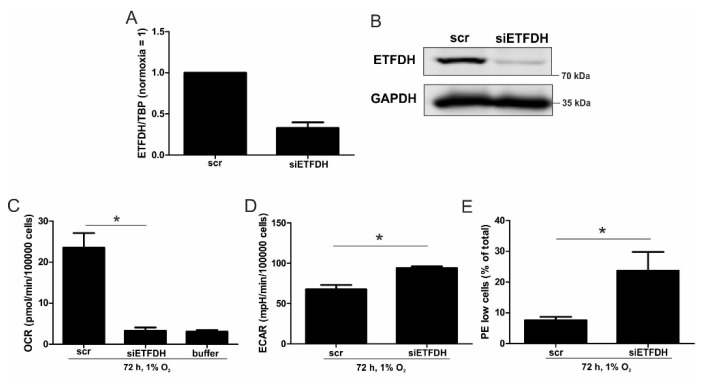
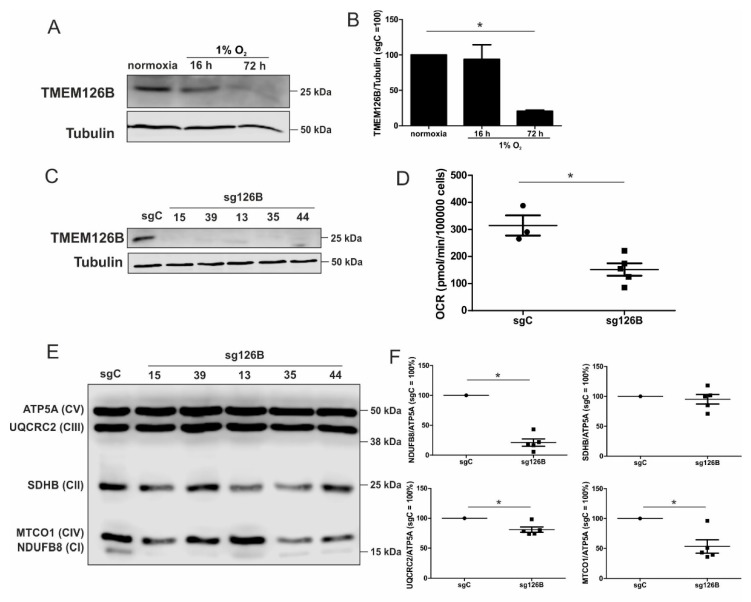
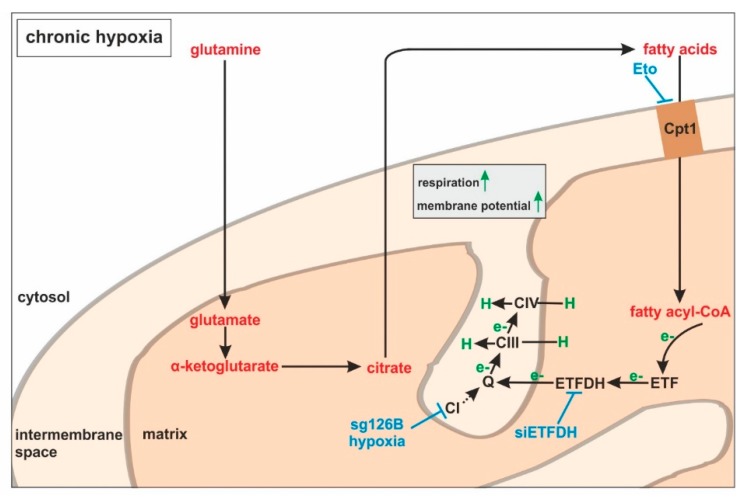
Hypoxia poses a stress to cells and decreases mitochondrial respiration, in part by electron transport chain (ETC) complex reorganization. While metabolism under acute hypoxia is well characterized, alterations under chronic hypoxia largely remain unexplored. We followed oxygen consumption rates in THP-1 monocytes during acute (16 h) and chronic (72 h) hypoxia, compared to normoxia, to analyze the electron flows associated with glycolysis, glutamine, and fatty acid oxidation. Oxygen consumption under acute hypoxia predominantly demanded pyruvate, while under chronic hypoxia, fatty acid- and glutamine-oxidation dominated. Chronic hypoxia also elevated electron-transferring flavoproteins (ETF), and the knockdown of ETF⁻ubiquinone oxidoreductase lowered mitochondrial respiration under chronic hypoxia. Metabolomics revealed an increase in citrate under chronic hypoxia, which implied glutamine processing to α-ketoglutarate and citrate. Expression regulation of enzymes involved in this metabolic shunting corroborated this assumption. Moreover, the expression of acetyl-CoA carboxylase 1 increased, thus pointing to fatty acid synthesis under chronic hypoxia. Cells lacking complex I, which experienced a markedly impaired respiration under normoxia, also shifted their metabolism to fatty acid-dependent synthesis and usage. Taken together, we provide evidence that chronic hypoxia fuels the ETC via ETFs, increasing fatty acid production and consumption via the glutamine-citrate-fatty acid axis.

Keywords: TMEM126B; complex I; electron transport chain; fatty acids; glutamine; mitochondria; monocytes.


Conflict of interest statement

The authors declare no conflict of interest.

Figures

Figure 1
Figure 1
Mitochondrial substrate fuel under normoxia, and acute and chronic hypoxia. (A) Scheme of the mitochondrial utilization of palmitate by carnitine O-palmitoyltransferase 1 (Cpt1A), pyruvate by the mitochondrial pyruvate carrier (MPC), and glutamine by glutaminase 1 (Gls1), with corresponding inhibitors (blue). (BG) THP-1 monocytes were incubated for 16 or 72 h under 1% O2 vs. normoxia. The oxygen consumption rate (OCR) was measured using a Seahorse flux analyzer. Fatty acid uptake was inhibited by etomoxir (eto), pyruvate import was antagonized by UK5099, while glutamate synthesis was suppressed by Bis-2-(5-phenylacetamido-1,3,4-thiadiazol-2-yl)ethyl sulfide (BPTES). (B,D,F) Fitted, representative OCR curves connecting rates of individual OCR rates, with and without inhibitors, are shown by straight lines. Exemplified original traces are shown in supplementary Figure S1B–D. (C,E,G) OCR is calculated as the ratio of oxygen consumption seen with one inhibitor, compared to all inhibitors. Data are mean values ± SEM, n = 3, * p < 0.05.
Figure 2
Figure 2
ETFs fuel ETC under chronic hypoxia. (A) Scheme of metabolic intermediates (red) that provide electrons (e-, green) to the electron transport chain complexes (CI, III, and IV), including the inhibitors (blue). Electrons are transferred to ubiquinone (Q) either from the tricarboxylic acid cycle (TCA) via complex II (CII), or via fatty acids imported into the mitochondria by carnitine O-palmitoyltransferase 1 (Cpt1A) using acyl-CoA dehydrogenases (ACAD) and electron-transferring flavoproteins (ETF). (B) THP-1 cells were incubated for 16 vs. 72 h under hypoxia, and OCR was measured in the presence of atpenin A5 (AA5) and rotenone (rot). The basal respiration was set to 100%. (C) ETFA mRNA expression was analyzed in hypoxic THP-1 cells and normalized to TBP (n = 7). (D) ETFDH mRNA expression, normalized to the TATA box binding protein (TBP), was followed in cells incubated for 16 vs. 72 h under hypoxia (n = 7). (E) Western analysis of ETFDH and GAPDH at the indicated times of hypoxia. (F) Quantification of E (n = 4). Data are mean values ± SEM, * p < 0.05.
Figure 3
Figure 3
OCR with a knockdown of ETFDH. (A) THP-1 cells were transfected with siRNA against ETFDH (siETFDH) or a scrambled control (scr). mRNA expression of ETFDH was analyzed after three days and normalized to TBP. (B) ETFDH protein was analyzed by Western analysis, with GAPDH serving as a loading control. (C) OCR of chronic hypoxic scr and siETFDH cells were analyzed. The buffer served as a negative control for non-cellular OCR. (D) The extracellular acidification rates (ECAR) of chronic hypoxic scr and siETFDH cells were measured by a Seahorse flux analyzer. (E) Scr and siETFDH cells were incubated for 72 h under hypoxia, stained with the mitochondrial dye JC-1, and measured by fluorescence activated cell sorting (FACS). The graph shows the percentage of cells with a low mitochondrial membrane potential (PE-low and FITC-high) under chronic hypoxia (n = 4). Data are mean values ± SEM, * p < 0.05.
Figure 4
Figure 4
Pathways of glutamine metabolism. (A) MDA-MB-231 cells were incubated for the indicated time points under hypoxia, and metabolites were measured by mass spectrometry, followed by heatmap visualization. (BG) Metabolite concentrations determined under acute and chronic hypoxia. (H) Scheme linking glutamine processing by glutaminase (Gls), glutamate dehydrogenase (Glud1), glutamine synthetase (Glul), and aspartate aminotransferase (Got2) to fatty acid metabolism via ATP-citrate lyase (ACLY), acetyl-CoA carboxylase 1 (ACC1) fatty acid synthase (FASN), carnitine O-palmitoyltransferase 1 (Cpt1A), and acyl-CoA dehydrogenase (ACAD) which transfers electrons (e-, green) to ubiquinone (Q) via electron-transferring flavoproteins (ETF). The dashed arrow indicates the conversion of α-ketoglutarate to citrate under hypoxic conditions. (IP) THP-1 cells were incubated for 16 vs. 72 h under hypoxia. mRNA expression of Gls1 (I), Gls2 (J), Glud1 (K), Got2 (L), Glul (M), ACLY (N), ACC1 (O), and FASN (P) was analyzed and normalized to TBP (n = 7). Data are mean values ± SEM, * p < 0.05.
Figure 5
Figure 5
Characterization of a TMEM126B knockout. (A) Western analysis of TMEM126B vs. tubulin, under acute and chronic hypoxia. (B) Quantification of (A) (n = 3). (C) Knockout THP-1 cells were generated via CRISPR/Cas9 gene editing using a single guide RNA against TMEM126B (sg126B) or non-target control (sgC). Western analyses of the indicated clones were performed to validate the knockout. (D) OCR was measured in sg126B clones compared to sgC controls. (E) Western analyses of respiratory chain complexes in sgC and sg126B cells. (F) Quantification of (E). Mean values of four independent experiments are depicted in the graph, * p < 0.05.
Figure 6
Figure 6
Metabolic alterations in TMEM knockout (sg126B) clones. (A) The Ratio of OCR in sgC and sg126B clones with the addition of etomoxir, and subsequent supplementation of UK5099, as well as BPTES. (BF) mRNA analyses of ETFDH (B), Gls2 (C), Got2 (D), Glul (E), and ACC1 (F) in sgC and sg126B cells normalized to TBP. Mean values of five independent experiments for each clone are depicted in the graph, * p < 0.05. For individual expression profiles, see Figure S3.
Figure 7
Figure 7
ETFs fuel the respiratory chain under chronic hypoxia. Under chronic hypoxia, glutamine is converted to glutamate, and further processed via α-ketoglutarate to citrate. In turn, citrate is used to produce fatty acids, which are imported into the mitochondria by carnitine O-palmitoyltransferase 1 (Cpt1). During fatty acid catabolism, electrons (e−) are transferred to electron-transferring flavoproteins (ETFs) and ETF−ubiquinone oxidoreductase (ETFDH). ETFDH channels electrons to ubiquinone (Q), and from there to complexes III and IV, which pump protons (H) into the intermembrane space. Inhibitory interferences by etomoxir (Eto), ETFDH knockdown (siETFDH), TMEM126B knockout (sg126B), and hypoxia are depicted in blue.

Similar articles

Cited by

References

    1. Scholz C.C., Taylor C.T. Targeting the HIF pathway in inflammation and immunity. Curr. Opin. Pharmacol. 2013;13:646–653. doi: 10.1016/j.coph.2013.04.009. - DOI - PubMed
    1. Palazon A., Goldrath A.W., Nizet V., Johnson R.S. HIF transcription factors, inflammation, and immunity. Immunity. 2014;41:518–528. doi: 10.1016/j.immuni.2014.09.008. - DOI - PMC - PubMed
    1. Mucaj V., Shay J.E., Simon M.C. Effects of hypoxia and HIFs on cancer metabolism. Int. J. Hematol. 2012;95:464–470. doi: 10.1007/s12185-012-1070-5. - DOI - PubMed
    1. Catrina S.B., Okamoto K., Pereira T., Brismar K., Poellinger L. Hyperglycemia regulates hypoxia-inducible factor-1alpha protein stability and function. Diabetes. 2004;53:3226–3232. doi: 10.2337/diabetes.53.12.3226. - DOI - PubMed
    1. Fuhrmann D.C., Wittig I., Heide H., Dehne N., Brune B. Chronic hypoxia alters mitochondrial composition in human macrophages. BBA-Proteins Proteom. 2013;1834:2750–2760. doi: 10.1016/j.bbapap.2013.09.023. - DOI - PubMed

Publication types

MeSH terms

Substances

LinkOut - more resources